Aerosols, Monsoon Rainfall Variability, and Climate Change
Aerosols, Monsoon Rainfall Variability, and Climate Change
Aerosols, Monsoon Rainfall Variability, and Climate Change

You also want an ePaper? Increase the reach of your titles
YUMPU automatically turns print PDFs into web optimized ePapers that Google loves.
Aerosol, Asian <strong>Monsoon</strong> <strong>and</strong><br />
<strong>Climate</strong> <strong>Change</strong><br />
William K. M. Lau<br />
William K. M. Lau<br />
Laboratory for Atmospheres<br />
NASA/Goddard Space Flight Center
• Aerosol-climate change primer<br />
• Possible impacts of aerosols on<br />
- Asian monsoon water cycle<br />
- Accelerated melting of snowpack in<br />
the Himalayas <strong>and</strong> Tibetan Plateau<br />
• Adaption <strong>and</strong> mitigation
Global Warming ≠ <strong>Climate</strong> <strong>Change</strong><br />
<strong>Climate</strong> change is a change in the statistical distribution of wea<br />
ther over periods of time that range from season, years, decad<br />
es to millions of years. It can be a change in the average weat<br />
her or a change in the distribution of weather events around a<br />
n average (for example, greater or fewer extreme weather eve<br />
nts). <strong>Climate</strong> change may be limited to a specific region, or an<br />
environment, or may occur across the whole Earth System<br />
Global warming is a realization of the effects of well-mixed gre<br />
enhouse gases associated with modern (approx. since the last<br />
two centuries) climate change<br />
4
Rapid industralization in Asian countries<br />
5
Energy dem<strong>and</strong>s by types in China<br />
coal<br />
oil<br />
gas<br />
6
<strong>Climate</strong> <strong>Change</strong> in China<br />
• Surface temperature over China has increased by more 2 o C<br />
since 1900, <strong>and</strong> increasing by more than 0.3 degree per<br />
decade since 1980.<br />
• About 30-50% of the increase may have been masked by<br />
aerosols.<br />
• The average depth of the permafrost over the Tibetan<br />
Plateau, <strong>and</strong> glacier coverage has shrunk by 5-10% in the<br />
last 30 years<br />
• Temperature over Asia will rise by additional 3-5 o C, depending<br />
on various emission scenarios, <strong>and</strong> even with stabilization<br />
(450 ppm by 2050), temperature will continue rise at about<br />
1 o C per 100 years, in the next century.<br />
<strong>Climate</strong> Assessment Report Bejing <strong>Climate</strong> Center, 2008<br />
7
“……human influences are significant <strong>and</strong> involve a<br />
diverse range of first-order climate forcings, including, b<br />
ut not limited to the human input of well mixed<br />
greenhouse gases (CO 2 , CH 4 , N 2 Oetc) etc.) The<br />
impacts of these other forcings are critically<br />
important in exciting climate feedbacks on regional<br />
<strong>and</strong> local l scales, <strong>and</strong> din modulating the greenhouse war<br />
ming effects.”<br />
<strong>Climate</strong> <strong>Change</strong>: The Need to Consider Human Forcings Other<br />
than Greenhouse Gases, EOS, American Geophysical Union,<br />
November issue<br />
By Roger Pielke Sr 1 ., Keith Beven 2 , Guy Brasseur 3 , Jack Calvert 3 , Moustafa Ch<br />
ahine 4 , Russ Dickerson 5 , Dara Entekhabi 6 , Efi Foufoula-Georgiou 7 , Hoshin Gupt<br />
a 8 , Vijay Gupta 1 , Witold Krajewski 9 , E. Philip Krider 8 , William K. M. Lau 10 , Jeff M<br />
cDonnell 11 , William Rossow 12 , John Schaake 13 , James Smith 14 , Soroosh Soroo<br />
shian 15 , Eric Wood 14 8
<strong>Aerosols</strong> <strong>and</strong> the Asian <strong>Monsoon</strong><br />
• Over 60% of world population live in the Asian monsoon regions<br />
• <strong>Monsoon</strong> related droughts <strong>and</strong> floods, <strong>and</strong> aerosols are the two most<br />
serious environmental hazards in Asian monsoon regions,<br />
• The monsoon water cycle is driven by atmospheric heating, through the dyn<br />
amical interaction of wind, moisture, clouds <strong>and</strong> rainfall.<br />
• Sea surface temperature, <strong>and</strong> l<strong>and</strong> surface processes alter monsoon water c<br />
ycle, through generation of surface heating gradients <strong>and</strong> atmospheric<br />
heat sources <strong>and</strong> sinks.<br />
• Suspended particles (aerosol, clouds, precipitation) in the atmosphere<br />
regulate <strong>and</strong> dinteract twith ithheat sources <strong>and</strong> sinks, <strong>and</strong> alter the monsoon w<br />
ater cycle<br />
9
Definition of aerosol<br />
An aerosol is a suspension of fine solid particles or liquid droplets in<br />
a gas. <strong>Aerosols</strong> come from both man-made made (industry, motor<br />
vehicles), <strong>and</strong> natural sources (forest fires, oceanic haze, deserts).<br />
Examples are: sulfate, soot (black carbon), organic carbon, dust,<br />
sea salt.<br />
Soot is impure carbon particles resulting from incomplete combustion<br />
of a hydrocarbon e.g., from internal combustion engines, power<br />
plants, heat boilers, waste incinerators, furnaces, fireplaces, slash<br />
<strong>and</strong> burn agriculture, forest fires.<br />
Volcanic ash<br />
Sea Salt<br />
Tractor soot
<strong>Aerosols</strong> alter energy balance of<br />
the atmosphere-ocean-l<strong>and</strong> system<br />
Radiation (Direct) Effects<br />
Back Scattering (Cooling)<br />
Microphysics (Indirect)<br />
Effects<br />
Absorption<br />
(Atmospheric<br />
Column Warming by ab<br />
sorbing aerosols<br />
e.g. dust <strong>and</strong> soot)<br />
Warm Rain suppression, Increased<br />
cloud life time (cooling)<br />
Increased ice nucleation, enhanced de<br />
ep convection (warming)<br />
Forward<br />
Scattering<br />
Dimming of Earth<br />
Aerosol induced cloud-shielding<br />
Surface (Cooling) Surface dimming<br />
11
Microphysics (indirect) effects of aerosols on<br />
warm rain <strong>and</strong> ice-phase rain<br />
Water cloud<br />
Snowing cloud<br />
Suppress<br />
warm rain<br />
CCN<br />
Oxidation, Nucle<br />
ation<br />
CCN/IN<br />
Enhance ice nucleation,<br />
increase cold rain/snow<br />
∗ ∗<br />
∗<br />
SO 2 , NO x , Organics, Soot<br />
Soil dust<br />
saltation<br />
Industry<br />
Biomass<br />
burning<br />
Automobiles
<strong>Aerosols</strong> mask global warming effects<br />
GFDL CM 2.1<br />
13
<strong>Aerosols</strong> have done a lot more than<br />
just “offset” the global-mean surface<br />
temperature t due to Long-Lived<br />
Li Greenhouse Gases, but also altered<br />
regional water cycle <strong>and</strong> climate in<br />
ways that are still not understood, or<br />
even known!!
<strong>Climate</strong> change hazards in Asia<br />
Dust storm<br />
Industrialization<br />
smok<br />
15<br />
15
NASA’s<br />
Satellites<br />
Taking the<br />
Pulse of the<br />
Earth<br />
16
Aerosol-Hotspots<br />
Aqua Collection-05 Aerosol (Deep Blue & MODIS Composite)<br />
March-April-May<br />
June-July-August<br />
September-October-November<br />
2005<br />
December-January-February<br />
Courtesy C. Hsu 17<br />
τ λ (0.55µm)
Aerosol-induced anomalies of surface air<br />
temperature in NASA fvGCM<br />
Lau et al. 2006, <strong>Climate</strong> Dynamics 18
Anomalies of temperature <strong>and</strong> vertical motion (80-<br />
100E) induced by absorbing aerosols (dust <strong>and</strong><br />
black carbon) in GCM simulations<br />
Lau et al, (2006a,b)<br />
19
Characteristic EHP large<br />
scale pattern :<br />
Enhanced tropospheric p warm<br />
ing over the Tibetan Plateau<br />
<strong>and</strong> increased monsoon rainf<br />
all <strong>and</strong> winds in June-July,<br />
following major build-up up of<br />
absorbing aerosol (dust <strong>and</strong><br />
BC) over the Indo-Gangetic<br />
Plain in April-May<br />
Data source: TOMS AI, GPC<br />
P, <strong>and</strong> NCEP re-analyses<br />
Lau <strong>and</strong> Kim, 2006, GRL
The Elevated Heat Pump (EHP) hypothesis<br />
(Lau et al. 2006, Lau <strong>and</strong> Kim 2006, Lau et al 2008)<br />
E<br />
Warm<br />
Normal monsoon<br />
Water cycle (mid-May to<br />
mid-June)<br />
θe<br />
W<br />
warm<br />
Warmer<br />
E<br />
Warm<br />
EHP-accelerated<br />
<strong>Monsoon</strong> water cycle<br />
(mid-May –June)<br />
θe<br />
W<br />
Cool<br />
EHP postulates:<br />
a) Warming <strong>and</strong> moistening of the upper troposphere over the Tibetan Plateau<br />
b) An advance of the rainy season in northern India/Napal region in May-June<br />
c) The increased convection spreads from the foothills of the Himalayas<br />
to central India, resulting in an intensification of the Indian monsoon. in June-July<br />
d) Subsequent reduction of monsoon rain in central India in July-August<br />
e) Enhanced snowmelt <strong>and</strong> rapid retreat of mountain glacier 21
<strong>Climate</strong> <strong>Change</strong> is “a clear <strong>and</strong> present danger”<br />
in high-mountain regions<br />
• Sixty-seven percent of glaciers are retreating at a startling rate<br />
in the Himalayas, <strong>and</strong> the major causes have been identified as<br />
global warming . Ageta <strong>and</strong> Kadota 1992, Yamada et al. 1996,<br />
Fushinmi 2000)<br />
• Overall, Himalaya glaciers are losing mass rapidly at a rates<br />
about 500 -1000 kg m -2 /year, but rates are highly hl variable in space<br />
<strong>and</strong> time. However Himalaya glacier will NOT disappear<br />
by 2035, as previously reported by IPCC 2007 (J. Kargel et al.<br />
2009).<br />
• Himalayas mountain regions are already suffering from major<br />
environmental degradation: floods from bursting of glacier lakes,<br />
soil erosion, shortage of water <strong>and</strong> power supply, loss of biodiversity……
<strong>Climate</strong> <strong>Change</strong> is devastating high-mountain countries<br />
(Nepal, Bhatan, Pakistan-K2..)<br />
• Diminished fresh water supply<br />
• Increased flooding of river basins<br />
• Reduced agriculture productivity<br />
• Increased health hazards<br />
• Increased Glacial lake outburst floods (GLOFs)<br />
• Shortage of energy <strong>and</strong> power resources:<br />
hydro-electric, coal-burning, biofuel…<br />
• Highly stressed eco-system,<br />
threatened biodiversity <strong>and</strong> wildlife<br />
Tsho Rolpa Glacier Lake, Ne<br />
pal<br />
Near Sundari Ghat, Bagmati, 2002 July<br />
23
Accelerated melting of Himalaya-Tibetan Plateau glacier will<br />
endanger the water supply of the entire Asia!<br />
The Himalaya-Tibetan Plateau Glaciers feed seven of Asia’s<br />
great rivers: the Ganga, Indus, Bramaputra, Salween,<br />
Mekong, Yangtze, <strong>and</strong> Yellow River that supply fresh water<br />
to many countries in Asia.<br />
24
Possible causes of accelerated snowmelt <strong>and</strong><br />
glacier retreat in the Himalayas <strong>and</strong><br />
Tibetan Plateau<br />
• Greenhouse Warming<br />
• Atmospheric heating due to aerosols<br />
• Snow-darkening effect from soot <strong>and</strong> dust
EHP induced heating <strong>and</strong> moistening along 80 o E<br />
Temperature (shading, K) & SW Heating Rate (K/day)<br />
May<br />
Specific Humidity (shading, g/Kg) & SW Heating Rate (K/day)<br />
May
Effect of absorbing aerosols on snow melt<br />
over the Tibetan Plateau (EHP Effect)<br />
(GEOS4‐fvGCM with Slab Ocean Model)<br />
Aerosol Optical Depth<br />
1. Slow melting phase (I) in April is initiated by<br />
sensible heat transfer from warmer atmosphere to<br />
l<strong>and</strong>.<br />
2. Rapid melting phase (IIA) is due to an<br />
evaporation-snow-l<strong>and</strong> feedback coupled to an<br />
increase in moisture over TP<br />
3. Melting is slowed down by increasing surface<br />
evaporation in Phase IIB.<br />
4. Partial recovery (Phase III)<br />
Surface Skin Temp (AA-NA)<br />
Lau, K. M., M. K. Kim, K. M. Kim, <strong>and</strong> W. S. Lee, 2010: Enhanced surface warming <strong>and</strong> accelerated snow melt in<br />
the Himalayas <strong>and</strong> Tibetan Plateau induced by absorbing aerosols. Environ. Res. Lett.
“Snow Darkening Effect”:<br />
Black Carbon <strong>and</strong> Dust deposited on snow<br />
surface make it darker. A darker surface absorbs<br />
more sunlight, <strong>and</strong> melts faster<br />
28
The highest aerosol observatory, NCO-P (ABC-Pyramid):<br />
the southern slope of the Himalayas (5079 m a.s.l.)<br />
Meteorological parameters, Optical Particle Counter (OPC; 0.25-32 µ<br />
m), Scanning Mobility Particle Sizer (SMPS; 10.31-669.8 nm), <strong>and</strong> eq<br />
uivalent Black Carbon concentration (MAAP) data in 2006 at NCO-P s<br />
ite were observed (Bonasoni et al., 2008) <strong>and</strong> used in this study.<br />
NCO-P site (ABC-Pyramid site): http://evk2.isac.cnr.it/<br />
T. J. Yasunari et al (2010, submitted).
Estimated “lower limit” of BC deposition<br />
over Himalayan glaciers<br />
BC deposition of 209 µg/m 2 by dry fallout du<br />
ring March-May in 2006 (2.27 µg m -2 day -1 )<br />
Surface snow density<br />
2 r<br />
2 ( ρ<br />
at Yala glacier:195 to 512 kg/m 3<br />
BC<br />
−<br />
vs<br />
=<br />
(Fujita et al., 1998)<br />
9<br />
η<br />
ρ<br />
Air<br />
) g<br />
2cm surface snow<br />
Yasunari et al (2010, ACP)
m w.e.]<br />
glacier [m<br />
noffs from<br />
Differe ences of ru<br />
Increased total annual runoffs of 54-149 mm w.e.<br />
Estimation of additional annual runoff<br />
4.5<br />
4.0<br />
from Dongkemadi glacier • corresponding to<br />
9024 9.0-24.8% of total annual runoff of the glacier.<br />
from snow-darkening effect<br />
3.5<br />
3.0<br />
2.5<br />
2.0<br />
1.5<br />
1.0<br />
05 0.5<br />
0.0<br />
1992 2/9/8<br />
1992 2/9/23<br />
Albedo decrease of 1.6% -•Using Control a glacier run mass balance model<br />
(Fujita, 2007, Fujita et al., 2007).<br />
Albedo decrease of 4.1% - with Control the same run input data as used in p<br />
revious studies<br />
A case of a tyipical Ti<br />
betan glacier<br />
1992<br />
1992<br />
2/10/23<br />
2/10/8<br />
1992 2/11/7<br />
1992 2/11/22<br />
1992<br />
1992<br />
2/12/22<br />
2/12/7<br />
1993 3/1/6<br />
1993 3/1/21<br />
1993<br />
1993<br />
3/2/20<br />
3/2/5<br />
1993 3/3/7<br />
• Over a typical Tibetan glacier<br />
(Dongkemadi glacier), continuous<br />
albedo reductions of 1.6 & 4.1%<br />
may increase by 9.0-24.8% the<br />
annual run off from discharge of<br />
melted snow<br />
1993 3/3/22<br />
1993 3/4/6<br />
1993 3/4/21<br />
Date<br />
1993 3/5/6<br />
1993 3/5/21<br />
1993 3/6/5<br />
1993 3/6/20<br />
1993 3/7/5<br />
1993 3/7/20<br />
1993 3/8/4<br />
1993 3/8/19<br />
1993 3/9/3<br />
1993 3/9/18<br />
1993<br />
1993<br />
3/10/18<br />
3/10/3<br />
1993 3/11/2
Building up the case for importance of absorbing<br />
aerosols (black carbon <strong>and</strong> dust) in impacting<br />
monsoon water cycle <strong>and</strong> climate.<br />
Heating by absorption of solar radiation by soot <strong>and</strong> dust in the Hindu-<br />
Kush-Tibetan-Himalayas (HKHT) region initiates an atmospheric<br />
feedback via the EHP effect leading to:<br />
• Increased mid-tropospheric radiative heating along Himalayas foothills<br />
enhances convection in northern India, leading to warming <strong>and</strong><br />
moistening of the middle <strong>and</strong> upper troposphere over the HKHT region;<br />
enhancing the early summer monsoon…….<br />
• The hotter <strong>and</strong> moister atmosphere transfers sensible <strong>and</strong> latent heat to<br />
the HKHT l<strong>and</strong> surface, enhancing early spring snow melt<br />
Snow-darkening effect with typical soot deposition, may lead to 1-4 %<br />
reduction in surface albedo; leading to 9-24% increase in annual runoff<br />
in a typical TP glacier.<br />
• Both EHP <strong>and</strong> snow darkening effect may accentuate greenhouse<br />
warming, leading to early season snowmelt <strong>and</strong> accelerated glacier<br />
retreat.<br />
t
Societal /Moral Dilemmas<br />
1) Life Time of Greenhouse Gases effects are centuries or longer<br />
Doing nothing now, will cause us much more later!<br />
Should we let our gr<strong>and</strong> children deal with it?<br />
Should climate change policies be based on equal shared burden<br />
for all or provide help for the under-developed first ?<br />
2) GHGs vs. <strong>Aerosols</strong><br />
The warming that we are experiencing e now is only a portion o (~ 60- 70%) of<br />
what we expect from well mixed gas greenhouse effect , because of cooling<br />
(masking) effects by aerosols. Air Pollution has shorter lifetime (days, weeks),<br />
compared to GHG (decadal, century time scale), <strong>and</strong> is easier to realize benefit,<br />
global warming will be enhanced without it.<br />
but<br />
3) Geo Engineering ?? e.g. injecting sulphate aerosols in lower stratosphere…<br />
Don’t go there. Beware of the “Law of Unintended Consequences” !.<br />
4) Regionally, the science is still unfolding, <strong>and</strong> Asia is potentially<br />
the most vulnerable region:<br />
Pollution may induce droughts <strong>and</strong> floods in Asian monsoon regions;<br />
Accelerated melting of high mountain glaciers caused by black carbon <strong>and</strong> dust<br />
Asian countries should adopt different priorities, compared to more<br />
industrialized countries<br />
33
Back Up
Estimated BC concentration in 2 cm surface snow with<br />
surface snow density variations at Yala glacier<br />
125<br />
The curve of BC deposition of 209 µg/m 2<br />
)<br />
entration<br />
w (μg/kg)<br />
BC conce<br />
rface snow<br />
stimated<br />
n 2 cm sur<br />
E<br />
in<br />
100<br />
75<br />
50<br />
25<br />
15<br />
The BC concentration of 15 µg kg −1 in snow may reduce the snow<br />
albedo by 1% (Grenfell et al., 1994; Warren <strong>and</strong> Wiscombe, 1980).<br />
41%albedo 4.1% reduction<br />
1.6% albedo reduction<br />
Calculated by the linear regres<br />
sion equation between BC con.<br />
<strong>and</strong> albedo reduction by Ming<br />
et al., Atmos. Res., 2009.<br />
Yala glacier<br />
0<br />
50 250 450 650 850<br />
Snow density (kg/m 3 )<br />
917
Absorbing aerosols (dust <strong>and</strong> BC) reduce snowcover<br />
but reflecting aerosols (sulphate) increase snowcover<br />
in western Himalayas<br />
2-m air temperature 2-m air temperature<br />
Snow cover<br />
Snow cover<br />
All <strong>Aerosols</strong>–minus-No <strong>Aerosols</strong><br />
Sulphate only –minus-No <strong>Aerosols</strong>
May/June Difference between 2004 <strong>and</strong> 2005<br />
Dirtier year minus cleaner year<br />
Upper level Temperature & Wind<br />
Moisture & Vertical Winds<br />
Temperature & winds (v-w)<br />
Lower level Winds & <strong>Rainfall</strong>
Interannual Variation of Snow Water Equivalent<br />
(Aerosol vs El Nino)<br />
Aerosol Effect<br />
Heating of the atmosphere by dust <strong>and</strong><br />
BC can lead to widespread enhanced<br />
warming over the TP <strong>and</strong> accelerated<br />
snow melt in the western TP <strong>and</strong><br />
Himalayas. (Lau et al. 2010)<br />
Decreased snow albedo due to BC/dust<br />
deposition can further accelerate snow<br />
melt (Yasunari et al. 2010)<br />
El Nino Effect<br />
The atmospheric teleconnection pattern<br />
initiated by ENSO increase snowfall over<br />
TP during winter. The increased snowfall<br />
produces a larger snowpack which lasts<br />
through the spring <strong>and</strong> summer, <strong>and</strong><br />
subsequently weaken the Indian monsoon<br />
(Shaman <strong>and</strong> Tziperman 2005).
Merdional cross-section section of aerosol concentration from Calipso<br />
June 21,2006<br />
Indo-Gangetic Basin<br />
Taklamakan<br />
Desert<br />
June 22, 2006<br />
northeastern IGB<br />
Reference”<br />
Lau, K.-M., K.-M. Kim (2008), Absorbing aerosols enhance Indian summer monsoon rainfall. iLEAPS<br />
Newsletter, No. 5, 22-24. 39
Relative percentage change of surface albedo (due to changes<br />
in snow-cover, <strong>and</strong> exposure of underlying l<strong>and</strong> surface )<br />
Slow melting fast melting quasi-equilibrium partial recovery
GEOS GCM, Aerosol-minus-No Aerosol, for month of May<br />
2-m air temperature e Precipitation<br />
SH 700-300 hPa<br />
Total cloud cover %
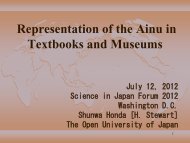
Enhanced surface warming <strong>and</strong> accelerated melting of<br />
snowpack in the Himalayas <strong>and</strong> Tibetan Plateau<br />
induced by absorbing aerosols<br />
William K. M. Lau,<br />
Laboratory for Atmospheres<br />
NASA/Goddard Space Flight Center<br />
Coauthors: K.M. Kim, R. Gautam, C. Hsu, T. Yasunari, M.K. Kim, W. S. Lee
National Geographic
AOT of total GOCART aerosols<br />
May<br />
Area-averaged composition<br />
of aerosols in May<br />
Region<br />
Aerosol<br />
Type<br />
IGP<br />
[ 75~90°E,<br />
17.5~30°N]<br />
TP<br />
[ 80~95°E,<br />
30~35°N]<br />
Central<br />
China<br />
[105~120 °E,<br />
25~35°N]<br />
All<br />
aerosols<br />
0.24 0.15 0.73<br />
Surface skin temperature()<br />
Dirty-minus-Clean<br />
Black<br />
Carbon<br />
(11.7%) (10.7%) ( 8.0%)<br />
Dust (41.9%) (43.3%) (15.8%)<br />
Sulfate (15.8%) (22.3%) (62.5%)<br />
Organic<br />
Carbon<br />
(26.5%) (20.4%) (12.4%)<br />
Sea salt ( 38%) 3.8%) ( 30%) 3.0%) ( 11%) 1.1%)<br />
Lau et al. 2010 ERL
How absorbing are dust aerosols ????<br />
Comparison of Asian Dust Single Scattering Albedo<br />
versus Saharan <strong>and</strong> Saudi Arabian Dust<br />
1.00<br />
0.98<br />
absorbing<br />
More<br />
Single<br />
Scattering Albedo<br />
0.96<br />
0.94<br />
0.92 Beijing<br />
Anmyon, S. Korea<br />
Dunhuang, China<br />
Kanpur, India<br />
0.90<br />
Cape Verde<br />
Saudi Arabia - SV<br />
Bahrain<br />
0.88<br />
400 500 600 700 800 900 1000 1100<br />
Wavelength (nm)<br />
Micrographs of<br />
soot coating <strong>and</strong> aggregate<br />
on mineral dust from Asian dus<br />
t (courtesy of J. Anderson)<br />
Dusts over major industrial cities are more absorbing (solar radiation)<br />
T. Eck et al 2004<br />
45
The Elevated Heat Pump Hypothesis<br />
(Lau et al. 2006, Lau <strong>and</strong> Kim 2006)<br />
Dust transport from Middle<br />
East <strong>and</strong> Thar desert into<br />
IG plains<br />
Somali Jet<br />
May -June<br />
Increase dust <strong>and</strong> moisture<br />
transport from low level<br />
monsoon westerlies<br />
Absorbing dust <strong>and</strong> BC<br />
accumulated on foothills of<br />
Himalayas accentuate<br />
atmospheric heating by<br />
sensible heat flux over Tibetan Pl<br />
ateau<br />
Increased convection over<br />
Bay of Bengal, eastern TP,<br />
NE <strong>and</strong> central India<br />
May-June
Courtesy: Jeff Kargel
Seasonal mean of snow cover fraction(%) over TP from 2000 to 2009
NASA fvGCM Experimental Set-up<br />
• Four sets of 8 year simulations (2000-2007), 2007), coupled to<br />
mixed layer ocean, <strong>and</strong> interactive l<strong>and</strong> surface model, with<br />
same CO2 forcing, for:<br />
• Control (dirty) with prescribed seasonally varying aerosol<br />
loading (dust, BC, OC, sulfate, <strong>and</strong> sea salt), <strong>and</strong> computed<br />
radiative forcing, i.e., all aerosol (AA)<br />
• Anomaly (clean world): with aerosol radiative forcing<br />
disabled, i.e., no aerosol (NA).<br />
•Additional experiments: non absorbing aerosol (sulphate)<br />
•Additional experiments: non-absorbing aerosol (sulphate)<br />
only
Generalized glacier<br />
Equilibrium Line Altitude<br />
(where snow accumulation is balanced by<br />
loss of ice mainly from melting)<br />
Courtesy: Jeff Kargel
CONTACT: Jeff Kargel<br />
Generalized glacier<br />
The Equilibrium Line Altitude is where snow accumulation (snowfall an<br />
d any added snow avalanches) is balanced by melting <strong>and</strong> sublimation<br />
losses. It is not the same as the elevation where annual average temp<br />
erature is at the melting point (but there is a relationship).<br />
Equilibrium Line Altitude<br />
(where snow accumulation lti is balanced bl dby<br />
loss of ice mainly from melting)<br />
Ice flows down to warmer climate zones.<br />
Melts faster than the snow season adds new snow.<br />
Downslope flow <strong>and</strong> melting maintain glacier length (if in mass balance).
Possible major causes of accelerated<br />
snowmelt <strong>and</strong> glacier retreat<br />
• Sixty-seven percent of glaciers are retreating at a startling rate<br />
in the Himalayas, <strong>and</strong> the major causes have been identified as<br />
global warming . Ageta <strong>and</strong> Kadota 1992, Yamada et al.<br />
1996, Fushinmi 2000). Overall, Himalaya glaciers are losing<br />
mass rapidly at a rates about 500 -1000 kg m -2 /year, but rates<br />
are highly variable in space <strong>and</strong> time.<br />
• <strong>Aerosols</strong> may accelerated snowmelt <strong>and</strong> glacier retreat.<br />
- Atmospheric heating due to aerosols<br />
- Snow darkening effect
Summary<br />
1. Previous results from GCM experiments shows that the heating by<br />
absorption of solar radiation by soot <strong>and</strong> dust in the IGP region initiates<br />
an atmospheric feedback via the EHP effect leading to:<br />
- Increased mid-tropospheric radiative heating along Himalayas<br />
foothills enhances convection in northern India, leading to warming<br />
<strong>and</strong> moistening i of the middle <strong>and</strong> upper troposphere over the TP<br />
<strong>and</strong> early snow melt<br />
2. Observations show that mid to upper tropospheric temperature<br />
warming is prominent in the year (2004) with high aerosol loading over<br />
north-west India <strong>and</strong> IGP as compare to low AOD year (2005).<br />
Anomalous patterns of IGP rainfall, surface temperature at the TP , <strong>and</strong><br />
the snow water equivalent are consistent with those from model<br />
simulation.
State of Gujar<br />
at<br />
Western India<br />
What cause these..<br />
June 2003, drought<br />
for the 4 th year in a row<br />
worst flood<br />
in 35 years<br />
Terra/MODIS<br />
Mekong river<br />
Composite of ASTER/L<strong>and</strong>sat images <strong>and</strong> h<br />
istorical photographs p depicts how the Indian<br />
Gangotri Glacier terminus has retracted sinc<br />
e 1780 (the GLIMS project: Kieffer et al., 20<br />
54<br />
00, Global L<strong>and</strong> Ice Measurements from Sp
Observational Case Study<br />
2004 vs 2005<br />
Aqua AOD + DeepBlue<br />
Apr-May (2004 minus 2005)<br />
Data Used<br />
MODIS AOD<br />
Snow cover (MODIS/Terra)<br />
Snow Water Equivalent<br />
(SSMR & SSM/I) & (AMSR-E)<br />
MERRA Winds & Temperature<br />
Surface Temperature (AIRS)<br />
Nino3 SST Index
MODIS Terra true-color composite<br />
The world is more than 60% covered by clouds on the average.<br />
Clouds over subtropical East Asia/Southern China<br />
in April-May are exceptionally bright. Why?
EHP signals are detected in observed long-term temperature <strong>and</strong> rainfall<br />
for the South Asian monsoon!<br />
Lau <strong>and</strong> Kim (2010, GRL)
EHP associated teleconnection (1987-2009)<br />
<strong>Rainfall</strong> anomalies<br />
North/drought – South/wet rainfall dipole in East Asia in June<br />
-July
April-May mean aerosol optical depth(AOD) from 2000 to 2009<br />
The dusts in IGP are coated with<br />
black carbon produced from<br />
local emissions <strong>and</strong> become a<br />
strong absorber of solar<br />
radiation <strong>and</strong> an efficient source<br />
of atmosphere heating( Lau <strong>and</strong><br />
Kim, 2006).<br />
Area mean monthly AOD anomaly over IGP<br />
[70~90E, 20~30N]<br />
April to May<br />
• High AOD : 2004<br />
• Low AOD : 2005<br />
• Nino3 Index<br />
DJF 2004: 0.29<br />
DJF 2005: 0.26<br />
DJF 2003: 0.83
May/June Difference between 2004 <strong>and</strong> 2005<br />
Dirtier year minus cleaner year<br />
Increased surface temperature<br />
(AIRS) over NW India <strong>and</strong><br />
HKHT<br />
R d d S W t E i l t<br />
Reduced Snow Water Equivalent<br />
(Aqua) more rapid snowmelt
Intra-seasonal variation<br />
Dirtier year (MJ 2004) minus cleaner year (MJ 2005)<br />
Increased AOD over<br />
N. India<br />
Increased Upper<br />
level Temperature<br />
Tibetan Plateau<br />
Decreased Snow<br />
Cover over TP<br />
Increased <strong>Rainfall</strong><br />
over N. India