(ceres) validation plan monthly regional toa and surface ... - NASA
(ceres) validation plan monthly regional toa and surface ... - NASA
(ceres) validation plan monthly regional toa and surface ... - NASA

Create successful ePaper yourself
Turn your PDF publications into a flip-book with our unique Google optimized e-Paper software.
CLOUDS AND THE EARTH’S RADIANT ENERGY SYSTEM<br />
(CERES)<br />
VALIDATION PLAN<br />
MONTHLY REGIONAL TOA AND SURFACE RADIATION<br />
BUDGET (SUBSYSTEM 10.0)<br />
Takmeng Wong<br />
David F. Young<br />
Patrick Minnis<br />
Gary G. Gibson<br />
Atmospheric Science Division<br />
<strong>NASA</strong> Langley Research Center<br />
Hampton, Virginia 23681<br />
Release 4.0<br />
August 2000
CERES Validation Plan - Subsystem 10.0 Release 4.0<br />
CERES VALIDATION PLAN<br />
10.0 MONTHLY REGIONAL TOA AND SURFACE RADIATION<br />
BUDGET<br />
10.1 INTRODUCTION<br />
10.1.1 Measurement <strong>and</strong> science objectives<br />
The science objective of the CERES (Wielicki et al., 1996, 1998) <strong>monthly</strong> mean top-of-atmosphere<br />
(TOA) <strong>and</strong> <strong>surface</strong> radiation budget (SRB) averages data product is to accomplish the dual<br />
goals of providing a stable, long-term <strong>monthly</strong> mean data set of shortwave (SW) <strong>and</strong> longwave<br />
(LW) radiative parameters at the TOA <strong>and</strong> <strong>surface</strong> using a data processing system consistent with<br />
the Earth Radiation Budget Experiment (ERBE; Barkstrom 1984) <strong>and</strong>, at the same time, producing<br />
the most accurate <strong>monthly</strong> mean data set currently available based on state-of-the-art techniques.<br />
To accomplish these goals, CERES will produce <strong>regional</strong>, zonal, <strong>and</strong> global means by<br />
both the ERBE-like technique <strong>and</strong> the geostationary-enhancement method (Young et al., 1998).<br />
10.1.2 Missions<br />
The CERES instruments will be flown on multiple satellites, which include TRMM, Terra,<br />
<strong>and</strong> Aqua, to provide the diurnal sampling necessary to obtain accurate <strong>monthly</strong> averages of the<br />
TOA radiative parameters.<br />
10.1.3 Science data products<br />
The CERES TISA data algorithm for Subsystem 10 produces the <strong>monthly</strong> TOA <strong>and</strong> SRB<br />
average data product (SRBAVG) which contains <strong>monthly</strong> <strong>and</strong> <strong>monthly</strong>-hourly <strong>regional</strong>, zonal,<br />
<strong>and</strong> global averages of the TOA <strong>and</strong> <strong>surface</strong> LW <strong>and</strong> SW fluxes <strong>and</strong> the observed cloud conditions<br />
for each CERES 1-degree equal-angle region. This product differs from the AVG product in Subsystem<br />
8 in three ways. First, the <strong>surface</strong> fluxes are calculated from the TOA fluxes using TOA-to<strong>surface</strong><br />
parameterization, instead of using the radiative transfer models provided by the SARB<br />
subsystem. Second, no flux fields are calculated at levels between the TOA <strong>and</strong> <strong>surface</strong>. Lastly,<br />
the <strong>regional</strong> fluxes are calculated using both the ERBE-like method <strong>and</strong> the geostationary data<br />
enhancement technique. There is an SRBAVG product for each spacecraft <strong>and</strong> for each combination<br />
of spacecraft. There are 69 data parameters in each of the SRBAVG data products. These<br />
include mean estimates of SW <strong>and</strong> LW radiant flux at the TOA <strong>and</strong> at the <strong>surface</strong> from both of the<br />
methods, column-averaged cloud properties, the st<strong>and</strong>ard deviations of these estimates, location<br />
<strong>and</strong> scene types. A complete list of data parameters is in the CERES Data Products Catalog (http:/<br />
/asd-www.larc.nasa.gov/DPC/DPC.html).<br />
In the next section, we will discuss the method adopted by the CERES Time Interpolation <strong>and</strong><br />
August 2000 1
CERES Validation Plan - Subsystem 10.0 Release 4.0<br />
Spatial Averaging (TISA) working group for validating the SRBAVG data product. Section 10.3<br />
<strong>and</strong> 10.4 outline both pre-launch <strong>and</strong> post-launch <strong>validation</strong> studies. Section 10.5 provides details<br />
on implementing <strong>validation</strong> results in data production. A summary is given in Section 10.6.<br />
10.2 VALIDATION CRITERION<br />
10.2.1 Overall approach<br />
The science algorithms for TOA parameters are based on the ERBE-like technique (Subsystem<br />
3) <strong>and</strong> the new CERES geostationary-enhancement method (Subsystem 7). A few minor<br />
differences do exist. For example, the input data for this subsystem are derived from the SFC data<br />
product instead of the FSW. In addition, the data are sorted in terms of local time, not GMT. The<br />
first step in the averaging algorithms is to sort the FSW data in space <strong>and</strong> local time. The sorting<br />
of the gridded geostationary data is then done in a similar manner. Column-averaged cloud data<br />
are time interpolated to all local times using a linear technique. The complete time series of column-averaged<br />
data is used to compute <strong>monthly</strong> <strong>and</strong> <strong>monthly</strong>-hourly means. Monthly means of the<br />
Angular Model Scene Class data are computed using only data from the times of CERES observations.<br />
The temporal interpolation of total-sky LW <strong>and</strong> SW fluxes is identical to the technique<br />
described in Subsystem 3 (ERBE-like technique) <strong>and</strong> Subsystem 7 (new CERES geostationaryenhancement<br />
method). However, estimates of daily <strong>regional</strong> SW flux from the new CERES<br />
method are made only for days with at least one CERES observation. Only these days will be used<br />
in the calculation of new CERES geostationary enhanced <strong>monthly</strong> mean fluxes. Time interpolation<br />
of clear-sky LW <strong>and</strong> SW flux are done using ERBE-like method only. No attempt is made to<br />
produce clear-sky flux estimates at every hour. Only days with at least one clear-sky flux measurement<br />
are modeled <strong>and</strong> used in the computation of <strong>monthly</strong> means. Surface SW <strong>and</strong> LW fluxes are<br />
calculated based on TOA-to-<strong>surface</strong> parameterization schemes given in Subsystem 4.6 (CERES<br />
<strong>surface</strong> radiation budget technique) for every hour in which a TOA flux is calculated. Monthly,<br />
<strong>monthly</strong>-hourly, <strong>and</strong> daily means are computed in the same manner as used for TOA flux. Once<br />
<strong>regional</strong> means are computed for all parameters <strong>and</strong> all CERES 1-degree equal-angle gridded<br />
regions, these means are combined into zonal <strong>and</strong> global means using weighting factors to correct<br />
for variations in grid box size with latitude. There are three input data sets to this subsystem. They<br />
include hourly gridded single satellite CERES TOA <strong>and</strong> <strong>surface</strong> fluxes data set (SFC), atmospheric<br />
structure data set (ASTR), <strong>and</strong> gridded geostationary narrowb<strong>and</strong> radiances data set<br />
(GGEO). The output of the data processing system produces the <strong>monthly</strong> TOA <strong>and</strong> SRB averages<br />
data set (SRBAVG).<br />
The overall approach to validating the SRBAVG data product follows very closely to the<br />
method outlined in the <strong>validation</strong> <strong>plan</strong> for the ERBE-like data product (Subsystem 3) <strong>and</strong> will not<br />
be repeated here. Readers are referred to Subsystem 3 for more details.<br />
In order to conserve resources, the CERES TISA working group will not validate every data<br />
parameter listed in the SRBAVG science products. The data parameters used here for <strong>validation</strong><br />
purposes are 1) LW <strong>and</strong> SW TOA all-sky flux, 2) LW <strong>and</strong> SW TOA clear-sky flux, 3) LW <strong>and</strong> SW<br />
August 2000 2
CERES Validation Plan - Subsystem 10.0 Release 4.0<br />
<strong>surface</strong> all-sky flux, 4) LW <strong>and</strong> SW <strong>surface</strong> clear-sky flux, <strong>and</strong> 5) column-averaged cloud properties.<br />
This data product offers the best opportunity for comparisons of <strong>monthly</strong> means calculated<br />
using the ERBE-like temporal interpolation technique <strong>and</strong> the geostationary-enhanced technique<br />
since both methods will be used with identical temporal sampling <strong>and</strong> spatial gridding resolution.<br />
Regional <strong>monthly</strong> means will be compared directly using the two <strong>monthly</strong> products created by<br />
this subsystem. Time series plots, zonal, <strong>and</strong> global averages of TOA fluxes <strong>and</strong> scene identification<br />
will also be compared with previously validated ERBE-like products using the tropical mean<br />
technique described in the <strong>validation</strong> <strong>plan</strong> for Subsystem 3.0. Scatter plots comparing 1.0 degree<br />
regions with corresponding 2.5 degree ERBE-like regions will also be used to study the effects of<br />
the diminished temporal sampling of the 1.0 degree product.<br />
Monthly mean <strong>surface</strong> fluxes will be compared with <strong>monthly</strong> mean fluxes determined from<br />
<strong>surface</strong> observations at <strong>NASA</strong>/LaRC Chesapeake Lighthouse, Boulder Tower, BSRN (Baseline<br />
Surface Radiation Networks), CAVE (CERES/ARM Validation Experiment), <strong>and</strong> other ARM<br />
(Atmospheric Radiation Measurement) sites. The Subsystem 10.0 algorithm assumes that <strong>surface</strong><br />
fluxes can be calculated for each hour of the month using temporally interpolated TOA fluxes. The<br />
<strong>surface</strong> sites will provide hourly observations of <strong>surface</strong> fluxes that will also allow determination<br />
of instantaneous interpolation errors of <strong>surface</strong> flux due to this assumption. For global assessments<br />
of errors in <strong>surface</strong> fluxes, comparisons will also be made with results of the GEWEX/SRB<br />
project.<br />
This product also includes column-averaged cloud properties. Several different weighting<br />
schemes are used to conserve radiative properties such as TOA or <strong>surface</strong> downwellig LW flux.<br />
These weighting schemes will be tested using the CAGEX data set (Charlock <strong>and</strong> Alberta, 1996).<br />
If successful, these column clouds should produce mean cloud conditions consistent with the<br />
quantity being conserved.<br />
The geostationary-enhanced interpolation products will also be compared with two new satellite<br />
data products, if available. The combination of the European Geostationary Earth Radiation<br />
Budget (GERB) radiative fluxes <strong>and</strong> cloud properties derived from the SEVIRI instrument on the<br />
METEOSAT Second Generation Satellite will provide an excellent, high temporal resolution data<br />
set. Cloud properties from SEVIRI would be of greatest value if derived with an algorithm that is<br />
consistent with CERES <strong>and</strong> can therefore be directly compared with the CERES interpolated values.<br />
Monthly mean fluxes will also be compared with the GERB averages. An additional <strong>validation</strong><br />
data set will be from the Triana mission. The Triana hemispherical albedos <strong>and</strong> LW fluxes<br />
will provide a comparison of the globally integrated CERES fluxes. Cloud properties from Triana<br />
can also be compared with the interpoalted cloud properties from the geostationary data.<br />
10.2.2 Sampling requirements<br />
In order to validate SRBAVG data product, we will require a minimum of six months of data<br />
from each of the CERES satellites. Validation priority will be for 1) the first month of data; 2) 4<br />
seasonal months (January, April, July, October); 3) the first full year of data. Additional data<br />
August 2000 3
CERES Validation Plan - Subsystem 10.0 Release 4.0<br />
months are also required to perform data consistency tests between different satellites (i.e.,<br />
TRMM against Terra, TRMM against Aqua, <strong>and</strong> Terra against Aqua).<br />
10.2.3 Measures of success<br />
Accuracy goals for the <strong>monthly</strong> mean <strong>surface</strong> <strong>and</strong> TOA radiative parameters are based closely<br />
to those described in Subsystem 3 (ERBE-like method), 4.6 (<strong>surface</strong> radiation budget), <strong>and</strong> 7<br />
(geostationary-enhancement technique) <strong>and</strong> will not be repeated here. Readers are referred to the<br />
<strong>validation</strong> <strong>plan</strong> of those subsystems for more details.<br />
10.3 PRE-LAUNCH ALGORITHM TEST/DEVELOPMENT<br />
ACTIVITIES<br />
Pre-launch data for validating the TOA fluxes are outlined in Subsystem 3 (ERBE-like<br />
method), 4.6 (<strong>surface</strong> radiation budget) <strong>and</strong> 7 (geostationary-enhancement technique) <strong>and</strong> will not<br />
be repeated.<br />
10.4 POST-LAUNCH ACTIVITIES<br />
The post-launch <strong>validation</strong> of this subsystem is similar to those given in Subsystem 3 (ERBElike<br />
method), 4.6 (<strong>surface</strong> radiation budget) <strong>and</strong> 7 (geostationary-enhancement technique) <strong>and</strong><br />
will not be repeated. Readers are referred to those subsystems for further details. A schedule of<br />
post-launch <strong>validation</strong> studies that will be performed for the SRBAVG products is given in Table 1<br />
below.<br />
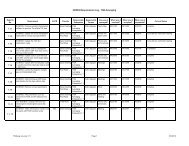
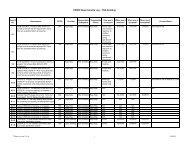
Table 1: CERES Monthly Mean Surface/TOA Validation Schedule<br />
Year 1998 1999 2000 2001 2002<br />
Quarter 1 2 3 4 1 2 3 4 1 2 3 4 1 2 3 4 1 2 3 4<br />
Validate GGEO code<br />
x<br />
Define GGEO <strong>monthly</strong> errors<br />
Validate Column Cloud code<br />
x<br />
x<br />
Validate Column Clouds<br />
x<br />
TRMM GGEO vs. ERBE-like<br />
(1.0 )<br />
TRMM GGEO vs. ERBE-like<br />
(2.5 )<br />
x<br />
x<br />
August 2000 4
CERES Validation Plan - Subsystem 10.0 Release 4.0<br />
Table 1: CERES Monthly Mean Surface/TOA Validation Schedule<br />
Year 1998 1999 2000 2001 2002<br />
Quarter 1 2 3 4 1 2 3 4 1 2 3 4 1 2 3 4 1 2 3 4<br />
TRMM Surface Monthly vs.<br />
Surface data<br />
x<br />
TRMM Instantaneous Surface<br />
vs. Surface data<br />
x<br />
GGEO calibration x x x x x x x x x x x x x x x<br />
Validate GGEO cloud code<br />
x<br />
GGEO vs. VIRS clouds<br />
Terra GGEO vs. ERBE-like<br />
(1.0 )<br />
Terra GGEO vs. ERBE-like<br />
(2.5 )<br />
x<br />
x<br />
x<br />
Terra Surface Monthly vs. Surface<br />
data<br />
x<br />
Terra Instantaneous Surface vs.<br />
Surface data<br />
x<br />
Aqua GGEO vs. ERBE-like<br />
(1.0 )<br />
Aqua GGEO vs. ERBE-like<br />
(2.5 )<br />
x<br />
x<br />
Aqua Surface Monthly vs. Surface<br />
data<br />
Aqua Instantaneous Surface vs.<br />
Surface data<br />
Multiple vs. single satellites<br />
x<br />
x<br />
x<br />
10.5 IMPLEMENTATION OF VALIDATION RESULTS IN DATA<br />
PRODUCTION<br />
The implementation of TISA <strong>validation</strong> results is given in Subsystem 7 <strong>and</strong> will not be<br />
August 2000 5
CERES Validation Plan - Subsystem 10.0 Release 4.0<br />
repeated. Readers are referred to that subsystem for further details<br />
10.6 SUMMARY<br />
This document describes a <strong>plan</strong> for validating the CERES SRBAVG data product. This <strong>plan</strong> is<br />
based on <strong>validation</strong> methods <strong>and</strong> procedures outlined in Subsystem 3, 4.6, <strong>and</strong> 7. Readers are<br />
referred to those subsystems for further details.<br />
REFERENCE<br />
Barkstrom, B. R., 1984: The Earth Radiation budget Experiment (ERBE). Bull. Amer. Meteor.<br />
Soc., 65, 1170-1185.<br />
Charlock, T. P., <strong>and</strong> T. L. Alberta, 1996: The CERES/ARM/GEWEX Experiment (CAGEX) for<br />
the retrieval of radiative fluxes with satellite data. Bull. Amer. Meteor. Soc., 77, 2673-2683.<br />
Wielicki, B. A., B. R. Barkstrom, E. F. Harrison, R. B. Lee, III, G. L. Smith, <strong>and</strong> J. E. Cooper,<br />
1996: Clouds <strong>and</strong> the Earth’s Radiant Energy System (CERES); An Earth Observing System<br />
Experiment. Bull. Amer. Meteor. Soc., 77, 853-868.<br />
Wielicki, B. A., B. R. Barkstrom, B. A. Baum, T. P. Charlock, R. N. Green, D. P. Kratz, R. B. Lee,<br />
P. Minnis, G. L. Smith, T. Wong, D. F. Young, R. D. Cess, J. A. Coakley, Jr., D. A. H. Crommelynck,<br />
L Donner, R. K<strong>and</strong>el, M. D. King, A. J. Miller, V. Ramanathan, D. A. R<strong>and</strong>all, L. L.<br />
Stowe, <strong>and</strong> R. M. Welch, 1998b: Clouds <strong>and</strong> the Earth’s Radiant Energy System (CERES):<br />
Algorithm Overview, IEEE Transactions on Geoscience <strong>and</strong> Remote Sensing, 36, 1127-1141.<br />
Young, D. F., P. Minnis, D. R. Doelling, G. G. Gibson, <strong>and</strong> P. Minnis, 1998: Temporal Interpolation<br />
Methods for the Clouds <strong>and</strong> the Earth’s Radiant Energy System (CERES) Experiment. J.<br />
Appl. Meteor., 37, 572-590.<br />
August 2000 6