(ceres) validation plan monthly regional toa and surface ... - NASA
(ceres) validation plan monthly regional toa and surface ... - NASA
(ceres) validation plan monthly regional toa and surface ... - NASA

You also want an ePaper? Increase the reach of your titles
YUMPU automatically turns print PDFs into web optimized ePapers that Google loves.
CLOUDS AND THE EARTH’S RADIANT ENERGY SYSTEM<br />
(CERES)<br />
VALIDATION PLAN<br />
MONTHLY REGIONAL TOA AND SURFACE RADIATION<br />
BUDGET (SUBSYSTEM 10.0)<br />
Takmeng Wong<br />
David F. Young<br />
Patrick Minnis<br />
Gary G. Gibson<br />
Atmospheric Science Division<br />
<strong>NASA</strong> Langley Research Center<br />
Hampton, Virginia 23681<br />
Release 4.0<br />
August 2000
CERES Validation Plan - Subsystem 10.0 Release 4.0<br />
CERES VALIDATION PLAN<br />
10.0 MONTHLY REGIONAL TOA AND SURFACE RADIATION<br />
BUDGET<br />
10.1 INTRODUCTION<br />
10.1.1 Measurement <strong>and</strong> science objectives<br />
The science objective of the CERES (Wielicki et al., 1996, 1998) <strong>monthly</strong> mean top-of-atmosphere<br />
(TOA) <strong>and</strong> <strong>surface</strong> radiation budget (SRB) averages data product is to accomplish the dual<br />
goals of providing a stable, long-term <strong>monthly</strong> mean data set of shortwave (SW) <strong>and</strong> longwave<br />
(LW) radiative parameters at the TOA <strong>and</strong> <strong>surface</strong> using a data processing system consistent with<br />
the Earth Radiation Budget Experiment (ERBE; Barkstrom 1984) <strong>and</strong>, at the same time, producing<br />
the most accurate <strong>monthly</strong> mean data set currently available based on state-of-the-art techniques.<br />
To accomplish these goals, CERES will produce <strong>regional</strong>, zonal, <strong>and</strong> global means by<br />
both the ERBE-like technique <strong>and</strong> the geostationary-enhancement method (Young et al., 1998).<br />
10.1.2 Missions<br />
The CERES instruments will be flown on multiple satellites, which include TRMM, Terra,<br />
<strong>and</strong> Aqua, to provide the diurnal sampling necessary to obtain accurate <strong>monthly</strong> averages of the<br />
TOA radiative parameters.<br />
10.1.3 Science data products<br />
The CERES TISA data algorithm for Subsystem 10 produces the <strong>monthly</strong> TOA <strong>and</strong> SRB<br />
average data product (SRBAVG) which contains <strong>monthly</strong> <strong>and</strong> <strong>monthly</strong>-hourly <strong>regional</strong>, zonal,<br />
<strong>and</strong> global averages of the TOA <strong>and</strong> <strong>surface</strong> LW <strong>and</strong> SW fluxes <strong>and</strong> the observed cloud conditions<br />
for each CERES 1-degree equal-angle region. This product differs from the AVG product in Subsystem<br />
8 in three ways. First, the <strong>surface</strong> fluxes are calculated from the TOA fluxes using TOA-to<strong>surface</strong><br />
parameterization, instead of using the radiative transfer models provided by the SARB<br />
subsystem. Second, no flux fields are calculated at levels between the TOA <strong>and</strong> <strong>surface</strong>. Lastly,<br />
the <strong>regional</strong> fluxes are calculated using both the ERBE-like method <strong>and</strong> the geostationary data<br />
enhancement technique. There is an SRBAVG product for each spacecraft <strong>and</strong> for each combination<br />
of spacecraft. There are 69 data parameters in each of the SRBAVG data products. These<br />
include mean estimates of SW <strong>and</strong> LW radiant flux at the TOA <strong>and</strong> at the <strong>surface</strong> from both of the<br />
methods, column-averaged cloud properties, the st<strong>and</strong>ard deviations of these estimates, location<br />
<strong>and</strong> scene types. A complete list of data parameters is in the CERES Data Products Catalog (http:/<br />
/asd-www.larc.nasa.gov/DPC/DPC.html).<br />
In the next section, we will discuss the method adopted by the CERES Time Interpolation <strong>and</strong><br />
August 2000 1
CERES Validation Plan - Subsystem 10.0 Release 4.0<br />
Spatial Averaging (TISA) working group for validating the SRBAVG data product. Section 10.3<br />
<strong>and</strong> 10.4 outline both pre-launch <strong>and</strong> post-launch <strong>validation</strong> studies. Section 10.5 provides details<br />
on implementing <strong>validation</strong> results in data production. A summary is given in Section 10.6.<br />
10.2 VALIDATION CRITERION<br />
10.2.1 Overall approach<br />
The science algorithms for TOA parameters are based on the ERBE-like technique (Subsystem<br />
3) <strong>and</strong> the new CERES geostationary-enhancement method (Subsystem 7). A few minor<br />
differences do exist. For example, the input data for this subsystem are derived from the SFC data<br />
product instead of the FSW. In addition, the data are sorted in terms of local time, not GMT. The<br />
first step in the averaging algorithms is to sort the FSW data in space <strong>and</strong> local time. The sorting<br />
of the gridded geostationary data is then done in a similar manner. Column-averaged cloud data<br />
are time interpolated to all local times using a linear technique. The complete time series of column-averaged<br />
data is used to compute <strong>monthly</strong> <strong>and</strong> <strong>monthly</strong>-hourly means. Monthly means of the<br />
Angular Model Scene Class data are computed using only data from the times of CERES observations.<br />
The temporal interpolation of total-sky LW <strong>and</strong> SW fluxes is identical to the technique<br />
described in Subsystem 3 (ERBE-like technique) <strong>and</strong> Subsystem 7 (new CERES geostationaryenhancement<br />
method). However, estimates of daily <strong>regional</strong> SW flux from the new CERES<br />
method are made only for days with at least one CERES observation. Only these days will be used<br />
in the calculation of new CERES geostationary enhanced <strong>monthly</strong> mean fluxes. Time interpolation<br />
of clear-sky LW <strong>and</strong> SW flux are done using ERBE-like method only. No attempt is made to<br />
produce clear-sky flux estimates at every hour. Only days with at least one clear-sky flux measurement<br />
are modeled <strong>and</strong> used in the computation of <strong>monthly</strong> means. Surface SW <strong>and</strong> LW fluxes are<br />
calculated based on TOA-to-<strong>surface</strong> parameterization schemes given in Subsystem 4.6 (CERES<br />
<strong>surface</strong> radiation budget technique) for every hour in which a TOA flux is calculated. Monthly,<br />
<strong>monthly</strong>-hourly, <strong>and</strong> daily means are computed in the same manner as used for TOA flux. Once<br />
<strong>regional</strong> means are computed for all parameters <strong>and</strong> all CERES 1-degree equal-angle gridded<br />
regions, these means are combined into zonal <strong>and</strong> global means using weighting factors to correct<br />
for variations in grid box size with latitude. There are three input data sets to this subsystem. They<br />
include hourly gridded single satellite CERES TOA <strong>and</strong> <strong>surface</strong> fluxes data set (SFC), atmospheric<br />
structure data set (ASTR), <strong>and</strong> gridded geostationary narrowb<strong>and</strong> radiances data set<br />
(GGEO). The output of the data processing system produces the <strong>monthly</strong> TOA <strong>and</strong> SRB averages<br />
data set (SRBAVG).<br />
The overall approach to validating the SRBAVG data product follows very closely to the<br />
method outlined in the <strong>validation</strong> <strong>plan</strong> for the ERBE-like data product (Subsystem 3) <strong>and</strong> will not<br />
be repeated here. Readers are referred to Subsystem 3 for more details.<br />
In order to conserve resources, the CERES TISA working group will not validate every data<br />
parameter listed in the SRBAVG science products. The data parameters used here for <strong>validation</strong><br />
purposes are 1) LW <strong>and</strong> SW TOA all-sky flux, 2) LW <strong>and</strong> SW TOA clear-sky flux, 3) LW <strong>and</strong> SW<br />
August 2000 2
CERES Validation Plan - Subsystem 10.0 Release 4.0<br />
<strong>surface</strong> all-sky flux, 4) LW <strong>and</strong> SW <strong>surface</strong> clear-sky flux, <strong>and</strong> 5) column-averaged cloud properties.<br />
This data product offers the best opportunity for comparisons of <strong>monthly</strong> means calculated<br />
using the ERBE-like temporal interpolation technique <strong>and</strong> the geostationary-enhanced technique<br />
since both methods will be used with identical temporal sampling <strong>and</strong> spatial gridding resolution.<br />
Regional <strong>monthly</strong> means will be compared directly using the two <strong>monthly</strong> products created by<br />
this subsystem. Time series plots, zonal, <strong>and</strong> global averages of TOA fluxes <strong>and</strong> scene identification<br />
will also be compared with previously validated ERBE-like products using the tropical mean<br />
technique described in the <strong>validation</strong> <strong>plan</strong> for Subsystem 3.0. Scatter plots comparing 1.0 degree<br />
regions with corresponding 2.5 degree ERBE-like regions will also be used to study the effects of<br />
the diminished temporal sampling of the 1.0 degree product.<br />
Monthly mean <strong>surface</strong> fluxes will be compared with <strong>monthly</strong> mean fluxes determined from<br />
<strong>surface</strong> observations at <strong>NASA</strong>/LaRC Chesapeake Lighthouse, Boulder Tower, BSRN (Baseline<br />
Surface Radiation Networks), CAVE (CERES/ARM Validation Experiment), <strong>and</strong> other ARM<br />
(Atmospheric Radiation Measurement) sites. The Subsystem 10.0 algorithm assumes that <strong>surface</strong><br />
fluxes can be calculated for each hour of the month using temporally interpolated TOA fluxes. The<br />
<strong>surface</strong> sites will provide hourly observations of <strong>surface</strong> fluxes that will also allow determination<br />
of instantaneous interpolation errors of <strong>surface</strong> flux due to this assumption. For global assessments<br />
of errors in <strong>surface</strong> fluxes, comparisons will also be made with results of the GEWEX/SRB<br />
project.<br />
This product also includes column-averaged cloud properties. Several different weighting<br />
schemes are used to conserve radiative properties such as TOA or <strong>surface</strong> downwellig LW flux.<br />
These weighting schemes will be tested using the CAGEX data set (Charlock <strong>and</strong> Alberta, 1996).<br />
If successful, these column clouds should produce mean cloud conditions consistent with the<br />
quantity being conserved.<br />
The geostationary-enhanced interpolation products will also be compared with two new satellite<br />
data products, if available. The combination of the European Geostationary Earth Radiation<br />
Budget (GERB) radiative fluxes <strong>and</strong> cloud properties derived from the SEVIRI instrument on the<br />
METEOSAT Second Generation Satellite will provide an excellent, high temporal resolution data<br />
set. Cloud properties from SEVIRI would be of greatest value if derived with an algorithm that is<br />
consistent with CERES <strong>and</strong> can therefore be directly compared with the CERES interpolated values.<br />
Monthly mean fluxes will also be compared with the GERB averages. An additional <strong>validation</strong><br />
data set will be from the Triana mission. The Triana hemispherical albedos <strong>and</strong> LW fluxes<br />
will provide a comparison of the globally integrated CERES fluxes. Cloud properties from Triana<br />
can also be compared with the interpoalted cloud properties from the geostationary data.<br />
10.2.2 Sampling requirements<br />
In order to validate SRBAVG data product, we will require a minimum of six months of data<br />
from each of the CERES satellites. Validation priority will be for 1) the first month of data; 2) 4<br />
seasonal months (January, April, July, October); 3) the first full year of data. Additional data<br />
August 2000 3
CERES Validation Plan - Subsystem 10.0 Release 4.0<br />
months are also required to perform data consistency tests between different satellites (i.e.,<br />
TRMM against Terra, TRMM against Aqua, <strong>and</strong> Terra against Aqua).<br />
10.2.3 Measures of success<br />
Accuracy goals for the <strong>monthly</strong> mean <strong>surface</strong> <strong>and</strong> TOA radiative parameters are based closely<br />
to those described in Subsystem 3 (ERBE-like method), 4.6 (<strong>surface</strong> radiation budget), <strong>and</strong> 7<br />
(geostationary-enhancement technique) <strong>and</strong> will not be repeated here. Readers are referred to the<br />
<strong>validation</strong> <strong>plan</strong> of those subsystems for more details.<br />
10.3 PRE-LAUNCH ALGORITHM TEST/DEVELOPMENT<br />
ACTIVITIES<br />
Pre-launch data for validating the TOA fluxes are outlined in Subsystem 3 (ERBE-like<br />
method), 4.6 (<strong>surface</strong> radiation budget) <strong>and</strong> 7 (geostationary-enhancement technique) <strong>and</strong> will not<br />
be repeated.<br />
10.4 POST-LAUNCH ACTIVITIES<br />
The post-launch <strong>validation</strong> of this subsystem is similar to those given in Subsystem 3 (ERBElike<br />
method), 4.6 (<strong>surface</strong> radiation budget) <strong>and</strong> 7 (geostationary-enhancement technique) <strong>and</strong><br />
will not be repeated. Readers are referred to those subsystems for further details. A schedule of<br />
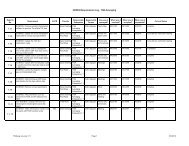
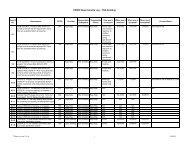
post-launch <strong>validation</strong> studies that will be performed for the SRBAVG products is given in Table 1<br />
below.<br />
Table 1: CERES Monthly Mean Surface/TOA Validation Schedule<br />
Year 1998 1999 2000 2001 2002<br />
Quarter 1 2 3 4 1 2 3 4 1 2 3 4 1 2 3 4 1 2 3 4<br />
Validate GGEO code<br />
x<br />
Define GGEO <strong>monthly</strong> errors<br />
Validate Column Cloud code<br />
x<br />
x<br />
Validate Column Clouds<br />
x<br />
TRMM GGEO vs. ERBE-like<br />
(1.0 )<br />
TRMM GGEO vs. ERBE-like<br />
(2.5 )<br />
x<br />
x<br />
August 2000 4
CERES Validation Plan - Subsystem 10.0 Release 4.0<br />
Table 1: CERES Monthly Mean Surface/TOA Validation Schedule<br />
Year 1998 1999 2000 2001 2002<br />
Quarter 1 2 3 4 1 2 3 4 1 2 3 4 1 2 3 4 1 2 3 4<br />
TRMM Surface Monthly vs.<br />
Surface data<br />
x<br />
TRMM Instantaneous Surface<br />
vs. Surface data<br />
x<br />
GGEO calibration x x x x x x x x x x x x x x x<br />
Validate GGEO cloud code<br />
x<br />
GGEO vs. VIRS clouds<br />
Terra GGEO vs. ERBE-like<br />
(1.0 )<br />
Terra GGEO vs. ERBE-like<br />
(2.5 )<br />
x<br />
x<br />
x<br />
Terra Surface Monthly vs. Surface<br />
data<br />
x<br />
Terra Instantaneous Surface vs.<br />
Surface data<br />
x<br />
Aqua GGEO vs. ERBE-like<br />
(1.0 )<br />
Aqua GGEO vs. ERBE-like<br />
(2.5 )<br />
x<br />
x<br />
Aqua Surface Monthly vs. Surface<br />
data<br />
Aqua Instantaneous Surface vs.<br />
Surface data<br />
Multiple vs. single satellites<br />
x<br />
x<br />
x<br />
10.5 IMPLEMENTATION OF VALIDATION RESULTS IN DATA<br />
PRODUCTION<br />
The implementation of TISA <strong>validation</strong> results is given in Subsystem 7 <strong>and</strong> will not be<br />
August 2000 5
CERES Validation Plan - Subsystem 10.0 Release 4.0<br />
repeated. Readers are referred to that subsystem for further details<br />
10.6 SUMMARY<br />
This document describes a <strong>plan</strong> for validating the CERES SRBAVG data product. This <strong>plan</strong> is<br />
based on <strong>validation</strong> methods <strong>and</strong> procedures outlined in Subsystem 3, 4.6, <strong>and</strong> 7. Readers are<br />
referred to those subsystems for further details.<br />
REFERENCE<br />
Barkstrom, B. R., 1984: The Earth Radiation budget Experiment (ERBE). Bull. Amer. Meteor.<br />
Soc., 65, 1170-1185.<br />
Charlock, T. P., <strong>and</strong> T. L. Alberta, 1996: The CERES/ARM/GEWEX Experiment (CAGEX) for<br />
the retrieval of radiative fluxes with satellite data. Bull. Amer. Meteor. Soc., 77, 2673-2683.<br />
Wielicki, B. A., B. R. Barkstrom, E. F. Harrison, R. B. Lee, III, G. L. Smith, <strong>and</strong> J. E. Cooper,<br />
1996: Clouds <strong>and</strong> the Earth’s Radiant Energy System (CERES); An Earth Observing System<br />
Experiment. Bull. Amer. Meteor. Soc., 77, 853-868.<br />
Wielicki, B. A., B. R. Barkstrom, B. A. Baum, T. P. Charlock, R. N. Green, D. P. Kratz, R. B. Lee,<br />
P. Minnis, G. L. Smith, T. Wong, D. F. Young, R. D. Cess, J. A. Coakley, Jr., D. A. H. Crommelynck,<br />
L Donner, R. K<strong>and</strong>el, M. D. King, A. J. Miller, V. Ramanathan, D. A. R<strong>and</strong>all, L. L.<br />
Stowe, <strong>and</strong> R. M. Welch, 1998b: Clouds <strong>and</strong> the Earth’s Radiant Energy System (CERES):<br />
Algorithm Overview, IEEE Transactions on Geoscience <strong>and</strong> Remote Sensing, 36, 1127-1141.<br />
Young, D. F., P. Minnis, D. R. Doelling, G. G. Gibson, <strong>and</strong> P. Minnis, 1998: Temporal Interpolation<br />
Methods for the Clouds <strong>and</strong> the Earth’s Radiant Energy System (CERES) Experiment. J.<br />
Appl. Meteor., 37, 572-590.<br />
August 2000 6