CTQ-Process-For-Dash.. - ASQ Section 702
CTQ-Process-For-Dash.. - ASQ Section 702
CTQ-Process-For-Dash.. - ASQ Section 702

You also want an ePaper? Increase the reach of your titles
YUMPU automatically turns print PDFs into web optimized ePapers that Google loves.
<strong>CTQ</strong> <strong>Process</strong> for<br />
<strong>Dash</strong>board Metrics<br />
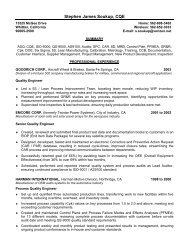
Kandy Senthilmaran<br />
Six Sigma Master Black Belt<br />
PMP,CSQA,CIISA,ITIL Fndts<br />
Director – <strong>Process</strong> Center of Excellence<br />
CSC – Application and Technology Services
<strong>CTQ</strong> <strong>Process</strong> for <strong>Dash</strong>board Metrics<br />
<strong>Dash</strong>board Metrics - > > ><br />
SIPOC VOC <strong>CTQ</strong>
<strong>CTQ</strong> <strong>Process</strong> for <strong>Dash</strong>board Metrics<br />
The steps for identifying the right dashboard metrics<br />
WHO are your CUSTOMER(S)<br />
WHAT do they need<br />
How do you quantify their need<br />
HOW much do they need
WHO are your CUSTOMER (S)<br />
Identify and<br />
prioritize customers<br />
Decide what<br />
information is<br />
important to describe<br />
their needs<br />
Decide when and<br />
how to get this<br />
information<br />
Use customer<br />
segmentation to<br />
understand the gap<br />
between where we<br />
are and where the<br />
customer needs the<br />
process and<br />
outcomes to be<br />
(differences)<br />
WHO are your CUSTOMER(S)<br />
WHAT do they need<br />
HOW do you quantify their need<br />
HOW much do they need
How Do Customer CTS’s Relate To The Y=f(x) Of<br />
Our <strong>Process</strong>es<br />
X 1<br />
X 2<br />
<strong>Process</strong><br />
Y<br />
X 3<br />
(VOP)<br />
Voice of the<br />
Customer (VOC)<br />
X n<br />
<strong>Process</strong> Input<br />
Variables<br />
(PIV)<br />
<strong>Process</strong> Output<br />
Variables<br />
(POV)<br />
Critical To Satisfaction<br />
(CTS)<br />
CTC <strong>CTQ</strong> CTD<br />
Manage the INPUTS and good OUTPUTS will<br />
follow that satisfy the customers<br />
5
SIPOC <strong>For</strong>m<br />
S I P O C<br />
Suppliers Inputs <strong>Process</strong> Outputs Customers<br />
(Providers of the<br />
required resources)<br />
(Resources<br />
required by the<br />
process)<br />
( Top level<br />
description of<br />
activity)<br />
(Deliverables from<br />
the process)<br />
(Anyone who<br />
receives a<br />
deliverable from the<br />
process)
Data Collection<br />
Systems<br />
•Reactive<br />
•Proactive<br />
WHO are your CUSTOMER(S)<br />
WHAT do they need<br />
HOW do you quantify their need<br />
HOW much do they need
Reactive and proactive<br />
systems Contd..<br />
Reactive systems gather information automatically<br />
Customer complaints (phone or written)<br />
Problem or service hot lines<br />
Technical support calls<br />
Customer service calls<br />
Claims, credits, contested payments<br />
Proactive systems must be designed to gather information<br />
Interviews<br />
Focus groups<br />
Surveys<br />
Comment cards<br />
Data gathering during sales visits or calls<br />
Direct customer observation<br />
Market research, market monitoring
Analyze Data<br />
Generate key<br />
customer needs<br />
Group and<br />
summarize data<br />
WHO are your CUSTOMER(S)<br />
WHAT do they need<br />
HOW do you quantify their need<br />
HOW much do they need
Affinity Diagrams<br />
An Affinity Diagram<br />
is a tool that organizes<br />
language data into related<br />
groups.<br />
Encourages “breakthrough” thinking<br />
Can identify patterns in mountains<br />
of data<br />
Allows compartmentalization of<br />
large volume of language data<br />
Organizes ideas, issues, opinions<br />
Encourages ownership of results by<br />
associating data<br />
Timeliness<br />
Need 1 Need 2<br />
Accuracy<br />
Need 3 Need 4<br />
Need 5<br />
Need 6<br />
Need 7<br />
Need 8
Must be characteristics are<br />
generally taken for granted—<br />
unless they are absent!<br />
Customers generally discuss<br />
or bring up issues related to<br />
More Is Better characteristics.<br />
Delighters are generally<br />
not mentioned, since<br />
customers are not dissatisfied<br />
with their absence.<br />
Delight<br />
Neutral<br />
Dissatisfaction<br />
Delighters<br />
Resigned<br />
to Reality<br />
Pleased<br />
Must Be<br />
Not<br />
Pleased<br />
Taken for<br />
Granted<br />
Absent<br />
Degree of<br />
Achievement<br />
Fulfilled<br />
Customer Satisfaction<br />
The Kano Model and VOC
Develop <strong>CTQ</strong><br />
Make generic VOC<br />
into specific <strong>CTQ</strong>s<br />
Drive to the level<br />
which touches the<br />
raw data.<br />
WHO are your CUSTOMER(S)<br />
WHAT do they need<br />
HOW do you quantify their need<br />
HOW much do they need
Translating the VOC to <strong>CTQ</strong><br />
Supplier<br />
Do<br />
Delivery<br />
(CTD) Cycle Time<br />
Price<br />
(CTC) Cost<br />
Quality<br />
(<strong>CTQ</strong>) Defects<br />
Need<br />
Customer
<strong>CTQ</strong> Characteristics<br />
A useful Critical to Quality requirement – <strong>CTQ</strong> - will have the following<br />
characteristics:<br />
It is truly critical to the customer’s perception of quality.<br />
It can be measured.<br />
A specification can be set to tell whether or not the <strong>CTQ</strong> has been<br />
achieved.
Steps to Constructing a <strong>CTQ</strong><br />
Gather (sorted or stratified) customer / business needs<br />
List major customer needs on the left side of the <strong>CTQ</strong> Tree<br />
View each need from the customer point of view by asking<br />
specifically “What would that mean” from the customer<br />
standpoint. Each answer becomes a driver for the <strong>CTQ</strong>s.<br />
Continue with each driver until you reach a level where it<br />
would be absurd to continue. (Your answers at this level are<br />
the <strong>CTQ</strong>s)<br />
Select <strong>CTQ</strong>s that will have the greatest positive impact on<br />
the customer
CTx Tree Contd..<br />
Relating CTS’s To <strong>Process</strong> Outputs and Inputs<br />
Customer<br />
Satisfaction<br />
Need<br />
Quality Delivery<br />
Price<br />
Do<br />
Defects Cycle time<br />
Cost<br />
<strong>CTQ</strong>1-Critical to Quality<br />
CTD-Critical to Delivery<br />
CTC-Critical to Cost<br />
<strong>CTQ</strong>2<br />
<strong>CTQ</strong>3<br />
<strong>Process</strong>es<br />
CTP1-Critical to <strong>Process</strong><br />
CTP2
CTx Tree contd..<br />
Business <strong>Process</strong> CTx Tree<br />
Payroll checks on time<br />
Quality<br />
<strong>CTQ</strong><br />
Delivery<br />
CTD<br />
Cost<br />
CTC<br />
<strong>CTQ</strong><br />
Correct amount<br />
<strong>CTQ</strong> <strong>CTQ</strong><br />
Accurate name<br />
CTC<br />
<strong>Process</strong>ed efficiently<br />
CTC CTC<br />
CTD<br />
Deposited in account<br />
CTD<br />
On time<br />
CTD
<strong>CTQ</strong> Tree :Example<br />
Need Drivers <strong>CTQ</strong>s<br />
Low qualification of operator<br />
Operation<br />
Easy to setup<br />
(training / documentation)<br />
Digital Control<br />
Ease of Operation<br />
and Maintenance<br />
Maintenance<br />
MTBF*<br />
Mistake Proofing<br />
Skills and Knowledge<br />
Modification<br />
Mistake Proofing<br />
Documentation<br />
Minimum special tools /<br />
equipment required<br />
General Specific<br />
Hard to measure Easy to measure<br />
* Mean Time Between Failures
<strong>CTQ</strong> Specifications<br />
Customer needs<br />
should be the basis<br />
for setting<br />
specifications<br />
Performance<br />
capability can also be<br />
used for setting<br />
targets<br />
WHO are your CUSTOMER(S)<br />
WHAT do they need<br />
How do you quantify their need<br />
HOW much do they need
Specification comes from Customer<br />
requirements<br />
Can be defined based on<br />
organizational goals<br />
Can be defined based on <strong>Process</strong><br />
performance capability<br />
Can be defined based on Industry<br />
benchmarks<br />
100<br />
75<br />
50<br />
25<br />
0<br />
Set specification<br />
here<br />
0 5 10 15 20 25 30<br />
Time (secs)<br />
100%<br />
66° 67° 68° 69° 69° 70° 71° 72° 73° 74° 75° 76°<br />
temperature (°F)<br />
% satisfied<br />
% satisfied<br />
<strong>CTQ</strong> Specifications contd..<br />
Set lower<br />
specification here<br />
Set upper<br />
specification here<br />
0%
IT Metrics Program
Software Metrics<br />
Measurement Theory<br />
Measurement is the process by which<br />
numbers or symbols are assigned to<br />
attributes of entities in the real world<br />
Metrics<br />
The continuous application of measurement-based techniques to the<br />
software process and its products to provide meaningful and timely<br />
management information, along with the use of techniques to improve<br />
that process and its products.<br />
It’s a derived Measure<br />
Metrics may help us Understand, Evaluate, Control and Predict<br />
performance of software products, process and services
The Right Metrics for the organization<br />
Avoid analysis paralysis: too many measures from all of the possible<br />
software entities and all possible attributes that can be measured.<br />
Random selection of metrics will not likely turn up anything of value (by<br />
Watts Humphrey)<br />
5W’s of measurement:<br />
What should I measure – Size, Effort, Time, Cost, Quality, Status;<br />
and what are the goals for measurement<br />
Why am I measuring<br />
Where (in the organization and the process) should measures be<br />
taken<br />
When should measures be taken<br />
Who needs to be involved
Business and IT Goals<br />
Common Business Goals<br />
Improve the overall Revenue<br />
Improve Operating Margins<br />
Ensure business continuity and disaster<br />
recovery<br />
Offer Competitive Products and Services<br />
– Building the Brand Value<br />
High Compliance with external Laws an<br />
Regulations<br />
Align &<br />
Support<br />
Improve ROI - Better value to share<br />
holders<br />
Improve Market Capitalization<br />
Improve Customer Base<br />
Improve Customer Satisfaction –<br />
Better value for the cost<br />
Common IT Goals<br />
Improve Service Quality -Deliver timely, effective and shared solutions to<br />
business requirements through teamwork.<br />
Improve Accessibility - Provide the business and end users with<br />
convenient access to appropriate information and services through<br />
technology.<br />
Innovation and Transformation - Provide vision, leadership, and a<br />
framework for evaluating emerging technologies and implementing proven<br />
information technology solutions.<br />
Better Communication and Visibility - Providing a reliable communication<br />
and computer infrastructure foundation for conducting an efficient business<br />
operations today and in the future.<br />
Effectively communicate information about plans, projects, and<br />
achievements to the business.<br />
Improve Work <strong>For</strong>ce Environment -Develop and retain technically skilled<br />
staff to assist the business.<br />
Improve Operational Efficiency - Ensure effective technical and fiscal<br />
management of the Department's operations, resources, technology<br />
projects.<br />
Security and Compliance - Maintain high level of data security and<br />
compliance to internal and external standards
First Level SIPOC<br />
Business Requirements<br />
Business Strategy plan.<br />
Market Drives<br />
Technology Changes<br />
Inputs<br />
<strong>Process</strong>es<br />
Software Development<br />
Application Maintenance<br />
Infrastructure Services<br />
Vendor Package Implementation<br />
Internal Customers<br />
Customer B is Customer<br />
A’s internal customer.<br />
Software<br />
Infrastructures<br />
Maintenance Services<br />
Outputs<br />
•Those who receive/use the<br />
product/service<br />
•Those affected by the use of<br />
the product/service<br />
•Those who have a stake in the<br />
product/service success or<br />
failure<br />
Vendors<br />
Business<br />
Internal<br />
Customers
<strong>CTQ</strong> Alignment<br />
Voice of the Customer ,<br />
Market demands<br />
Aligned<br />
Business Strategy , Vision<br />
Mission<br />
Goals and<br />
Objectives<br />
Critical components / characteristics to meet the objectives ( <strong>CTQ</strong>)<br />
How to measure the characteristics of <strong>CTQ</strong> ( Measurements)<br />
Establishing common tool for comparison ( Metrics)<br />
Source for Internal and External Benchmarking
<strong>CTQ</strong> Tree - Example
Measurement System<br />
Analysis (MSA)
MSA Overview<br />
A Measurement Systems Analysis (MSA) evaluates the entire process of<br />
obtaining measurements to ensure the integrity of data used for analysis<br />
and to understand the implications of measurement error for decisions<br />
made about a product or process.<br />
MSA Considerations<br />
Selecting the correct measurement and approach<br />
Assessing the measuring device<br />
Assessing procedures & operators<br />
Assessing any dependency and influence of other measurements
Data Analysis &<br />
Reporting
Analysis and Reporting Steps<br />
Identifying data points<br />
Perform data collection<br />
Perform data validation<br />
Apply statistical techniques for analysis<br />
Develop Reports<br />
Review with customers (Internal or External)<br />
Establish AS-IS benchmark<br />
Communicate the AS-IS benchmark to organization
Data Requirement<br />
Sufficient data is available to confirm that the results and<br />
trends you see are real<br />
Representative of the full range of process conditions or<br />
problems are seen in the data<br />
Contextual to give you a complete picture of what is<br />
happening throughout the entire process<br />
Relevant to be able to help you understand or pinpoint your<br />
problem
Data Analysis and Reporting problems<br />
Insufficient data to base reliable conclusions.<br />
Irrelevant data that does not help you understand or solve<br />
the targeted problem<br />
Biased data that represents only certain views or processes<br />
of the problem<br />
Isolated data is when you only collect one view of the<br />
process or problem
Data Analysis
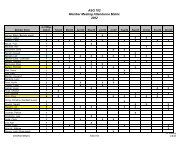
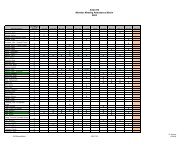
Metrics Reporting<br />
Sample Reporting
Data Analysis and Reporting Automation<br />
Tools and<br />
Techniques<br />
Manual data<br />
from Projects<br />
and operations
QUESTIONS <br />
Kandy Senthilmaran<br />
Director - <strong>Process</strong> Center of Excellence<br />
KSenthilmara@csc.com<br />
517-290-6663<br />
Thank you.