Language Use and English-Speaking Ability: 2000 - Census Bureau
Language Use and English-Speaking Ability: 2000 - Census Bureau
Language Use and English-Speaking Ability: 2000 - Census Bureau

Create successful ePaper yourself
Turn your PDF publications into a flip-book with our unique Google optimized e-Paper software.
In the Northeast, the Midwest, <strong>and</strong><br />
the South, speakers of Other Indo-<br />
European languages made up the<br />
second largest non-<strong>English</strong>language<br />
speaking group, while in<br />
the West, the second largest group<br />
was speakers of Asian <strong>and</strong> Pacific<br />
Isl<strong>and</strong> languages. Half of Asian<br />
<strong>and</strong> Pacific Isl<strong>and</strong>-language speakers<br />
lived in the West in <strong>2000</strong>.<br />
Table 3 shows the change in the<br />
number of speakers of Spanish,<br />
Other Indo-European languages,<br />
Asian <strong>and</strong> Pacific Isl<strong>and</strong> languages,<br />
<strong>and</strong> All other languages between<br />
1990 <strong>and</strong> <strong>2000</strong>. The largest percentage<br />
increase of Spanish speakers<br />
was in the Midwest. Asian <strong>and</strong><br />
Pacific Isl<strong>and</strong>-language speakers<br />
increased most rapidly in the South<br />
<strong>and</strong> the Midwest. Although the<br />
number of Spanish speakers grew<br />
in all regions, more than threefourths<br />
of that growth was in the<br />
West <strong>and</strong> the South. The number<br />
of Asian <strong>and</strong> Pacific Isl<strong>and</strong>-language<br />
speakers grew substantially<br />
in all regions, with the greatest<br />
numerical increase in the West,<br />
which was home to more than half<br />
of all Asian <strong>and</strong> Pacific Isl<strong>and</strong>-language<br />
speakers in both years.<br />
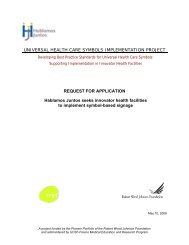
Figure 4.<br />
Non-<strong>English</strong> <strong>Language</strong>s Spoken at Home,<br />
by Region: <strong>2000</strong><br />
(Population 5 years <strong>and</strong> over, in millions. Data based on sample. For<br />
information on confidentiality protection, nonsampling error, sampling<br />
error, <strong>and</strong> definitions, see www.census.gov/prod/cen<strong>2000</strong>/doc/sf3.pdf)<br />
Northeast<br />
Midwest<br />
South<br />
West<br />
0.4<br />
0.4<br />
0.4<br />
0.8<br />
0.6<br />
1.3<br />
1.3<br />
1.9<br />
2.0<br />
2.6<br />
2.4<br />
3.8<br />
3.6<br />
4.5<br />
Source: U.S. <strong>Census</strong> <strong>Bureau</strong>, <strong>Census</strong> <strong>2000</strong> Summary File 3.<br />
Spanish<br />
Other Indo-European languages<br />
Asian <strong>and</strong> Pacific Isl<strong>and</strong> languages<br />
All other languages<br />
9.9<br />
11.1<br />
More than one-quarter of<br />
the population in seven states<br />
spoke a language other than<br />
<strong>English</strong> at home in <strong>2000</strong>.<br />
California had the largest percentage<br />
of non-<strong>English</strong>-language speakers<br />
(39 percent), followed by New<br />
Mexico (37 percent), Texas (31 percent),<br />
New York (28 percent),<br />
Hawaii (27 percent), Arizona, <strong>and</strong><br />
New Jersey (each about 26 percent,<br />
see Table 2). The five states with<br />
fewer than 5 percent of the population<br />
who spoke a language other<br />
than <strong>English</strong> at home were all in<br />
the South — Tennessee (4.8 percent),<br />
Alabama <strong>and</strong> Kentucky<br />
(each 3.9 percent), Mississippi<br />
(3.6 percent), <strong>and</strong> West Virginia<br />
(2.7 percent).<br />
Eight states had over 1 million<br />
non-<strong>English</strong>-language speakers in<br />
<strong>2000</strong>, led by California (12.4 million)<br />
with more than twice the<br />
number of any other state. Texas<br />
had the second largest number of<br />
non-<strong>English</strong>-language speakers<br />
(6.0 million), followed by New York<br />
(5.0 million), Florida (3.5 million),<br />
Illinois (2.2 million), New Jersey<br />
(2.0 million), Arizona (1.2 million),<br />
<strong>and</strong> Massachusetts (1.1 million).<br />
During the 1990s, California surpassed<br />
New Mexico as the state<br />
with the largest proportion of<br />
non-<strong>English</strong>-language speakers.<br />
While the proportion of non-<br />
<strong>English</strong>-language speakers in New<br />
Mexico increased slightly from<br />
36 percent to 37 percent, the proportion<br />
in California jumped from<br />
31 percent to 39 percent.<br />
The number of non-<strong>English</strong>language<br />
speakers at least doubled<br />
in six states from 1990 to <strong>2000</strong>.<br />
The largest percentage increase<br />
occurred in Nevada, where the<br />
number increased by 193 percent.<br />
Nevada also had the highest rate<br />
of population increase during the<br />
decade. Georgia’s non-<strong>English</strong>language-speaking<br />
residents<br />
6 U.S. <strong>Census</strong> <strong>Bureau</strong>