Language Use and English-Speaking Ability: 2000 - Census Bureau
Language Use and English-Speaking Ability: 2000 - Census Bureau
Language Use and English-Speaking Ability: 2000 - Census Bureau

Create successful ePaper yourself
Turn your PDF publications into a flip-book with our unique Google optimized e-Paper software.
<strong>Language</strong> <strong>Use</strong> <strong>and</strong><br />
<strong>English</strong>-<strong>Speaking</strong> <strong>Ability</strong>: <strong>2000</strong><br />
<strong>Census</strong> <strong>2000</strong> Brief<br />
Issued October 2003<br />
C2KBR-29<br />
The ability to communicate<br />
with government<br />
<strong>and</strong> private service<br />
providers, schools,<br />
businesses, emergency<br />
personnel, <strong>and</strong> many<br />
other people in the<br />
United States depends<br />
greatly on the ability to<br />
speak <strong>English</strong>. 1 In<br />
<strong>Census</strong> <strong>2000</strong>, as in the<br />
two previous censuses,<br />
the U.S. <strong>Census</strong> <strong>Bureau</strong><br />
asked people aged 5<br />
<strong>and</strong> over if they spoke<br />
a language other than<br />
<strong>English</strong> at home.<br />
Among the 262.4 million<br />
people aged 5 <strong>and</strong><br />
over, 47.0 million<br />
(18 percent) spoke a<br />
language other than<br />
<strong>English</strong> at home.<br />
11<br />
This report, part of a series that presents<br />
population <strong>and</strong> housing data collected in<br />
<strong>Census</strong> <strong>2000</strong>, presents data on language<br />
spoken at home <strong>and</strong> the ability to speak<br />
<strong>English</strong> of people aged 5 <strong>and</strong> over. It<br />
describes population distributions <strong>and</strong><br />
characteristics for the United States,<br />
including regions, states, counties, <strong>and</strong><br />
selected places with populations of<br />
100,000 or more.<br />
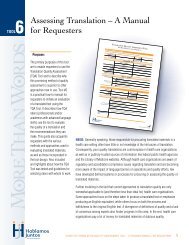
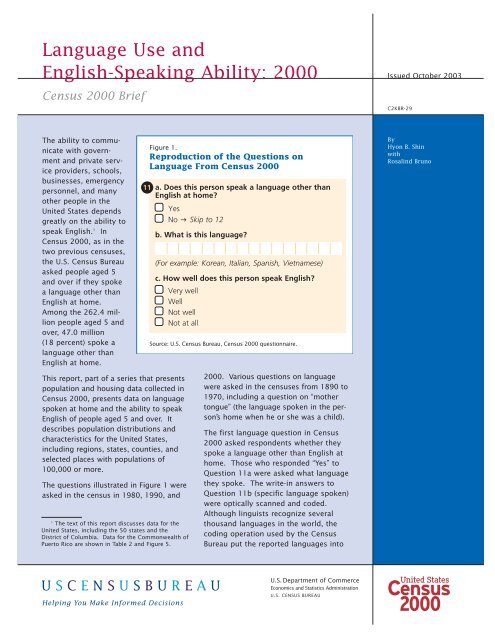
The questions illustrated in Figure 1 were<br />
asked in the census in 1980, 1990, <strong>and</strong><br />
1<br />
The text of this report discusses data for the<br />
United States, including the 50 states <strong>and</strong> the<br />
District of Columbia. Data for the Commonwealth of<br />
Puerto Rico are shown in Table 2 <strong>and</strong> Figure 5.<br />
Figure 1.<br />
Reproduction of the Questions on<br />
<strong>Language</strong> From <strong>Census</strong> <strong>2000</strong><br />
a. Does this person speak a language other than<br />
<strong>English</strong> at home<br />
Yes<br />
No Skip to 12<br />
b. What is this language<br />
(For example: Korean, Italian, Spanish, Vietnamese)<br />
c. How well does this person speak <strong>English</strong><br />
Very well<br />
Well<br />
Not well<br />
Not at all<br />
Source: U.S. <strong>Census</strong> <strong>Bureau</strong>, <strong>Census</strong> <strong>2000</strong> questionnaire.<br />
<strong>2000</strong>. Various questions on language<br />
were asked in the censuses from 1890 to<br />
1970, including a question on “mother<br />
tongue” (the language spoken in the person’s<br />
home when he or she was a child).<br />
The first language question in <strong>Census</strong><br />
<strong>2000</strong> asked respondents whether they<br />
spoke a language other than <strong>English</strong> at<br />
home. Those who responded “Yes” to<br />
Question 11a were asked what language<br />
they spoke. The write-in answers to<br />
Question 11b (specific language spoken)<br />
were optically scanned <strong>and</strong> coded.<br />
Although linguists recognize several<br />
thous<strong>and</strong> languages in the world, the<br />
coding operation used by the <strong>Census</strong><br />
<strong>Bureau</strong> put the reported languages into<br />
By<br />
Hyon B. Shin<br />
with<br />
Rosalind Bruno<br />
U S C E N S U S B U R E A U<br />
Helping You Make Informed Decisions<br />
U.S. Department of Commerce<br />
Economics <strong>and</strong> Statistics Administration<br />
U.S. CENSUS BUREAU
about 380 categories of single languages<br />
or language families. 2<br />
For people who answered “Yes” to<br />
Question 11a, Question 11c asked<br />
respondents to indicate how well<br />
they spoke <strong>English</strong>. Respondents<br />
who said they spoke <strong>English</strong> “Very<br />
well” were considered to have no<br />
difficulty with <strong>English</strong>. Those who<br />
indicated they spoke <strong>English</strong> “Well,”<br />
“Not well,” or “Not at all” were considered<br />
to have difficulty with<br />
<strong>English</strong> — identified also as people<br />
who spoke <strong>English</strong> less than<br />
“Very well.”<br />
The number <strong>and</strong> percentage<br />
of people in the United States<br />
who spoke a language other<br />
than <strong>English</strong> at home increased<br />
between 1990 <strong>and</strong> <strong>2000</strong>.<br />
In <strong>2000</strong>, 18 percent of the total<br />
population aged 5 <strong>and</strong> over, or<br />
47.0 million people, reported they<br />
spoke a language other than<br />
<strong>English</strong> at home. 3 These figures<br />
were up from 14 percent (31.8 million)<br />
in 1990 <strong>and</strong> 11 percent<br />
(23.1 million) in 1980. The number<br />
of people who spoke a language<br />
other than <strong>English</strong> at home grew by<br />
38 percent in the 1980s <strong>and</strong> by<br />
47 percent in the 1990s. While the<br />
population aged 5 <strong>and</strong> over grew<br />
by one-fourth from 1980 to <strong>2000</strong>,<br />
the number who spoke a language<br />
other than <strong>English</strong> at home more<br />
than doubled.<br />
In <strong>2000</strong>, most people who spoke a<br />
language other than <strong>English</strong> at<br />
home reported they spoke <strong>English</strong><br />
“Very well” (55 percent or<br />
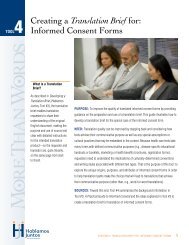
Figure 2.<br />
Speakers of <strong>Language</strong>s Other Than <strong>English</strong> at Home<br />
<strong>and</strong> <strong>English</strong> <strong>Ability</strong> by <strong>Language</strong> Group: <strong>2000</strong><br />
(Population 5 years <strong>and</strong> over, in millions. Data based on sample. For<br />
information on confidentiality protection, nonsampling error, sampling<br />
error, <strong>and</strong> definitions, see www.census.gov/prod/cen<strong>2000</strong>/doc/sf3.pdf)<br />
Other Indo-European<br />
languages<br />
Asian <strong>and</strong> Pacific<br />
Isl<strong>and</strong> languages<br />
Spanish 14.3<br />
All other<br />
languages<br />
3.4<br />
6.6<br />
3.6<br />
1.3 0.6 1.9<br />
3.4<br />
7.0<br />
Source: U.S. <strong>Census</strong> <strong>Bureau</strong>, <strong>Census</strong> <strong>2000</strong> Summary File 3.<br />
Spoke <strong>English</strong> "Very well"<br />
Spoke <strong>English</strong> less than "Very well"<br />
10.0<br />
13.8<br />
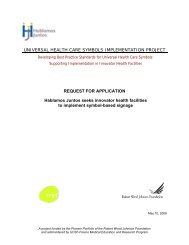
Figure 3.<br />
Ten <strong>Language</strong>s Most Frequently Spoken at Home<br />
Other Than <strong>English</strong> <strong>and</strong> Spanish: <strong>2000</strong><br />
(Population 5 years <strong>and</strong> over, in millions. Data based on sample. For<br />
information on confidentiality protection, nonsampling error, sampling<br />
error, <strong>and</strong> definitions, see www.census.gov/prod/cen<strong>2000</strong>/doc/sf3.pdf)<br />
Chinese<br />
French<br />
German<br />
Tagalog<br />
Vietnamese 1<br />
Italian 1<br />
Korean<br />
Russian<br />
0.7<br />
0.9<br />
1.0<br />
1.0<br />
1.2<br />
1.4<br />
1.6<br />
2.0<br />
28.1<br />
2<br />
More detailed information on languages<br />
<strong>and</strong> language coding can be found in<br />
“Summary File 3: <strong>2000</strong> <strong>Census</strong> of Population<br />
<strong>and</strong> Housing Technical Documentation” issued<br />
December 2002 (www.census.gov/prod<br />
/cen<strong>2000</strong>/doc/sf3.pdf).<br />
3<br />
The estimates in this report are based on<br />
responses from a sample of the population.<br />
As with all surveys, estimates may vary from<br />
the actual values because of sampling variation<br />
or other factors. All statements made in<br />
this report have undergone statistical testing<br />
<strong>and</strong> are significant at the 90-percent confidence<br />
level unless otherwise noted.<br />
Polish<br />
Arabic<br />
0.6<br />
0.7<br />
1 The number of Vietnamese speakers <strong>and</strong> the number of Italian speakers were not<br />
statistically different from one another.<br />
Note: The estimates in this figure vary from actual values due to sampling errors. As<br />
a result, the number of speakers of some languages shown in this figure may not be<br />
statistically different from the number of speakers of languages not shown in this figure.<br />
Source: U.S. <strong>Census</strong> <strong>Bureau</strong>, <strong>Census</strong> <strong>2000</strong> Summary File 3.<br />
2 U.S. <strong>Census</strong> <strong>Bureau</strong>
Four Major <strong>Language</strong> Groups<br />
Spanish includes those who speak Ladino.<br />
Other Indo-European languages include most languages of<br />
Europe <strong>and</strong> the Indic languages of India. These include the Germanic<br />
languages, such as German, Yiddish, <strong>and</strong> Dutch; the Sc<strong>and</strong>inavian<br />
languages, such as Swedish <strong>and</strong> Norwegian; the Romance languages,<br />
such as French, Italian, <strong>and</strong> Portuguese; the Slavic languages, such as<br />
Russian, Polish, <strong>and</strong> Serbo-Croatian; the Indic languages, such as<br />
Hindi, Gujarathi, Punjabi, <strong>and</strong> Urdu; Celtic languages; Greek; Baltic<br />
languages; <strong>and</strong> Iranian languages.<br />
Asian <strong>and</strong> Pacific Isl<strong>and</strong> languages include Chinese; Korean;<br />
Japanese; Vietnamese; Hmong; Khmer; Lao; Thai; Tagalog or Pilipino;<br />
the Dravidian languages of India, such as Telegu, Tamil, <strong>and</strong><br />
Malayalam; <strong>and</strong> other languages of Asia <strong>and</strong> the Pacific, including<br />
the Philippine, Polynesian, <strong>and</strong> Micronesian languages.<br />
All other languages include Uralic languages, such as Hungarian;<br />
the Semitic languages, such as Arabic <strong>and</strong> Hebrew; languages of<br />
Africa; native North American languages, including the American<br />
Indian <strong>and</strong> Alaska native languages; <strong>and</strong> some indigenous languages<br />
of Central <strong>and</strong> South America.<br />
25.6 million people). When they<br />
are combined with those who<br />
spoke only <strong>English</strong> at home,<br />
92 percent of the population aged<br />
5 <strong>and</strong> over had no difficulty speaking<br />
<strong>English</strong>. The proportion of the<br />
population aged 5 <strong>and</strong> over who<br />
spoke <strong>English</strong> less than “Very well”<br />
grew from 4.8 percent in 1980, to<br />
6.1 percent in 1990, <strong>and</strong> to 8.1<br />
percent in <strong>2000</strong>.<br />
In Figure 2, the number of speakers<br />
of the four major language<br />
groups (Spanish, Other Indo-<br />
European languages, Asian <strong>and</strong><br />
Pacific Isl<strong>and</strong> languages, <strong>and</strong> All<br />
other languages) are shown by<br />
how well they spoke <strong>English</strong> (see<br />
text box above). Spanish was the<br />
largest of the four major language<br />
groups, <strong>and</strong> just over half of the<br />
28.1 million Spanish speakers<br />
spoke <strong>English</strong> “Very well.”<br />
Other Indo-European language<br />
speakers composed the second<br />
largest group, with 10.0 million<br />
speakers, almost two-thirds of<br />
whom spoke <strong>English</strong> “Very well.”<br />
Slightly less than half of the<br />
7.0 million Asian <strong>and</strong> Pacific Isl<strong>and</strong>language<br />
speakers spoke <strong>English</strong><br />
“Very well” (3.4 million). Of the<br />
1.9 million people who composed<br />
the All other language category,<br />
1.3 million spoke <strong>English</strong><br />
“Very well.”<br />
After <strong>English</strong> <strong>and</strong> Spanish, Chinese<br />
was the language most commonly<br />
spoken at home (2.0 million speakers),<br />
followed by French (1.6 million<br />
speakers) <strong>and</strong> German<br />
(1.4 million speakers, see Figure 3).<br />
Reflecting historical patterns of<br />
immigration, the numbers of<br />
Italian, Polish, <strong>and</strong> German speakers<br />
fell between 1990 <strong>and</strong> <strong>2000</strong>,<br />
while the number of speakers of<br />
many other languages increased.<br />
Spanish speakers grew by about<br />
60 percent <strong>and</strong> Spanish continued to<br />
be the non-<strong>English</strong> language most<br />
frequently spoken at home in the<br />
United States. The Chinese language,<br />
however, jumped from the<br />
fifth to the second most widely spoken<br />
non-<strong>English</strong> language, as the<br />
number of Chinese speakers rose<br />
from 1.2 to 2.0 million people (see<br />
Table 1). 4 The number of Vietnamese<br />
speakers doubled over the<br />
decade, from about 507,000 speakers<br />
to just over 1 million speakers.<br />
Of the 20 non-<strong>English</strong> languages<br />
most frequently spoken at home<br />
shown in Table 1, the largest proportional<br />
increase was for Russian<br />
speakers, who nearly tripled from<br />
242,000 to 706,000. The second<br />
largest increase was for French<br />
Creole speakers (the language<br />
group that includes Haitian<br />
Creoles), whose numbers more than<br />
doubled from 188,000 to 453,000.<br />
THE GEOGRAPHIC<br />
DISTRIBUTION OF PEOPLE<br />
WHO SPOKE A LANGUAGE<br />
OTHER THAN ENGLISH<br />
AT HOME<br />
This section discusses the geographic<br />
distribution of the population<br />
aged 5 <strong>and</strong> over who stated in<br />
<strong>Census</strong> <strong>2000</strong> that they spoke a language<br />
other than <strong>English</strong> at home.<br />
The West had the greatest<br />
number <strong>and</strong> proportion of non-<br />
<strong>English</strong>-language speakers. 5<br />
People who spoke languages other<br />
than <strong>English</strong> at home were not distributed<br />
equally across or within<br />
regions in <strong>2000</strong>. 6 While the West<br />
4<br />
The changes in ranks between 1990<br />
<strong>and</strong> <strong>2000</strong> have not been tested <strong>and</strong> may not<br />
be statistically significant.<br />
5<br />
Hereafter, this report uses the term<br />
“non-<strong>English</strong>-language speakers” to refer to<br />
people who spoke a language other than<br />
<strong>English</strong> at home, regardless of their ability to<br />
speak <strong>English</strong> (see Table 1).<br />
6<br />
The Northeast region includes the states<br />
of Connecticut, Maine, Massachusetts, New<br />
Hampshire, New Jersey, New York,<br />
Pennsylvania, Rhode Isl<strong>and</strong>, <strong>and</strong> Vermont. The<br />
Midwest region includes the states of Illinois,<br />
Indiana, Iowa, Kansas, Michigan, Minnesota,<br />
Missouri, Nebraska, North Dakota, Ohio,<br />
South Dakota, <strong>and</strong> Wisconsin. The South<br />
region includes the states of Alabama,<br />
Arkansas, Delaware, Florida, Georgia,<br />
Kentucky, Louisiana, Maryl<strong>and</strong>, Mississippi,<br />
North Carolina, Oklahoma, South Carolina,<br />
Tennessee, Texas, Virginia, West Virginia, <strong>and</strong><br />
the District of Columbia, a state equivalent.<br />
The West region includes the states of Alaska,<br />
Arizona, California, Colorado, Hawaii, Idaho,<br />
Montana, Nevada, New Mexico, Oregon, Utah,<br />
Washington, <strong>and</strong> Wyoming.<br />
U.S. <strong>Census</strong> <strong>Bureau</strong> 3
Table 1.<br />
Twenty <strong>Language</strong>s Most Frequently Spoken at Home by <strong>English</strong> <strong>Ability</strong> for the<br />
Population 5 Years <strong>and</strong> Over: 1990 <strong>and</strong> <strong>2000</strong><br />
(Data based on sample. For information on confidentiality protection, sampling error, nonsampling error, <strong>and</strong> definitions, see<br />
www.census.gov/prod/cen<strong>2000</strong>/doc/sf3.pdf)<br />
1990 <strong>2000</strong><br />
<strong>Language</strong> spoken<br />
at home<br />
Rank<br />
Number of<br />
speakers<br />
Rank<br />
Total<br />
Number of speakers<br />
<strong>English</strong>-speaking ability<br />
Very well Well Not well Not at all<br />
United States ...... (X) 230,445,777 (X) 262,375,152 (X) (X) (X) (X)<br />
<strong>English</strong> only ........... (X) 198,600,798 (X) 215,423,557 (X) (X) (X) (X)<br />
Total non-<strong>English</strong> ...... (X) 31,844,979 (X) 46,951,595 25,631,188 10,333,556 7,620,719 3,366,132<br />
Spanish ................ 1 17,339,172 1 28,101,052 14,349,796 5,819,408 5,130,400 2,801,448<br />
Chinese ................ 5 1,249,213 2 2,022,143 855,689 595,331 408,597 162,526<br />
French ................. 2 1,702,176 3 1,643,838 1,228,800 269,458 138,002 7,578<br />
German . . .............. 3 1,547,099 4 1,382,613 1,078,997 219,362 79,535 4,719<br />
Tagalog ................ 6 843,251 5 1,224,241 827,559 311,465 79,721 5,496<br />
Vietnamese 1 ............ 9 507,069 6 1,009,627 342,594 340,062 270,950 56,021<br />
Italian 1 ................. 4 1,308,648 7 1,008,370 701,220 195,901 99,270 11,979<br />
Korean................. 8 626,478 8 894,063 361,166 268,477 228,392 36,028<br />
Russian ................ 15 241,798 9 706,242 304,891 209,057 148,671 43,623<br />
Polish .................. 7 723,483 10 667,414 387,694 167,233 95,032 17,455<br />
Arabic.................. 13 355,150 11 614,582 403,397 140,057 58,595 12,533<br />
Portuguese 2 ............ 10 429,860 12 564,630 320,443 125,464 90,412 28,311<br />
Japanese 2 .............. 11 427,657 13 477,997 241,707 146,613 84,018 5,659<br />
French Creole .......... 19 187,658 14 453,368 245,857 121,913 70,961 14,637<br />
Greek. . . ............... 12 388,260 15 365,436 262,851 65,023 33,346 4,216<br />
Hindi 3 .................. 14 331,484 16 317,057 245,192 51,929 16,682 3,254<br />
Persian ................ 18 201,865 17 312,085 198,041 70,909 32,959 10,176<br />
Urdu 3 .................. (NA) (NA) 18 262,900 180,018 56,736 20,817 5,329<br />
Gujarathi ............... 26 102,418 19 235,988 155,011 50,637 22,522 7,818<br />
Armenian............... 20 149,694 20 202,708 108,554 48,469 31,868 13,817<br />
All other languages . . .... (X) 3,182,546 (X) 4,485,241 2,831,711 1,060,052 479,969 113,509<br />
NA Not available.<br />
X Not applicable.<br />
1 In <strong>2000</strong>, the number of Vietnamese speakers <strong>and</strong> the number of Italian speakers were not statistically different from one another.<br />
2 In 1990, the number of Portuguese speakers <strong>and</strong> the number of Japanese speakers were not statistically different from one another.<br />
3 In 1990, Hindi included those who spoke Urdu.<br />
Note: The estimates in this table vary from actual values due to sampling errors. As a result, the number of speakers of some languages shown in this table<br />
may not be statistically different from the number of speakers of languages not shown in this table.<br />
Source: U.S. <strong>Census</strong> <strong>Bureau</strong>, <strong>Census</strong> <strong>2000</strong> Summary File 3.<br />
had only slightly more than<br />
one-fifth of the U.S. population<br />
aged 5 <strong>and</strong> over, it was home to<br />
more than one-third (37 percent) of<br />
all non-<strong>English</strong>-language speakers,<br />
the highest proportion of any<br />
region (see Table 2). Within<br />
regions, the proportion who spoke<br />
a non-<strong>English</strong> language at home<br />
was 29 percent in the West,<br />
20 percent in the Northeast,<br />
15 percent in the South, <strong>and</strong> only<br />
9 percent in the Midwest.<br />
Reflecting the higher proportion of<br />
speakers of non-<strong>English</strong> languages<br />
in the West, people in that region<br />
were more likely than those in the<br />
other regions to have difficulty<br />
with <strong>English</strong>. In <strong>2000</strong>, 14 percent<br />
of all people aged 5 <strong>and</strong> over in<br />
the West spoke <strong>English</strong> less than<br />
“Very well” — compared with<br />
9 percent in the Northeast, 7 percent<br />
in the South, <strong>and</strong> 4 percent in<br />
the Midwest.<br />
Figure 4 illustrates the prevalence<br />
of the four major non-<strong>English</strong>language<br />
groups spoken in each<br />
region. Spanish was spoken more<br />
than any other language group in<br />
all regions. The West <strong>and</strong> the South<br />
combined had about three times<br />
the number of Spanish speakers<br />
(21.0 million) as the Northeast <strong>and</strong><br />
the Midwest combined (7.1 million).<br />
In the Northeast <strong>and</strong> the Midwest,<br />
Spanish speakers composed slightly<br />
less than half of all non-<strong>English</strong>-language<br />
speakers, while in the South<br />
<strong>and</strong> the West, they represented<br />
around two-thirds (71 percent <strong>and</strong><br />
64 percent, respectively), in large<br />
part because of the geographic<br />
proximity to Mexico <strong>and</strong> other<br />
Spanish-speaking countries.<br />
4 U.S. <strong>Census</strong> <strong>Bureau</strong>
Table 2.<br />
<strong>Language</strong> <strong>Use</strong> <strong>and</strong> <strong>English</strong>-<strong>Speaking</strong> <strong>Ability</strong> for the Population 5 Years <strong>and</strong> Over for the<br />
United States, Regions, <strong>and</strong> States <strong>and</strong> for Puerto Rico: 1990 <strong>and</strong> <strong>2000</strong><br />
(Data based on sample. For information on confidentiality protection, sampling error, nonsampling error, <strong>and</strong> definitions, see<br />
www.census.gov/prod/cen<strong>2000</strong>/doc/sf3.pdf)<br />
1990 <strong>2000</strong><br />
Area<br />
Population<br />
5 years<br />
<strong>and</strong> over<br />
Spoke a<br />
language<br />
other than<br />
<strong>English</strong><br />
at home<br />
Percent<br />
Population<br />
5 years<br />
<strong>and</strong> over<br />
Spoke a<br />
language<br />
other than<br />
<strong>English</strong><br />
at home<br />
Percent<br />
Spoke<br />
<strong>English</strong><br />
less than<br />
‘‘Very well’’<br />
Percent<br />
1990<br />
<strong>and</strong><br />
<strong>2000</strong><br />
percent<br />
change in<br />
‘‘Spoke a<br />
language<br />
other than<br />
<strong>English</strong> at<br />
home’’<br />
United States .... 230,445,777 31,844,979 13.8 262,375,152 46,951,595 17.9 21,320,407 8.1 47.4<br />
Region<br />
Northeast ............ 47,319,352 7,824,285 16.5 50,224,209 10,057,331 20.0 4,390,538 8.7 28.5<br />
Midwest ............. 55,272,756 3,920,660 7.1 60,054,144 5,623,538 9.4 2,398,120 4.0 43.4<br />
South ............... 79,248,852 8,669,631 10.9 93,431,879 14,007,396 15.0 6,149,756 6.6 61.6<br />
West................ 48,604,817 11,430,403 23.5 58,664,920 17,263,330 29.4 8,381,993 14.3 51.0<br />
State<br />
Alabama............. 3,759,802 107,866 2.9 4,152,278 162,483 3.9 63,917 1.5 50.6<br />
Alaska............... 495,425 60,165 12.1 579,740 82,758 14.3 30,842 5.3 37.6<br />
Arizona .............. 3,374,806 700,287 20.8 4,752,724 1,229,237 25.9 539,937 11.4 75.5<br />
Arkansas ............ 2,186,665 60,781 2.8 2,492,205 123,755 5.0 57,709 2.3 103.6<br />
California ............ 27,383,547 8,619,334 31.5 31,416,629 12,401,756 39.5 6,277,779 20.0 43.9<br />
Colorado............. 3,042,986 320,631 10.5 4,006,285 604,019 15.1 267,504 6.7 88.4<br />
Connecticut .......... 3,060,000 466,175 15.2 3,184,514 583,913 18.3 234,799 7.4 25.3<br />
Delaware ............ 617,720 42,327 6.9 732,378 69,533 9.5 28,380 3.9 64.3<br />
District of Columbia.... 570,284 71,348 12.5 539,658 90,417 16.8 38,236 7.1 26.7<br />
Florida .............. 12,095,284 2,098,315 17.3 15,043,603 3,473,864 23.1 1,554,865 10.3 65.6<br />
Georgia ............. 5,984,188 284,546 4.8 7,594,476 751,438 9.9 374,251 4.9 164.1<br />
Hawaii............... 1,026,209 254,724 24.8 1,134,351 302,125 26.6 143,505 12.7 18.6<br />
Idaho ............... 926,703 58,995 6.4 1,196,793 111,879 9.3 46,539 3.9 89.6<br />
Illinois ............... 10,585,838 1,499,112 14.2 11,547,505 2,220,719 19.2 1,054,722 9.1 48.1<br />
Indiana .............. 5,146,160 245,826 4.8 5,657,818 362,082 6.4 143,427 2.5 47.3<br />
Iowa ................ 2,583,526 100,391 3.9 2,738,499 160,022 5.8 68,108 2.5 59.4<br />
Kansas .............. 2,289,615 131,604 5.7 2,500,360 218,655 8.7 98,207 3.9 66.1<br />
Kentucky ............ 3,434,955 86,482 2.5 3,776,230 148,473 3.9 58,871 1.6 71.7<br />
Louisiana ............ 3,886,353 391,994 10.1 4,153,367 382,364 9.2 116,907 2.8 –2.5<br />
Maine ............... 1,142,122 105,441 9.2 1,204,164 93,966 7.8 24,063 2.0 –10.9<br />
Maryl<strong>and</strong> ............ 4,425,285 395,051 8.9 4,945,043 622,714 12.6 246,287 5.0 57.6<br />
Massachusetts........ 5,605,751 852,228 15.2 5,954,249 1,115,570 18.7 459,073 7.7 30.9<br />
Michigan............. 8,594,737 569,807 6.6 9,268,782 781,381 8.4 294,606 3.2 37.1<br />
Minnesota ........... 4,038,361 227,161 5.6 4,591,491 389,988 8.5 167,511 3.6 71.7<br />
Mississippi ........... 2,378,805 66,516 2.8 2,641,453 95,522 3.6 36,059 1.4 43.6<br />
Missouri ............. 4,748,704 178,210 3.8 5,226,022 264,281 5.1 103,019 2.0 48.3<br />
Montana ............. 740,218 37,020 5.0 847,362 44,331 5.2 12,663 1.5 19.7<br />
Nebraska ............ 1,458,904 69,872 4.8 1,594,700 125,654 7.9 57,772 3.6 79.8<br />
Nevada.............. 1,110,450 146,152 13.2 1,853,720 427,972 23.1 207,687 11.2 192.8<br />
New Hampshire....... 1,024,621 88,796 8.7 1,160,340 96,088 8.3 28,073 2.4 8.2<br />
New Jersey .......... 7,200,696 1,406,148 19.5 7,856,268 2,001,690 25.5 873,088 11.1 42.4<br />
New Mexico .......... 1,390,048 493,999 35.5 1,689,911 616,964 36.5 201,055 11.9 24.9<br />
NewYork............ 16,743,048 3,908,720 23.3 17,749,110 4,962,921 28.0 2,310,256 13.0 27.0<br />
North Carolina ........ 6,172,301 240,866 3.9 7,513,165 603,517 8.0 297,858 4.0 150.6<br />
North Dakota ......... 590,839 46,897 7.9 603,106 37,976 6.3 11,003 1.8 –19.0<br />
Ohio ................ 10,063,212 546,148 5.4 10,599,968 648,493 6.1 234,459 2.2 18.7<br />
Oklahoma............ 2,921,755 145,798 5.0 3,215,719 238,532 7.4 98,990 3.1 63.6<br />
Oregon .............. 2,640,482 191,710 7.3 3,199,323 388,669 12.1 188,958 5.9 102.7<br />
Pennsylvania ......... 11,085,170 806,876 7.3 11,555,538 972,484 8.4 368,257 3.2 20.5<br />
Rhode Isl<strong>and</strong> ......... 936,423 159,492 17.0 985,184 196,624 20.0 83,624 8.5 23.3<br />
South Carolina........ 3,231,539 113,163 3.5 3,748,669 196,429 5.2 82,279 2.2 73.6<br />
South Dakota......... 641,226 41,994 6.5 703,820 45,575 6.5 16,376 2.3 (NS)<br />
Tennessee ........... 4,544,743 131,550 2.9 5,315,920 256,516 4.8 108,265 2.0 95.0<br />
Texas ............... 15,605,822 3,970,304 25.4 19,241,518 6,010,753 31.2 2,669,603 13.9 51.4<br />
Utah ................ 1,553,351 120,404 7.8 2,023,875 253,249 12.5 105,691 5.2 110.3<br />
Vermont ............. 521,521 30,409 5.8 574,842 34,075 5.9 9,305 1.6 (NS)<br />
Virginia .............. 5,746,419 418,521 7.3 6,619,266 735,191 11.1 303,729 4.6 75.7<br />
Washington .......... 4,501,879 403,173 9.0 5,501,398 770,886 14.0 350,914 6.4 91.2<br />
West Virginia ......... 1,686,932 44,203 2.6 1,706,931 45,895 2.7 13,550 0.8 3.8<br />
Wisconsin............ 4,531,134 263,638 5.8 5,022,073 368,712 7.3 148,910 3.0 39.9<br />
Wyoming ............ 418,713 23,809 5.7 462,809 29,485 6.4 8,919 1.9 23.8<br />
Puerto Rico ......... 3,522,037 (NA) (NA) 3,515,228 3,008,567 85.6 2,527,156 71.9 (NA)<br />
NA Not available. NS Not statistically different from zero at the 90-percent confidence level.<br />
Source: U.S. <strong>Census</strong> <strong>Bureau</strong>, <strong>Census</strong> <strong>2000</strong> Summary File 3 <strong>and</strong> 1990 <strong>Census</strong> Summary Tape File 3.<br />
U.S. <strong>Census</strong> <strong>Bureau</strong> 5
In the Northeast, the Midwest, <strong>and</strong><br />
the South, speakers of Other Indo-<br />
European languages made up the<br />
second largest non-<strong>English</strong>language<br />
speaking group, while in<br />
the West, the second largest group<br />
was speakers of Asian <strong>and</strong> Pacific<br />
Isl<strong>and</strong> languages. Half of Asian<br />
<strong>and</strong> Pacific Isl<strong>and</strong>-language speakers<br />
lived in the West in <strong>2000</strong>.<br />
Table 3 shows the change in the<br />
number of speakers of Spanish,<br />
Other Indo-European languages,<br />
Asian <strong>and</strong> Pacific Isl<strong>and</strong> languages,<br />
<strong>and</strong> All other languages between<br />
1990 <strong>and</strong> <strong>2000</strong>. The largest percentage<br />
increase of Spanish speakers<br />
was in the Midwest. Asian <strong>and</strong><br />
Pacific Isl<strong>and</strong>-language speakers<br />
increased most rapidly in the South<br />
<strong>and</strong> the Midwest. Although the<br />
number of Spanish speakers grew<br />
in all regions, more than threefourths<br />
of that growth was in the<br />
West <strong>and</strong> the South. The number<br />
of Asian <strong>and</strong> Pacific Isl<strong>and</strong>-language<br />
speakers grew substantially<br />
in all regions, with the greatest<br />
numerical increase in the West,<br />
which was home to more than half<br />
of all Asian <strong>and</strong> Pacific Isl<strong>and</strong>-language<br />
speakers in both years.<br />
Figure 4.<br />
Non-<strong>English</strong> <strong>Language</strong>s Spoken at Home,<br />
by Region: <strong>2000</strong><br />
(Population 5 years <strong>and</strong> over, in millions. Data based on sample. For<br />
information on confidentiality protection, nonsampling error, sampling<br />
error, <strong>and</strong> definitions, see www.census.gov/prod/cen<strong>2000</strong>/doc/sf3.pdf)<br />
Northeast<br />
Midwest<br />
South<br />
West<br />
0.4<br />
0.4<br />
0.4<br />
0.8<br />
0.6<br />
1.3<br />
1.3<br />
1.9<br />
2.0<br />
2.6<br />
2.4<br />
3.8<br />
3.6<br />
4.5<br />
Source: U.S. <strong>Census</strong> <strong>Bureau</strong>, <strong>Census</strong> <strong>2000</strong> Summary File 3.<br />
Spanish<br />
Other Indo-European languages<br />
Asian <strong>and</strong> Pacific Isl<strong>and</strong> languages<br />
All other languages<br />
9.9<br />
11.1<br />
More than one-quarter of<br />
the population in seven states<br />
spoke a language other than<br />
<strong>English</strong> at home in <strong>2000</strong>.<br />
California had the largest percentage<br />
of non-<strong>English</strong>-language speakers<br />
(39 percent), followed by New<br />
Mexico (37 percent), Texas (31 percent),<br />
New York (28 percent),<br />
Hawaii (27 percent), Arizona, <strong>and</strong><br />
New Jersey (each about 26 percent,<br />
see Table 2). The five states with<br />
fewer than 5 percent of the population<br />
who spoke a language other<br />
than <strong>English</strong> at home were all in<br />
the South — Tennessee (4.8 percent),<br />
Alabama <strong>and</strong> Kentucky<br />
(each 3.9 percent), Mississippi<br />
(3.6 percent), <strong>and</strong> West Virginia<br />
(2.7 percent).<br />
Eight states had over 1 million<br />
non-<strong>English</strong>-language speakers in<br />
<strong>2000</strong>, led by California (12.4 million)<br />
with more than twice the<br />
number of any other state. Texas<br />
had the second largest number of<br />
non-<strong>English</strong>-language speakers<br />
(6.0 million), followed by New York<br />
(5.0 million), Florida (3.5 million),<br />
Illinois (2.2 million), New Jersey<br />
(2.0 million), Arizona (1.2 million),<br />
<strong>and</strong> Massachusetts (1.1 million).<br />
During the 1990s, California surpassed<br />
New Mexico as the state<br />
with the largest proportion of<br />
non-<strong>English</strong>-language speakers.<br />
While the proportion of non-<br />
<strong>English</strong>-language speakers in New<br />
Mexico increased slightly from<br />
36 percent to 37 percent, the proportion<br />
in California jumped from<br />
31 percent to 39 percent.<br />
The number of non-<strong>English</strong>language<br />
speakers at least doubled<br />
in six states from 1990 to <strong>2000</strong>.<br />
The largest percentage increase<br />
occurred in Nevada, where the<br />
number increased by 193 percent.<br />
Nevada also had the highest rate<br />
of population increase during the<br />
decade. Georgia’s non-<strong>English</strong>language-speaking<br />
residents<br />
6 U.S. <strong>Census</strong> <strong>Bureau</strong>
Table 3.<br />
<strong>Language</strong> Spoken at Home for the Population 5 Years <strong>and</strong> Over Who Spoke a <strong>Language</strong><br />
Other Than <strong>English</strong> at Home for the United States <strong>and</strong> Regions: 1990 <strong>and</strong> <strong>2000</strong><br />
(Data based on sample. For information on confidentiality protection, sampling error, nonsampling error, <strong>and</strong> definitions, see<br />
www.census.gov/prod/cen<strong>2000</strong>/doc/sf3.pdf)<br />
Area<br />
Spanish<br />
Other Indo-European<br />
languages<br />
Asian <strong>and</strong> Pacific Isl<strong>and</strong><br />
languages<br />
All other languages<br />
1990 <strong>2000</strong> Percent<br />
change 1990 <strong>2000</strong> Percent<br />
change 1990 <strong>2000</strong> Percent<br />
change 1990 <strong>2000</strong><br />
Percent<br />
change<br />
United States . . 17,345,064 28,101,052 62.0 8,790,133 10,017,989 14.0 4,471,621 6,960,065 55.6 1,238,161 1,872,489 51.2<br />
Region<br />
Northeast ........ 3,133,043 4,492,168 43.4 3,547,154 3,778,958 6.5 845,442 1,348,621 59.5 298,646 437,584 46.5<br />
Midwest ......... 1,400,651 2,623,391 87.3 1,821,772 1,861,729 2.2 459,524 760,107 65.4 238,713 378,311 58.5<br />
South ........... 5,815,486 9,908,653 70.4 1,909,179 2,390,266 25.2 715,235 1,277,618 78.6 229,731 430,859 87.5<br />
West............ 6,995,884 11,076,840 58.3 1,512,028 1,987,036 31.4 2,451,420 3,573,719 45.8 471,071 625,735 32.8<br />
Source: U.S. <strong>Census</strong> <strong>Bureau</strong>, <strong>Census</strong> <strong>2000</strong> Summary File 3 <strong>and</strong> 1990 <strong>Census</strong> Summary Tape File 3.<br />
increased by 164 percent, followed<br />
by North Carolina (151 percent),<br />
Utah (110 percent), Arkansas<br />
(104 percent), <strong>and</strong> Oregon<br />
(103 percent). 7<br />
Since 1990, the proportion of people<br />
who spoke a language other<br />
than <strong>English</strong> at home decreased in<br />
three states. North Dakota had the<br />
largest decrease (19 percent), followed<br />
by Maine (11 percent) <strong>and</strong><br />
Louisiana (2 percent). These three<br />
states also had low rates of population<br />
growth from 1990 to <strong>2000</strong>.<br />
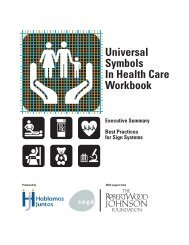
Counties with a large<br />
proportion of the population<br />
who spoke a language other<br />
than <strong>English</strong> at home were<br />
concentrated in border states.<br />
Figure 5 illustrates the high proportions<br />
of people who spoke a<br />
language other than <strong>English</strong> at<br />
home in <strong>2000</strong> in the states that<br />
border Mexico, the Pacific Ocean,<br />
or the Atlantic Ocean. Some of<br />
these “border states” were entry<br />
points for many immigrants.<br />
In <strong>2000</strong>, in about 1 percent of the<br />
3,141 counties in the United<br />
States, more than 60 percent of<br />
7<br />
The percentage increases between<br />
Arkansas <strong>and</strong> Utah <strong>and</strong> between Arkansas<br />
<strong>and</strong> Oregon were not statistically different<br />
from one another.<br />
the population spoke a language<br />
other than <strong>English</strong> at home. In<br />
seven counties, more than 80 percent<br />
of the population spoke a<br />
non-<strong>English</strong> language at home —<br />
Maverick, Webb, Starr, Kenedy,<br />
Zavala, Presidio, <strong>and</strong> Hidalgo — all<br />
in Texas. All but one of the 20<br />
counties with the highest proportions<br />
of non-<strong>English</strong>-language<br />
speakers were located in Texas<br />
(Santa Cruz County, Arizona being<br />
the exception).<br />
Figure 5 shows the high proportion<br />
of non-<strong>English</strong>-language speakers in<br />
counties with large cities, such as<br />
Atlanta, Chicago, Miami, <strong>and</strong> New<br />
York City. Other counties with relatively<br />
high proportions of non-<br />
<strong>English</strong>-language speakers included<br />
concentrations of people who spoke<br />
Native American languages. 8 For<br />
example, in Bethel <strong>Census</strong> Area,<br />
Alaska, 66 percent of the population<br />
spoke a language other than<br />
<strong>English</strong> at home, <strong>and</strong> 97 percent of<br />
the non-<strong>English</strong>-language speakers<br />
spoke a Native North American language.<br />
The Navajo speakers in the<br />
Navajo Nation Indian Reservation,<br />
which spanned several counties<br />
throughout Arizona, New Mexico,<br />
8<br />
For more detailed information on language<br />
use <strong>and</strong> <strong>English</strong>-speaking ability, see<br />
Summary File 3.<br />
<strong>and</strong> Utah, accounted for a large proportion<br />
of the population who<br />
spoke a language other than<br />
<strong>English</strong> at home in these counties.<br />
In some counties, relatively high<br />
proportions of non-<strong>English</strong>-language<br />
speakers are found in small, rural<br />
populations. For example, the proportions<br />
of non-<strong>English</strong>-language<br />
speakers were 25 percent in Logan<br />
County <strong>and</strong> 36 percent in McIntosh<br />
County in North Dakota <strong>and</strong> 33 percent<br />
in McPherson County in South<br />
Dakota. 9 In these three counties,<br />
each with a population of fewer<br />
than 4,000, German speakers were<br />
predominant among non-<strong>English</strong>language<br />
speakers: 95.3 percent,<br />
98.1 percent, <strong>and</strong> 99.6 percent,<br />
respectively. 10<br />
Among all counties, the median percentage<br />
of the population who<br />
spoke a language other than<br />
<strong>English</strong> at home was 4.6 percent. 11<br />
The fact that the proportion was<br />
9<br />
The proportions of non-<strong>English</strong>-language<br />
speakers in McIntosh County, North<br />
Dakota, <strong>and</strong> McPherson County, South<br />
Dakota, were not statistically different from<br />
each other.<br />
10<br />
The proportions of German speakers<br />
among non-<strong>English</strong>-language speakers in<br />
Logan County <strong>and</strong> McIntosh County, North<br />
Dakota, were not statistically different from<br />
each other.<br />
11<br />
The median percentage is a point<br />
estimate based on a sample.<br />
U.S. <strong>Census</strong> <strong>Bureau</strong> 7
8 U.S. <strong>Census</strong> <strong>Bureau</strong><br />
0 100 Miles<br />
0 100 Miles<br />
Figure 5.<br />
People Who Spoke a <strong>Language</strong><br />
Other Than <strong>English</strong> at<br />
Home: <strong>2000</strong><br />
(Data based on sample. For information on confidentiality protection, sampling error,<br />
nonsampling error, <strong>and</strong> definitions, see www.census.gov/prod/cen<strong>2000</strong>/doc/sf3.pdf)<br />
0 100 Miles<br />
Source: U.S. <strong>Census</strong> <strong>Bureau</strong>, <strong>Census</strong> <strong>2000</strong> Summary<br />
File 3. American FactFinder at factfinder.census.gov<br />
provides census data <strong>and</strong> mapping tools.<br />
U.S. percent 17.9<br />
U.S. percent 17.9<br />
Percent of people,<br />
5 years <strong>and</strong> over,<br />
who spoke a language<br />
other than <strong>English</strong> at<br />
home by state<br />
23.5 or more<br />
17.9 to 23.4<br />
4.6 to 17.8<br />
2.7 to 4.5<br />
Percent of people,<br />
5 years <strong>and</strong><br />
over, who spoke<br />
a language other<br />
than <strong>English</strong> at<br />
home by county<br />
60.0 or more<br />
35.0 to 59.9<br />
17.9 to 34.9<br />
4.6 to 17.8<br />
0.4 to 4.5<br />
0 100 Miles
Table 4.<br />
Ten Places of 100,000 or More Population With the<br />
Highest Percentage of People 5 Years <strong>and</strong> Over Who<br />
Spoke a <strong>Language</strong> Other Than <strong>English</strong> at Home, Who<br />
Spoke Spanish at Home, <strong>and</strong> Who Spoke <strong>English</strong> Less<br />
Than “Very Well”: <strong>2000</strong><br />
(Data based on sample. For information on confidentiality protection, sampling error,<br />
nonsampling error, <strong>and</strong> definitions, see www.census.gov/prod/cen<strong>2000</strong>/doc/sf3.pdf)<br />
Place<br />
below 4.6 percent in one-half of all<br />
counties, while the national average<br />
was 17.9 percent, reflects the large<br />
number of counties (primarily nonmetropolitan<br />
counties in the<br />
Midwest <strong>and</strong> the South) with relatively<br />
small populations <strong>and</strong> with<br />
low proportions of non-<strong>English</strong>language<br />
speakers.<br />
Number<br />
Percent<br />
90-percent<br />
confidence<br />
interval<br />
Spoke a <strong>Language</strong> Other Than <strong>English</strong><br />
Hialeah, FL .............................. 197,504 92.6 92.3 - 92.9<br />
Laredo, TX .............................. 145,510 91.8 91.4 - 92.2<br />
East Los Angeles, CA 1 .................... 97,645 87.4 86.8 - 88.0<br />
Brownsville, TX........................... 110,003 87.2 86.7 - 87.7<br />
El Monte, CA ............................ 84,834 80.7 80.0 - 81.4<br />
Santa Ana, CA ........................... 241,303 79.6 79.2 - 80.0<br />
McAllen, TX.............................. 73,882 76.1 75.3 - 76.9<br />
Miami, FL................................ 254,536 74.6 74.2 - 75.0<br />
El Paso, TX.............................. 369,000 71.3 70.9 - 71.7<br />
Elizabeth, NJ............................. 75,305 67.5 66.7 - 68.3<br />
Spoke Spanish<br />
Hialeah, FL .............................. 195,884 91.9 91.6 - 92.2<br />
Laredo, TX .............................. 144,633 91.3 90.9 - 91.7<br />
Brownsville, TX........................... 109,153 86.6 86.1 - 87.1<br />
East Los Angeles, CA 1 .................... 96,525 86.4 85.8 - 87.0<br />
McAllen, TX.............................. 71,800 74.0 73.2 - 74.8<br />
Santa Ana, CA ........................... 211,276 69.7 69.2 - 70.2<br />
El Paso, TX.............................. 356,558 68.9 68.5 - 69.3<br />
Miami, FL................................ 227,293 66.6 66.1 - 67.1<br />
El Monte, CA ............................ 64,889 61.8 61.0 - 62.6<br />
Pomona, CA ............................. 74,557 55.0 54.2 - 55.8<br />
Spoke <strong>English</strong> Less Than ‘‘Very Well’’<br />
Hialeah, FL .............................. 126,358 59.3 58.7 - 59.9<br />
East Los Angeles, CA 1 .................... 57,966 51.9 51.1 - 52.7<br />
Santa Ana, CA ........................... 156,692 51.7 51.2 - 52.2<br />
El Monte, CA ............................ 53,662 51.1 50.2 - 52.0<br />
Miami, FL................................ 160,790 47.1 46.6 - 47.6<br />
Laredo, TX .............................. 69,071 43.6 42.9 - 44.3<br />
Brownsville, TX........................... 52,970 42.0 41.2 - 42.8<br />
Garden Grove, CA........................ 57,313 37.6 36.9 - 38.3<br />
Elizabeth, NJ............................. 41,068 36.8 36.0 - 37.6<br />
Salinas, CA . ............................. 49,099 35.9 35.2 - 36.6<br />
1 East Los Angeles, CA, is a census designated place <strong>and</strong> is not legally incorporated.<br />
Note: Because of sampling error, the estimates in this table may not be significantly different from<br />
one another or from rates for other places not listed in this table.<br />
Source: U.S. <strong>Census</strong> <strong>Bureau</strong>, <strong>Census</strong> <strong>2000</strong> Summary File 3.<br />
Figure 5 illustrates the low<br />
proportions of non-<strong>English</strong>language<br />
speakers in many counties<br />
in the South <strong>and</strong> the Midwest,<br />
including Alabama, Arkansas, Iowa,<br />
Kentucky, Michigan, Mississippi,<br />
Missouri, Tennessee, West Virginia,<br />
<strong>and</strong> Wisconsin. In West Virginia, all<br />
but 2 of the 55 counties had a proportion<br />
of non-<strong>English</strong>-language<br />
speakers below 4.6 percent.<br />
Places with the highest<br />
percentages of non-<strong>English</strong>language<br />
speakers, Spanish<br />
speakers, <strong>and</strong> people who<br />
spoke <strong>English</strong> less than “Very<br />
well” were concentrated in<br />
California, Florida, <strong>and</strong> Texas.<br />
Of the 245 places with 100,000 or<br />
more population in <strong>2000</strong>, Hialeah,<br />
Florida, topped the list with<br />
93 percent of the population aged<br />
5 <strong>and</strong> over who spoke a language<br />
other than <strong>English</strong> at home in<br />
<strong>2000</strong>. 12 In addition, 92 percent<br />
spoke Spanish <strong>and</strong> 59 percent<br />
spoke <strong>English</strong> less than “Very well”<br />
in Hialeah (see Table 4). 13 Six additional<br />
places were included in all<br />
three categories in Table 4: Laredo<br />
<strong>and</strong> Brownsville, Texas; East Los<br />
Angeles, El Monte, <strong>and</strong> Santa Ana,<br />
California; <strong>and</strong> Miami, Florida.<br />
McAllen <strong>and</strong> El Paso, Texas, <strong>and</strong><br />
Elizabeth, New Jersey, were included<br />
in two of the three categories.<br />
Pomona, Garden Grove, <strong>and</strong> Salinas,<br />
all in California, were included in<br />
one of the three categories.<br />
ADDITIONAL FINDINGS<br />
How many people were<br />
linguistically isolated<br />
In the United States, the ability to<br />
speak <strong>English</strong> plays a large role in<br />
how well people can perform daily<br />
activities. How well a person<br />
speaks <strong>English</strong> may indicate how<br />
well he or she communicates with<br />
public officials, medical personnel,<br />
<strong>and</strong> other service providers. It<br />
12<br />
<strong>Census</strong> <strong>2000</strong> showed 245 places in the<br />
United States with 100,000 or more population.<br />
They included 238 incorporated places<br />
(including 4 city-county consolidations) <strong>and</strong><br />
7 census designated places that were not<br />
legally incorporated. For a list of these<br />
places by state, see www.census.gov<br />
/population/www/cen<strong>2000</strong>/phc-t6.html.<br />
13<br />
The percentages of people who spoke<br />
<strong>English</strong> less than “Very well” in Hialeah,<br />
Florida, <strong>and</strong> Laredo, Texas, were not statistically<br />
different from each other. The percentages<br />
of people who spoke Spanish in Hialeah,<br />
Florida, <strong>and</strong> Laredo, Texas, were also not statistically<br />
different from each other.<br />
U.S. <strong>Census</strong> <strong>Bureau</strong> 9
Linguistically Isolated<br />
Households<br />
A linguistically isolated household<br />
is one in which no person<br />
aged 14 or over speaks<br />
<strong>English</strong> at least “Very well.”<br />
That is, no person aged 14 or<br />
over speaks only <strong>English</strong> at<br />
home, or speaks another language<br />
at home <strong>and</strong> speaks<br />
<strong>English</strong> “Very well.”<br />
A linguistically isolated person<br />
is any person living in a<br />
linguistically isolated household.<br />
All the members of a<br />
linguistically isolated household<br />
are tabulated as linguistically<br />
isolated, including<br />
members under 14 years old<br />
who may speak only <strong>English</strong>.<br />
could also affect other activities<br />
outside the home, such as grocery<br />
shopping or banking. People who<br />
do not have a strong comm<strong>and</strong> of<br />
<strong>English</strong> <strong>and</strong> who do not have<br />
someone in their household to<br />
help them on a regular basis are at<br />
even more of a disadvantage.<br />
They are defined here as “linguistically<br />
isolated” (see text box<br />
above).<br />
In <strong>2000</strong>, 4.4 million households<br />
encompassing 11.9 million people<br />
were linguistically isolated. These<br />
numbers were significantly higher<br />
than in 1990, when 2.9 million<br />
households <strong>and</strong> 7.7 million people<br />
lived in those households.<br />
ABOUT CENSUS <strong>2000</strong><br />
Why <strong>Census</strong> <strong>2000</strong> Asked<br />
About <strong>Language</strong> <strong>Use</strong> <strong>and</strong><br />
<strong>English</strong>-<strong>Speaking</strong> <strong>Ability</strong><br />
The question on language use <strong>and</strong><br />
<strong>English</strong>-speaking ability provides<br />
government agencies with information<br />
for programs that serve the<br />
needs of people who have difficulty<br />
speaking <strong>English</strong>. Under the Voting<br />
Rights Act, information about language<br />
ability is needed to meet<br />
statutory requirements for making<br />
voting materials available in<br />
minority languages.<br />
The Bilingual Education Program<br />
uses data on language to allocate<br />
grants to school districts for children<br />
with limited <strong>English</strong> proficiency.<br />
These data also are needed for<br />
local agencies developing services<br />
for the elderly under the Older<br />
Americans Act.<br />
Accuracy of the Estimates<br />
The data contained in this report<br />
are based on the sample of households<br />
who responded to the<br />
<strong>Census</strong> <strong>2000</strong> long form.<br />
Nationally, approximately 1 out of<br />
every 6 housing units was included<br />
in this sample. As a result, the<br />
sample estimates may differ somewhat<br />
from the 100-percent figures<br />
that would have been obtained if<br />
all housing units, people within<br />
those housing units, <strong>and</strong> people<br />
living in group quarters had been<br />
enumerated using the same questionnaires,<br />
instructions, enumerators,<br />
<strong>and</strong> so forth. The sample<br />
estimates also differ from the values<br />
that would have been obtained<br />
from different samples of housing<br />
units, people within those housing<br />
units, <strong>and</strong> people living in group<br />
quarters. The deviation of a sample<br />
estimate from the average of<br />
all possible samples is called the<br />
sampling error.<br />
In addition to the variability that<br />
arises from the sampling procedures,<br />
both sample data <strong>and</strong> 100-<br />
percent data are subject to nonsampling<br />
error. Nonsampling error<br />
may be introduced during any of<br />
the various complex operations<br />
used to collect <strong>and</strong> process data.<br />
Such errors may include: not enumerating<br />
every household or every<br />
person in the population, failing to<br />
obtain all required information<br />
from the respondents, obtaining<br />
incorrect or inconsistent information,<br />
<strong>and</strong> recording information<br />
incorrectly. In addition, errors can<br />
occur during the field review of the<br />
enumerators’ work, during clerical<br />
h<strong>and</strong>ling of the census questionnaires,<br />
or during the electronic<br />
processing of the questionnaires.<br />
Nonsampling error may affect the<br />
data in two ways: (1) errors that<br />
are introduced r<strong>and</strong>omly will<br />
increase the variability of the data<br />
<strong>and</strong>, therefore, should be reflected<br />
in the st<strong>and</strong>ard errors; <strong>and</strong> (2)<br />
errors that tend to be consistent in<br />
one direction will bias both sample<br />
<strong>and</strong> 100-percent data in that direction.<br />
For example, if respondents<br />
consistently tend to underreport<br />
their incomes, then the resulting<br />
estimates of households or families<br />
by income category will tend<br />
to be understated for the higher<br />
income categories <strong>and</strong> overstated<br />
for the lower income categories.<br />
Such biases are not reflected in the<br />
st<strong>and</strong>ard errors.<br />
While it is impossible to completely<br />
eliminate error from an operation<br />
as large <strong>and</strong> complex as the decennial<br />
census, the <strong>Census</strong> <strong>Bureau</strong><br />
attempts to control the sources of<br />
such error during the data collection<br />
<strong>and</strong> processing operations.<br />
The primary sources of error <strong>and</strong><br />
the programs instituted to control<br />
error in <strong>Census</strong> <strong>2000</strong> are described<br />
in detail in Summary File 3<br />
Technical Documentation under<br />
Chapter 8, “Accuracy of the Data,”<br />
located at www.census.gov<br />
/prod/cen<strong>2000</strong>/doc/sf3.pdf.<br />
All statements in this <strong>Census</strong> <strong>2000</strong><br />
Brief have undergone statistical<br />
testing <strong>and</strong> all comparisons are<br />
significant at the 90-percent confidence<br />
level, unless otherwise<br />
noted. The estimates in tables,<br />
maps, <strong>and</strong> other figures may vary<br />
10 U.S. <strong>Census</strong> <strong>Bureau</strong>
from actual values due to sampling<br />
<strong>and</strong> nonsampling errors. As a<br />
result, estimates in one category<br />
may not be significantly different<br />
from estimates assigned to a different<br />
category. Further information<br />
on the accuracy of the data is<br />
located at www.census.gov<br />
/prod/cen<strong>2000</strong>/doc/sf3.pdf. For<br />
further information on the computation<br />
<strong>and</strong> use of st<strong>and</strong>ard errors,<br />
contact the Decennial Statistical<br />
Studies Division at 301-763-4242.<br />
For More Information<br />
The <strong>Census</strong> <strong>2000</strong> Summary File 3<br />
data are available from the<br />
American FactFinder on the<br />
Internet (factfinder.census.gov).<br />
They were released on a state-bystate<br />
basis during 2002. For information<br />
on confidentiality protection,<br />
nonsampling error, sampling<br />
error, <strong>and</strong> definitions, also see<br />
www.census.gov/prod/cen<strong>2000</strong><br />
/doc/sf3.pdf or contact the<br />
Customer Services Center at<br />
301-763-INFO (4636).<br />
Information on population <strong>and</strong><br />
housing topics is presented in the<br />
<strong>Census</strong> <strong>2000</strong> Brief series, located<br />
on the <strong>Census</strong> <strong>Bureau</strong>’s Web site at<br />
www.census.gov/population/www<br />
/cen<strong>2000</strong>/briefs.html. This series<br />
presents information on race,<br />
Hispanic origin, age, sex, household<br />
type, housing tenure, <strong>and</strong><br />
social, economic, <strong>and</strong> housing<br />
characteristics, such as ancestry,<br />
income, <strong>and</strong> housing costs.<br />
For additional information on<br />
language use <strong>and</strong> <strong>English</strong>-speaking<br />
ability, including reports <strong>and</strong> survey<br />
data, visit the <strong>Census</strong> <strong>Bureau</strong>’s<br />
Internet site at www.census.gov<br />
/population/www/socdemo<br />
/lang_use.html. To find information<br />
about the availability of data<br />
products, including reports,<br />
CD-ROMs, <strong>and</strong> DVDs, call the<br />
Customer Services Center at<br />
301-763-INFO (4636), or e-mail<br />
webmaster@census.gov.<br />
U.S. <strong>Census</strong> <strong>Bureau</strong> 11