Hot Shield PTC High Operating Temperature Smoke ... - Actionair
Hot Shield PTC High Operating Temperature Smoke ... - Actionair
Hot Shield PTC High Operating Temperature Smoke ... - Actionair

Create successful ePaper yourself
Turn your PDF publications into a flip-book with our unique Google optimized e-Paper software.
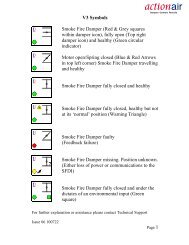
<strong>Hot</strong><strong>Shield</strong> <strong>PTC</strong> TM<br />
Acoustic Data<br />
The data presented is from the<br />
Laboratory Determination of Acoustic and<br />
Aerodynamic Performance of <strong>Hot</strong><strong>Shield</strong><br />
<strong>PTC</strong> <strong>High</strong> <strong>Operating</strong> <strong>Temperature</strong><br />
<strong>Smoke</strong> Management and Fire Dampers.<br />
A programme of extensive tests was<br />
carried out in the Reverberation Chamber<br />
and North Transmission Chamber of<br />
Sound research Laboratories Limited,<br />
Holbrook Hall, Sudbury, Suffolk, generally<br />
in accordance with BRITISH STANDARDS<br />
Nos. 4196, 4773, 4856, 4857 and 4954.<br />
This independent test facility is approved<br />
under the NAMAS Scheme.<br />
From the selection of a duct velocity<br />
within the operational parameters of the<br />
damper a resultant pressure drop from<br />
Table 1 can be determined and the sum<br />
of these two components applied to the<br />
Velocity x Pressure Drop Vs Sound Power<br />
Level Graph. (Table 2)<br />
The graph is the result of a full<br />
range of acoustic tests on <strong>Hot</strong><strong>Shield</strong><br />
<strong>PTC</strong> <strong>High</strong> <strong>Operating</strong> <strong>Temperature</strong><br />
<strong>Smoke</strong> Management and Fire Dampers<br />
with the blades set in then fully open<br />
position.<br />
The Spectrum Correction Data is applied<br />
to the number obtained from the graph<br />
and a complete Sound Spectrum of Flow<br />
Generated Noise for both Outlet (in duct)<br />
and Breakout (casing radiated) is<br />
obtained.<br />
Example:<br />
Duct with a design velocity of<br />
8 m/sec. <strong>Hot</strong><strong>Shield</strong> <strong>PTC</strong> Damper Series<br />
2501 fully open.<br />
Pressure Drop = 22 Pa (Table 1).<br />
Multiply Velocity x Pressure Drop<br />
8 x 22 = 176.<br />
From Sound Power Graph (Table 2) plot<br />
176 on horizontal Velocity/Pressure axis<br />
against 2501 outlet (induct) graph to<br />
obtain 47 dBW on Vertical Sound Power<br />
Level Axis. Add or subtract corrections to<br />
the 47 dBW to provide full spectrum<br />
analysis.<br />
Velocity (m/s) X Pressure Drop (Pa) Vs Sound Power Level (dBW)<br />
90<br />
Pressure Drop Vs Velocity<br />
PRESSURE DROP (Pa)<br />
100<br />
90<br />
80<br />
70<br />
60<br />
50<br />
40<br />
30<br />
20<br />
10<br />
987<br />
6<br />
5<br />
4<br />
3<br />
2<br />
EXAMPLE LINE<br />
TYPE 2501<br />
TYPE 2601<br />
1<br />
1 2 3 4 5 6 7 8 9 10 15<br />
Table 1<br />
VELOCITY (m/s)<br />
Damper Leakage<br />
<strong>Hot</strong><strong>Shield</strong> <strong>PTC</strong> and<br />
<strong>Hot</strong><strong>Shield</strong> Vent <strong>PTC</strong> closed blade<br />
leakage as tested on a damper 1000mm<br />
wide x 1000mm high.<br />
Leakage Data at Ambient <strong>Temperature</strong><br />
(Cold <strong>Smoke</strong>).<br />
15001<br />
SOUND POWER LEVEL (dBW)<br />
80<br />
70<br />
60<br />
50<br />
40<br />
30<br />
20<br />
EXAMPLE LINE<br />
2501 BREAKOUT<br />
2601 BREAKOUT<br />
2601 OUTLET (INDUCT)<br />
2501 OUTLET (INDUCT)<br />
PRESSURE DIFFERENTIAL ACROSS CLOSED DAMPER (Pa)<br />
1000<br />
900<br />
800<br />
700<br />
600<br />
500<br />
400<br />
300<br />
200<br />
100<br />
90<br />
80<br />
70<br />
60<br />
50<br />
40<br />
30<br />
10<br />
20<br />
0<br />
Table 2<br />
10<br />
20<br />
30<br />
40<br />
50<br />
60<br />
70<br />
80<br />
90<br />
100<br />
200<br />
300<br />
400<br />
500<br />
600<br />
700<br />
800<br />
900<br />
1000<br />
VELOCITY X PRESSURE DROP (m/s Pa)<br />
2000<br />
3000<br />
4000<br />
5000<br />
6000<br />
7000<br />
8000<br />
9000<br />
10000<br />
10<br />
5 6 7 8 9 10 20 30 40 60 80 100<br />
50 70 90<br />
Table 3<br />
LEAKAGE (I/s)<br />
<strong>Hot</strong><strong>Shield</strong> <strong>PTC</strong> Outlet (Induct) Spectrum<br />
Corrections<br />
Octave Band63 125 250 500 1k 2k 4k 8k<br />
Series 2501 +5 +4 +5 +5 +3 +1 -3 -5<br />
Series 2601 +9 +4 +4 +5 +3 +1 -3 -6<br />
<strong>Hot</strong><strong>Shield</strong> <strong>PTC</strong> Breakout Spectrum<br />
Corrections<br />
63 125 250 500 1k 2k 4k 8k Hz<br />
+8 +11 +9 +6 -3 -6 -14 -17 dB<br />
+6 +10 +8 +4 -3 -3 -11 -14 dB<br />
The leakage as detailed in Table 3 was<br />
achieved after a total immersion test at<br />
300 °C for 1 hour (as witnessed by the<br />
Loss Prevention Council).<br />
12 www.actionair.co.uk