Article 1 NEW SPECTROPHOTOMETRIC METHODS FOR ... - jchps
Article 1 NEW SPECTROPHOTOMETRIC METHODS FOR ... - jchps
Article 1 NEW SPECTROPHOTOMETRIC METHODS FOR ... - jchps

You also want an ePaper? Increase the reach of your titles
YUMPU automatically turns print PDFs into web optimized ePapers that Google loves.
ISSN: 0974-2115<br />
Journal of Chemical and Pharmaceutical sciences<br />
<strong>NEW</strong> <strong>SPECTROPHOTOMETRIC</strong> <strong>METHODS</strong> <strong>FOR</strong> SIMULTANEOUS DETERMINATION OF<br />
AMLODIPINE BESYLATE AND ATORVASTATIN CALCIUM IN TABLET DOSAGE <strong>FOR</strong>MS<br />
1 PRAGATI KUMAR BADA, 1 PRAFULLA KUMAR SAHU* AND 2 T.ABHINOV<br />
1 Dept.of Pharmaceutical Analysis & Quality Assurance, Nimra College of Pharmacy, Nimra Nagar, Jupudi,<br />
Ibrahimpatnam, Vijayawada, Andhra Pradesh-521456<br />
2 Shadan Inst.of Medical Sciences, Hyderabad<br />
*Corresponding Author: E-mail: kunasahu1@rediffmail.com, Mobile: 8121139575<br />
ABSTRACT<br />
A simple, accurate, precise and reproducible UV spectrophotometric method was developed for simultaneous<br />
estimation of Amlodipine besylate (AMD) and Atorvastatin calcium (ATR) in tablet dosage form have been developed.<br />
First method is simultaneous equation method; in this method 361nm and 246 nm were selected to measure the<br />
absorbance of drugs at both wavelengths. The second method is Q-value analysis based on measurement of absorptivity<br />
at 238.8 nm (as an iso-absorptive point) and 246 nm. AMD and ATR at their respective maximum wavelength 361 nm<br />
and 246 nm and at isoabsorptive point 238.8 nm shows linearity in a concentration range of 0.5-30 µg/mL. Recovery<br />
studies range from >99.82% for AMD and >98.09% for ATR in case of simultaneous equation method and >100% for<br />
AMD and >98.45% for ATR in case of Q-analysis method confirming the accuracy of the proposed method. The<br />
proposed methods are recommended for routine analysis since it is rapid, simple, accurate and also sensitive and<br />
specific (no heating and no organic solvent extraction is required).<br />
KEY WORDS: Amlodipine, Atorvastatin, Simultaneous equation method, Q-analysis, Absorption correction method.<br />
1.INTRODUCTION<br />
Amlodipine (AMD) is a white crystalline powder which is slightly soluble in water, sparingly soluble in ethanol<br />
and freely soluble in methanol. It is official in B.P. Chemically Amlodipine, (Fig 1.) is 3-Ethyl-5-methyl (±)-2-[(2-<br />
aminoethoxy) methyl]-4-(2-chlorophenyl)-1, 4- dihydro-6-methyl-3, 5-pyridinedicarboxylatebenzenesulfonat<br />
(Budawari,2008). AMD is a dihydropyridine derivative with calcium antagonist activity (Martindale and<br />
Sweetman,1999). It is used in the management of hypertension, chronic stable angina pectoris and prinzmetal variant<br />
angina (Oneil,2001). AMD acts by inhibiting the transmembrane influx of calcium ions into vascular smooth muscle<br />
and cardiac muscle and also acts directly on vascular smooth muscle to cause a reduction in peripheral vascular<br />
resistance and reduction in blood pressure. Atorvastatin (ATR) is a synthetic hydroxyl methyl glutaryl coenzyme A<br />
(HMG-CoA) reductase inhibitor that has been used as a lipid lowering agent (Mohammadi,2007). Chemically,<br />
Atorvastatin (Fig 2.) is [R-(R*, R*)]-2-(4-flurophenyl)-B, B—dihydroxy-5-(1-methylethyl)-3-phenyl-4-[(phenyl amino)<br />
carbonyl]-1H-pyrrole-1-heptanoic acid (Desager and Hormans,1996). ATR is a competitive inhibitor of HMG-CoA<br />
reductase. This enzyme catalyzes the reduction of 3-hydroxy-3-methylgultaryl-coenzyme-A to mevalonate, which is<br />
the rate-determining step in hepatic cholesterol synthesis. Because cholesterol synthesis decreases, hepatic cells<br />
increase the number of LDL receptors on the surface of the cells, which inturn increase the amount of LDL uptake by<br />
the hepatic cells, and decrease the amount of LDL in the blood (Malinowski,1998;Burnham,2002).<br />
Literature survey revealed that no UV methods are reported for the simultaneous determination of Amlodipine and<br />
Atorvastatin till date. Methods are available for the quantification of Amlodipine individually and with other<br />
combinations other than Atorvastatin by HPLC (Bahrami and Mirzaeei,2004;Agrekar and Powar,2000;Vora and<br />
Kadav,2008;Kumar;Zarghi,2005), by UV (Priyanka,2009;Topale,2003). Methods are available for the quantification of<br />
Atorvastatin individually and with other combinations other than Amlodipine HPLC (Sandeep,2006;Lincy<br />
joseph,2008;Bahrami,2005). Present study involves development and validation of two spectrophotometric methods for<br />
the simultaneous determination of Amlodipine and Atorvastatin (ATR) in pharmaceutical formulations and in Drug<br />
substances.<br />
July – September 2011 94 JCPS Volume 4 Issue 3
ISSN: 0974-2115<br />
Journal of Chemical and Pharmaceutical sciences<br />
2. MATERIALS AND <strong>METHODS</strong><br />
2.1. Instrumentation and chemicals: Spectral runs were made on a Double beam UV-Visible spectrophotometer,<br />
model-T80+ was employed with spectral bandwidth of 0.2 nm and automatic wavelength corrections with a pair of 10<br />
mm quartz cells. The software is UVWin5 ver5.1.1, PG instruments. ATR and AMD were purchased from SL drugs &<br />
Pharmaceuticals (Hyderabad, India). Purified water was prepared using a Millipore Milli-Q (Nanopure Diamond,<br />
Barnstead thermolyne, USA) water purification system. Acetonitrile, Methanol was purchased from Merck Ltd. (Mumbai,<br />
India).<br />
2.2. Preparation of standard drug solutions: An accurately weighed 10 mg of each of ATR and AMD was dissolved in<br />
10 ml of methanol to obtain a concentration of 1 mg/mL each. From 1 mg/mL solution 1 ml was taken and made to 10 ml<br />
with methanol to obtain a concentration of 100µg/mL each. Daily working standard solutions of AMD and ATR was<br />
prepared by suitable dilution of the stock solution with methanol.<br />
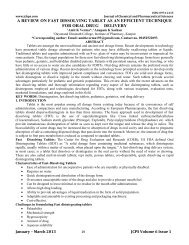
2.3. Determination of maximum wavelength and Iso-absorptive point: By appropriate dilution of two standard drug<br />
solutions with methanol, solutions containing 10 µg /ml of AMD and 10 µg /ml of ATR were scanned separately in the<br />
range of 200- 400 nm to determine the wavelength of maximum absorption for both the drugs. AMD showed<br />
absorbance maxima at 361nm (λ1) and 236.5 nm and ATR showed absorbance maxima at 246 nm (λ 2). The overlain<br />
spectra showed λ max of both drugs and also isoabsorptive points at 238.8 nm (Fig 3.).<br />
2.4. Method I (Simultaneous equation method) (Becket and Stenlake):<br />
Two wavelengths selected for the method are 361 nm and 246 nm that are absorption maxima of AMD and<br />
ATR respectively in methanol. The stock solutions of both the drugs were further diluted separately with methanol to<br />
get a series of standard solutions of 0.5-30 µg /mL concentrations. The absorbances were measured at the selected<br />
wavelengths and absorptivities (A 1%, 1 cm) for both the drugs were determined as mean of three independent<br />
determinations. Concentrations in the sample were obtained by using following equations-<br />
Cx = (A 2 ay 1 -A 1 ay 2 )/ (ax 2 ay 1 -ax 1 ay 2 ), Cy = (A 1 ax 2 -A 2 ax 1 )/ (ax 2 ay 1 -ax 1 ay 2 )<br />
Where, A 1 and A 2 are absorbances of mixture at 361nm and 246 nm respectively, ax 1 and ax 2 are absorptivities<br />
of ATR at λ 1 and λ 2 respectively and ay 1 and ay 2 are absorptivities of AMD at λ 1 and λ 2 respectively. Cx and Cy are<br />
concentrations of ATR and AMD respectively.<br />
2.5. Method II (Absorption ratio or Q-Analysis method) (Becket and Stenlake):<br />
From the overlain spectrum of AMD and ATR, two wavelengths were selected one at 238.8 nm which is the<br />
isoabsorptive point for both the drugs and the other at 246 nm which is λ max of ATR. The absorbances of the sample<br />
solutions are prepared in a similar manner as in the previous method, were measured and the absorbance ratio values for<br />
both the drugs at selected wavelengths were also calculated. The method employs Q-values and the concentrations of<br />
drugs in sample solution were determined by using the following formula,<br />
– <br />
Conc. of ATR: 1 ,<br />
– <br />
Conc. Of AMD:C2 <br />
<br />
–<br />
A = Absorbance of sample at isoabsorptive point, a = Absorptivities of AMD and ATR respectively at isoabsorptive<br />
point. Q m , Q 1 and Q 2 are absorbance ratio of mixture, AMD and ATR at Iso-absorptive point to maximum wavelength<br />
of one of the component (selected wavelength).<br />
3.EXPERIMENTAL<br />
3.1. Method Validation: Method was validated accordance to ICH guidelines (FDA,2000;ICH,1995;ICH,1996) for<br />
system suitability, linearity, precision, accuracy, limit of detection, limit of quantification and specificity.<br />
3.2. Linearity: The linearity of this method was evaluated by Linear Regression Analysis, which was calculated by Least<br />
Square method and the drug was linear in the concentration range of 0.5-30 µg/ml for both the drugs. Calibration<br />
standards were prepared by spiking required volume of working standard (100µg/mL) solution into different 10 ml<br />
volumetric flasks and volume made with methanol to yield concentrations of 0.5, 1, 2, 5, 10, 20 and 30µg/ml. The<br />
resultant absorbances of the drugs were measured. Calibration curve was plotted between absorbance of drug against<br />
concentration of the drug. These results shown there was an excellent correlation between absorbance and analyte<br />
concentration. The linearity graph is presented in [Fig 4.].<br />
3.3. Intra-day and Inter-day Precision and Accuracy: Precision and accuracy was studied by quality control samples of<br />
standard solutions covering low, medium and high concentrations (3, 15 and 25µg/mL) of linearity range were prepared<br />
July – September 2011 95 JCPS Volume 4 Issue 3<br />
–
ISSN: 0974-2115<br />
Journal of Chemical and Pharmaceutical sciences<br />
and measured the absorbance of three replicated samples of each concentration. Intra-day precision was studied by six<br />
replicate measurements at three concentration levels in the same day. Inter-day precision was conducted during routine<br />
operation of the system over a period of 3 consecutive days. Accuracy of the method was determined by calculating<br />
recovery studies. Statistical evaluation revealed that relative standard deviation of the drug at different concentration<br />
levels for six injections were less than 2. Precision and accuracy data were shown in Table 2 and 3.<br />
3.4. limits of Detection and Quantification: The limit of detection of an analytical method may be defined as the<br />
concentration, which gives rise to instrument signal that is significantly different from the blank(signal to noise ratio 3)<br />
and LOQ is the concentration that can be quantitated reliably with a specified level of accuracy and precision (signal to<br />
noise ratio 10). The LOD and LOQ was calculated based on the Standard Deviation of the Response and the Slope. The<br />
values were shown in Table 1.<br />
3.5. Application of Methods to Tablet Dosage forms: 20 Tablets (Brand Name: ALNAVAS-A, anla bio) were<br />
weighed, and an accurately weighed sample of powdered tablets equivalent to 5mg of AMD and 10mg of ATR<br />
[equivalent to one tablet]. For analysis of drug, a standard addition method was used. An accurately weighed 5 mg of<br />
pure AMD was added to finely powdered samples to bring the ratio of AMD and ATR to 1:1. Quantity of powder<br />
equivalent to 10 mg of AMD and 10 mg of ATR was weighed and dissolved in 60 mL of methanol and sonicated for 10<br />
minutes in a 100ml volumetric flask and this solution was filtered through Whatmann No.1 filter paper. The residue was<br />
washed with 10ml methanol three times and volume made upto 100ml with methanol. The solution obtained was diluted<br />
with the Methanol so as to obtain a concentration in the range of linearity previously determined. All determinations<br />
were carried out in five replicates. In Method I, the concentration of both AMD and ATR were determined by<br />
measuring the absorbance of the sample at 246 nm and 361nm. For Method II, the concentration of both AMD and ATR<br />
were determined by measuring absorbance of the sample at 238.8 nm and 246 nm and values were substituted in the<br />
respective formula to obtain concentrations. Results of tablet analysis are shown in Table 4.<br />
4.RESULTS AND DISCUSSION<br />
Drug content in tablet (amount found) was directly found from equations for both the methods. Standard deviations<br />
and Coefficient of variation was calculated (Table 2and 3). The low standard deviation values indicated repeatability,<br />
accuracy and reproducibility of the methods. Reproducibility, reliability and interference was also confirmed by recovery<br />
studies. Thus, it can be concluded that the methods developed were simple, accurate, sensitive and precise. Statistical<br />
analysis and drug recovery data showed that both methods are sensitive, accurate and precise. Results of the analysis of<br />
pharmaceutical formulations reveal that the proposed methods are suitable for their simultaneous determination with<br />
virtually no interference of usual additive present in pharmaceutical formulations. Hence, the above methods can be<br />
applied successfully in simultaneous estimation of Atorvastatin calcium and Amlodipine besylate in marketed<br />
formulations.<br />
Fig 3 : Overlain spectra of Amlodipine and Atorvastatin<br />
ISO-ABSORPTIVE POINT (238.8nm)<br />
ATR (246nm)<br />
AMD (361nm)<br />
July – September 2011 96 JCPS Volume 4 Issue 3
ISSN: 0974-2115<br />
Journal of Chemical and Pharmaceutical sciences<br />
2.5<br />
2<br />
1.5<br />
1<br />
0.5<br />
0<br />
Fig 4: Linearity graph of Amlodipine and Atorvastatin mixture<br />
y = 0.067x + 0.005<br />
R² = 0.999<br />
y = 0.061x + 0.003<br />
R² = 0.998<br />
y = 0.011x + 0.004<br />
R² = 0.998<br />
0 10 20 30 40<br />
mixture 238.8nm<br />
mixture 246nm<br />
mixture 361nm<br />
Linear (mixture<br />
238.8nm)<br />
Linear (mixture<br />
246nm)<br />
Table 1: Optical characteristics<br />
Parameter<br />
238.8nm<br />
246nm<br />
361nm<br />
AMD ATR AMD ATR AMD ATR<br />
Beer law limit (µg/mL) 0.5-30 0.5-30 0.5-30 0.5-30 0.5-30 0.5-30<br />
Molar absorptivity 1.30X10 4 1.78X10 4 9.44X10 3 2.13X10 4 1.35X10 4 1.78X10 4<br />
Regression equation<br />
Y=Mx+c<br />
Slope (m) 0.067 0.061 0.011<br />
Intercept (c) 0.005 0.003 0.004<br />
Correlation coefficient (R 2 ) 0.999 0.998 0.998<br />
Limit of detection (µg/mL) 0.028 0.054 0.017<br />
Limit of quantification (µg/mL) 0.086 0.163 0.052<br />
Table 2 : Intra-day precision and accuracy of Amlodipine and Atorvastatin<br />
AMD 3<br />
15<br />
25<br />
ATR 3<br />
15<br />
25<br />
Conc. (µg/mL)<br />
Method – I<br />
Accuracy<br />
%RSD<br />
103.77±1.48 1.429<br />
101.22±0.29 0.295<br />
99.82±0.17 0.172<br />
98.09±0.78 0.797<br />
105.86±0.07 0.073<br />
103.33±0.56 0.548<br />
Values expressed Mean±SD, (n=6)<br />
Method – II<br />
Accuracy<br />
%RSD<br />
104.48±0.30 0.295<br />
103.24±0.10 0.103<br />
104.97±0.03 0.037<br />
99.62±0.29 0.295<br />
98.43±0.10 0.103<br />
100.08±0.03 0.035<br />
Table 3 : Inter-day precision and accuracy of Amlodipine and Atorvastatin<br />
AMD 3<br />
15<br />
25<br />
ATR 3<br />
15<br />
25<br />
Conc. (µg/mL)<br />
Method – I<br />
Accuracy<br />
%RSD<br />
Method – II<br />
Accuracy<br />
%RSD<br />
102.88±1.47 1.430 100.64±0.46 0.462<br />
103.12±0.29 1.472 103.24±0.10 0.103<br />
99.82±0.17 0.172 104.97±0.03 0.037<br />
100.08±0.46 0.462 100.64±1.06 1.054<br />
104.42±1.10 1.057 99.31±1.00 1.103<br />
99.80±0.17 0.175 100.24±0.22 0.220<br />
Values expressed Mean±SD, (n=9)<br />
July – September 2011 97 JCPS Volume 4 Issue 3
ISSN: 0974-2115<br />
Journal of Chemical and Pharmaceutical sciences<br />
Table 4: Recovery study from formulation of Amlodipine and Atorvastatin<br />
Labeled amount<br />
(Alnavas-A)<br />
Method – I<br />
Accuracy<br />
%RSD<br />
Method – II<br />
Accuracy<br />
%RSD<br />
AMD 5mg 101.22±0.69 0.694 103.24±0.10 0.203<br />
ATR 10mg 99.86±0.06 0.063 98.43±0.10 0.503<br />
Values expressed Mean±SD, (n=5)<br />
REFERENCES<br />
Agrekar AP, Powar SG, Reverse phase High Performance Liquid Chromatographic determination of Ramipril and<br />
Amlodipine in tablets, J.Pharm.Biomed.Anal., 21, 2000, 1137-1142.<br />
Bahrami GH, Mirzaeei Sh, Simple and rapid HPLC method for determination of Amlodipine in human serum with<br />
fluorescence detection and its use in pharmacokinetic studies, Journal of Pharmaceutical and Biomedical Analysis,<br />
36, 2004, 163–168.<br />
Bahrami Gh, Bahareh Mohammadia, Shahla Mirzaeei, Amir Kiani, Determination of Atorvastatin in human serum<br />
by RP-HPLC with UV detection, Journal of Chromatography B, 826, 2005, 41–45.<br />
Becket AH, Stenlake JB, Practical Pharmaceutical Chemistry, 4 th ed., part-II, CBS publishers and Distributors, 11,<br />
Darayaganj, New Deilhi, India.<br />
Budawari S, The Merck Index, 23rd ed., Whitehouse Station, New Jersey, 516, 2008, 6235.<br />
Burnham TH, HMG-CoA reductase inhibitors, In: ed. Drug Facts and Comparisons, Louis: Facts and Comparisons,<br />
2002, Inc 536-542a.<br />
Desager JP, Hormans Y, Clinical Pharmacokinetics of 3-hydroxy-3methylglutaryl-coenzyme A reductase<br />
inhibitors, Clin.Pharmcokinet., 31, 1996, 348-371.<br />
FDA., 2000. Analytical Procedures and Methods Validation: Chemistry, Manufacturing, and Controls, Federal<br />
Register (Notices), 65 (169), 52:776–777.<br />
ICH Q2A, Guidelines on validation of analytical procedure: Definitions and terminology, Federal Register, 1995,<br />
60:11260.<br />
ICH Q2B, Guidelines on validation of analytical procedure: methodology, Federal Register, 1996, 60:27464.<br />
Kumar R, Sharma A, Mitra M, Chandrashekhar T, Stability indicating RP-HPLC method for simultaneous<br />
estimation of Amlodipine and Benazepril hydrochloride in capsule dosage form, Analytical Research, Ranbaxy<br />
Research Laboratories.<br />
Lincy joseph, Mathew George, Venkata ranga rao B, Simultaneous estimation of Atorvastatin and Ramipril by RP-<br />
HPLC and spectroscopy, Pak.J.Pharm.Sci., 213, 2008, 282-284.<br />
Lipitor product information, Park-Davis/Pfizer Inc., April 2002.<br />
Malinowski JM, Atorvastatin: A hydroxymethylglutaryl-coenzyme A reductase inhibitors, J.Health-Syst.Pharm.,<br />
1998, 2253-2267.<br />
Martindale, Sweetman SC, The complete drug reference, 32nd ed., Pharmaceutical Press, 1999, 822, 907.<br />
Mohammadi A, Rezanour N, Ansari M, Dogaheh, Ghorbani F, Bidkorbeh, Hashem M, Walker RB, Stability<br />
indicating RP-HPLC assay for simultaneous determination of Atorvastatin and Amlodipine in commercial tablets,<br />
Journal of Chromatography B, 846, 2007, 215-221.<br />
July – September 2011 98 JCPS Volume 4 Issue 3
ISSN: 0974-2115<br />
Journal of Chemical and Pharmaceutical sciences<br />
Oneil MJ, Smith A, Heckelman PE, Budawari S, The Merck Index, an Encyclopedia of Chemicals, Drugs and<br />
Biologicals, 13rd ed., Merck and Co Inc., White House Station, New jersey, 2001, 488, 865.<br />
Priyanka R Patil, Sachin U Rakesh, Dhabale PN, Burade KB, Simultaneous UV Spectrophotometric Method for<br />
Estimation of Losartan potssium and Amlodipine in Tablet Dosage Form, Asian J.Research Chem., 2(1), 2009.<br />
Sandeep SS, Atul AS, Ravindra AF, Sanjay JS, Application of UV-spectrophotometry and RP-HPLC for<br />
simultaneous determination of Atorvastatin and ezetimibe in pharmaceutical dosage forms, Eurasian Journal of<br />
Analytical Chemistry, 1(1), 2006.<br />
Topale PR, Gaikwad NJ, Tajane MR, Simultaneous UV- spectrophotometric estimation of losartan potassium and<br />
Amlodipine in tablet, Indian drugs, 40 (2), 2003, 119-121.<br />
Vora DN, Kadav AA, Development and validation of simultaneous estimation of Amlodipine and Bisoprolol<br />
fumarate in tablet formulation, Indian journal of pharmaceutical sciences, 70(4), 2008, 542-546.<br />
Zarghi A, Validated HPLC method for determination of Amlodipine in human plasma and its application to<br />
Pharmacokinetic studies, Farmaco, 60, 2005, 789-792.<br />
July – September 2011 99 JCPS Volume 4 Issue 3