Varian Fluorimeter Cary Eclipse
Varian Fluorimeter Cary Eclipse
Varian Fluorimeter Cary Eclipse

Create successful ePaper yourself
Turn your PDF publications into a flip-book with our unique Google optimized e-Paper software.
• On the Reports tab, enter Operator Name. To automatically label peaks on the<br />
spectrum, select Maximum Peak or All Peaks options. The peak threshold limit and<br />
labeling options are altered by pressing the Peak Information button.<br />
• On the Auto Storage tab, select whether to save the scans before or after a run. Selecting<br />
after the run (not the default choice) will avoid saving bad data.<br />
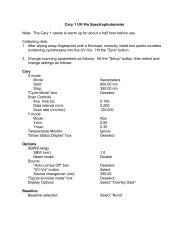
DATA COLLECTION:<br />
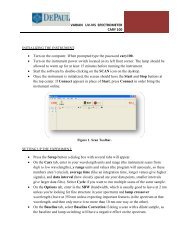
Figure 2. Set up Dialog Box.<br />
• In order to zero the instrument, place the blank solution in the sample compartment #4.<br />
Press the zero button to zero the system. When the result is zeroed, the word ‘Zeroed’<br />
will appear in the Y display box in the top left corner of the scan application window.<br />
DO NOT discard the blank, you must zero the system before each reading.<br />
• Replace the blank with the sample to be analyzed in compartment #4 and press the Start<br />
button. You will be asked for a sample name then the spectrum will start running and the<br />
trace will appear in the graphics area. Autoscale the spectrum if it goes offscale. Once<br />
the run is completed, a save file box will be presented to allow naming the file. Any peak<br />
information will be printed in the report box (the bottom half underneath the plot).<br />
• Text can be added to the plot by pressing the A button. When running multiple scans in<br />
one session, pressing the traces button (the farthest left button in the toolbar) to select<br />
individual data sets can be selected and made visible in the current plot. Please note that<br />
all data plots (including any baselines) are still accessible through the Graph menu, and<br />
all will be printed out when printing the data. In order to omit any data set, right click on<br />
the graph with that data and select Remove Graph.<br />
2