Varian UV-Vis Spectrometer Cary 50
Varian UV-Vis Spectrometer Cary 50
Varian UV-Vis Spectrometer Cary 50

You also want an ePaper? Increase the reach of your titles
YUMPU automatically turns print PDFs into web optimized ePapers that Google loves.
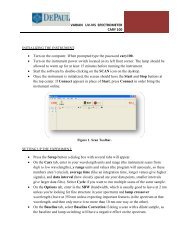
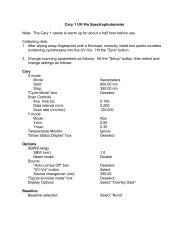
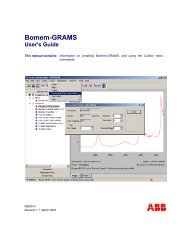
• On the Reports tab, enter Operator Name. To automatically label peaks on the<br />
spectrum, select Maximum Peak or All Peaks options. The peak threshold limit and<br />
labeling options are altered by pressing the Peak Information button.<br />
• On the Auto Storage tab, select whether to save the scans before or after a run. Selecting<br />
after the run (not the default choice) will avoid saving bad data.<br />
Figure 2. Set up Dialog Box.<br />
PELTIER TEMPERATURE CONTROL:<br />
• The single cell temperature control accessory is controlled directly from the peltier<br />
keypad. In order to set up the desired temperature simply set the temperature, make sure<br />
the correct window is installed and the water pump turned on. In order to stir the solution<br />
inside the cuvette use the small stir bar in the accessory box.<br />
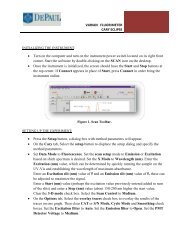
DATA COLLECTION:<br />
• If running a baseline, insert a blank solvent cuvette in both the reference (rear) and<br />
sample (front) cell holders. Press the Zero button, then the Baseline button to run the<br />
baseline. Upon completion of the scan, press the autoscale Y button (_) to see the<br />
baseline. A red baseline should appear in the number box at the upper left corner of the<br />
screen, indicating a valid baseline is in memory.<br />
• Place your sample in the sample cell holder and press the Start button. You will be asked<br />
for a sample name (other than the file name), then the spectrum will start running. Again,<br />
autoscale the spectrum if it goes offscale. Once the run is completed, a save file box will<br />
be presented to allow naming the file. Any peak information will be printed in the report<br />
box (the bottom half underneath the plot).<br />
• Text can be added to the plot by pressing the A button. When running multiple scans in<br />
one session, pressing the traces button (the farthest left button in the toolbar) to select<br />
2