Varian UV-Vis Spectrometer Cary 50
Varian UV-Vis Spectrometer Cary 50
Varian UV-Vis Spectrometer Cary 50

Create successful ePaper yourself
Turn your PDF publications into a flip-book with our unique Google optimized e-Paper software.
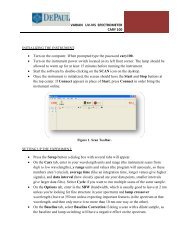
VARIAN <strong>UV</strong>‐VIS SPECTROMETER<br />
CARY <strong>50</strong><br />
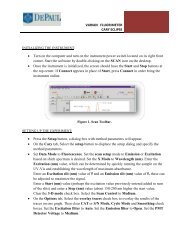
INITIALIZING THE INSTRUMENT:<br />
• Turn on the computer. When prompted type the password cary<strong>50</strong>.<br />
• Turn on the instrument power switch located on its left front corner. The lamp should be<br />
allowed to warm up for at least 15 minutes before running the instrument.<br />
• Start the software by double-clicking on the SCAN icon on the desktop.<br />
• Once the instrument is initialized, the screen should have the Start and Stop buttons at<br />
the top center. If Connect appears in place of Start, press Connect in order bring the<br />
instrument online.<br />
SETTING UP THE EXPERIMENT:<br />
Figure 1. Scan Toolbar.<br />
• Press the Setup button a dialog box with several tabs will appear.<br />
• On the <strong>Cary</strong> tab, enter in your wavelength units and range (the instrument scans from<br />
high to low wavelengths), y range units and values (the program will autoscale, so these<br />
numbers aren’t crucial), average time (like an integration time, longer values give higher<br />
signals), and data interval (how closely spaced are your data points, smaller intervals<br />
give larger data files). Select Cycle if you want to run multiple scans of the same sample.<br />
• On the Options tab, enter in the SBW (bandwidth, which is usually good to leave at 2 nm<br />
unless you're looking for fine structure in your spectrum) and lamp crossover<br />
wavelength (leave at 3<strong>50</strong> nm unless expecting important features in the spectrum at that<br />
wavelength, and then only move it no more than 10 nm one way or the other).<br />
• On the Baseline tab, select Baseline Correction if doing a scan with a dilute sample, as<br />
the baseline and lamp switching will have a negative effect on the spectrum.
• On the Reports tab, enter Operator Name. To automatically label peaks on the<br />
spectrum, select Maximum Peak or All Peaks options. The peak threshold limit and<br />
labeling options are altered by pressing the Peak Information button.<br />
• On the Auto Storage tab, select whether to save the scans before or after a run. Selecting<br />
after the run (not the default choice) will avoid saving bad data.<br />
Figure 2. Set up Dialog Box.<br />
PELTIER TEMPERATURE CONTROL:<br />
• The single cell temperature control accessory is controlled directly from the peltier<br />
keypad. In order to set up the desired temperature simply set the temperature, make sure<br />
the correct window is installed and the water pump turned on. In order to stir the solution<br />
inside the cuvette use the small stir bar in the accessory box.<br />
DATA COLLECTION:<br />
• If running a baseline, insert a blank solvent cuvette in both the reference (rear) and<br />
sample (front) cell holders. Press the Zero button, then the Baseline button to run the<br />
baseline. Upon completion of the scan, press the autoscale Y button (_) to see the<br />
baseline. A red baseline should appear in the number box at the upper left corner of the<br />
screen, indicating a valid baseline is in memory.<br />
• Place your sample in the sample cell holder and press the Start button. You will be asked<br />
for a sample name (other than the file name), then the spectrum will start running. Again,<br />
autoscale the spectrum if it goes offscale. Once the run is completed, a save file box will<br />
be presented to allow naming the file. Any peak information will be printed in the report<br />
box (the bottom half underneath the plot).<br />
• Text can be added to the plot by pressing the A button. When running multiple scans in<br />
one session, pressing the traces button (the farthest left button in the toolbar) to select<br />
2
individual data sets can be selected and made visible in the current plot. Please note that<br />
all data plots (including any baselines) are still accessible through the ‘Graph’ menu, and<br />
all will be printed out when printing the data. In order to omit any data set, right click on<br />
the graph with that data and select Remove Graph.<br />
Figure 3. Right Click Menu.<br />
• In order to manually mark a certain point on a spectrum, right click at that point and<br />
select Print x-y Point. The coordinates will be printed in the report window. Text can be<br />
added or changed in the report window by selecting Edit Report on the Edit menu and<br />
manipulating the text as needed. Double clicking on the report window will allow to<br />
expand it to full size.<br />
• To save the session as-is, including the report window contents and alterations made to<br />
the scans, select Save Data As… from the File menu and enter the name for the batch<br />
file. In order to export some of the data for use in other programs, click on the graph of<br />
that data, select Save Data As…from the File menu, and select Spreadsheet ascii<br />
(*.CSV) from the Save Files As box.<br />
3<br />
Figure 4. Peak Labels.
MICROPLATE READER:<br />
• A fiber optic coupler is available and allows connection of a fiber optic probe to the<br />
microplate reader.<br />
• The sample holder must be switched and the fiber optic cable connected.<br />
• Open the microplate reader and proceed to mark the individual cells in the clear bottom<br />
plate used as standards, samples, controls etc.<br />
• Proceed to set up the experiment and collect data in the same fashion as Scan software.<br />
Figure 5. Microplate Reader.<br />
SHUT OFF:<br />
• Close the SCAN software.<br />
• Make sure cuvette holders are empty and any spills are cleaned up. Turn off the<br />
instrument and the computer.<br />
4