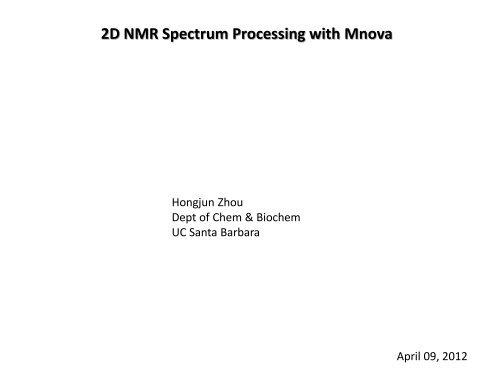
2D NMR Spectrum Processing with Mnova - UCSB Chem and ...
2D NMR Spectrum Processing with Mnova - UCSB Chem and ...
2D NMR Spectrum Processing with Mnova - UCSB Chem and ...

You also want an ePaper? Increase the reach of your titles
YUMPU automatically turns print PDFs into web optimized ePapers that Google loves.
<strong>2D</strong> <strong>NMR</strong> <strong>Spectrum</strong> <strong>Processing</strong> <strong>with</strong> <strong>Mnova</strong><br />
Hongjun Zhou<br />
Dept of <strong>Chem</strong> & Biochem<br />
UC Santa Barbara<br />
April 09, 2012
General <strong>NMR</strong> Data <strong>Processing</strong><br />
<strong>NMR</strong> data processing is typically done in the following order:<br />
• Read in raw FID<br />
• Select <strong>and</strong> apply apodization or window function<br />
• Zero fill (ZF) the FID, usually at least doubling the original data size<br />
• Fourier transform (FT)<br />
• Phase spectrum<br />
• Baseline correction<br />
Some of these are done automatically by <strong>Mnova</strong> when data are read in.<br />
NOTE:<br />
• Phasing means, in most cases, to adjust the spectrum so that peaks across the<br />
spectrum are in-phase (absorptive mode) where all peaks point up (or down)<br />
<strong>with</strong> the peak bases look even on both sides.<br />
• Zero-order phase (PH0) is a constant phase across the spectrum <strong>and</strong> is applied<br />
first. Next, set a pivot point for 1 st -order phase (PH1) adjustment. The pivot<br />
should be ideally set to a strong peak on one end of the spectrum. Apply 1 st -<br />
order phase which linearly changes across the spectrum from the “pivot” point.<br />
• Baseline correction should be applied AFTER phasing. If a small phase<br />
adjustment is still needed after baseline correction, adjust the phases after<br />
baseline correction.
<strong>2D</strong> <strong>NMR</strong> <strong>Spectrum</strong> <strong>Processing</strong> <strong>with</strong> <strong>Mnova</strong><br />
The two dimensions in a <strong>2D</strong> spectrum is specified as t2 or f2 (horizontal) <strong>and</strong> t1 or f1<br />
(vertical) dimensions, respectively. t1 <strong>and</strong> t2 refer to the time-domain data; f1 <strong>and</strong> f2<br />
refer to the frequency domain data after FT of t1 <strong>and</strong> t2 dimensions. The processing<br />
comm<strong>and</strong> below is often applied to f2 <strong>and</strong> f1 (or t2 <strong>and</strong> t1) separately. Select either f2<br />
or f1 from the top menu buttons before applying the processing comm<strong>and</strong>.<br />
<strong>2D</strong> spectrum should be processed in the following order:<br />
1. Open *.fid data<br />
2. Select appropriate window functions for t2 <strong>and</strong> t1 under <strong>Processing</strong>->Apodization<br />
3. Decide whether the spectra need phase adjustment<br />
1. For all absolute-value (or magnitude) mode spectra, such as typical COSY <strong>and</strong><br />
HMBC, DO NOT apply phase correction.<br />
2. For phase-sensitive spectra, such as typical HSQC/HMQC/NOESY etc., phase<br />
both f2 <strong>and</strong> f1 dimensions. Apply both zero-order (ph0) <strong>and</strong> 1 st -order (ph1)<br />
phases if necessary.<br />
4. Apply baseline correction to f2 <strong>and</strong> f1 dimensions.<br />
5. Play <strong>with</strong> other optional processing tricks such as t1 noise reduction or<br />
symmetrization, etc. Be cautious that these routines may introduce artifacts or<br />
reduce signal/noise. Always compare results <strong>with</strong> those from simple processing.
When 1 st -Order Phase Is Needed<br />
Two spectra after zero-order phase correction<br />
1 st -order phase is NOT needed 1 st -order phase is needed.<br />
Note the linear change in phase from<br />
left to right.
<strong>2D</strong> <strong>Processing</strong> Adjustment in <strong>Mnova</strong><br />
Select appropriate apodization window function<br />
Select Sine-0 or Sine-Sq-0<br />
for magnitude-mode COSY<br />
or HMBC<br />
Select Sine-90 or Sine-Sq-90 for<br />
phase-sensitive HSQC, NOESY,<br />
etc.<br />
Is spectrum in absolute-value (or magnitude) mode<br />
Yes<br />
(COSY, HMBC, etc.)<br />
No<br />
Phasing both f2 <strong>and</strong> f1 dimensions<br />
Apply zero- <strong>and</strong> 1 st -order phase correction<br />
Apply baseline correction to f2 <strong>and</strong> f1 dimensions<br />
(Use 2nd- or 3 rd -order polynomial in most cases)<br />
Optional (May introduce artifacts)<br />
• Try <strong>Processing</strong>→Reduce t1 noise (Effective at removing vertical stripes)<br />
• Try <strong>Processing</strong>→Symmetrize→COSY-like (Apply to COSY & NOESY only.<br />
Watch out for artifacts)
Magnitude-mode COSY <strong>Processing</strong><br />
NOTE: No phase correction should be applied.<br />
Check apodization/window function along f2 <strong>and</strong> f1 to select Sine 0.0 or Sine Square 0.0<br />
(<strong>Processing</strong>→Apodization …)<br />
Apply baseline correction to f2 <strong>and</strong> f1 dimensions<br />
(Use 2- or 3-order polynomial)<br />
Optional<br />
• Try <strong>Processing</strong>→Reduce t1 noise (Effective at removing vertical stripes)<br />
• Try <strong>Processing</strong>→Symmetrize→COSY-like (Watch out for artifacts)
gCOSY: Initial look after automatic processing<br />
• Vertical stripes are called t1 noise
Check <strong>and</strong> set <strong>Processing</strong>→apodization function to Sine Square 0.0 along t2 <strong>and</strong> t1
Apply baseline correction along f1 (vertical)
Raise the intensity threshold <strong>with</strong> mouse scroll
Turn on <strong>Processing</strong>→Reduce t1 noise. In this case, the<br />
improvement is significant, but be cautious <strong>with</strong> artifacts. To turn<br />
off t1 noise correction, toggle off <strong>Processing</strong>→Reduce t1 noise
Use View→Crosshair (or press C) to check symmetry of COSY crosspeaks<br />
Hold the left mouse button <strong>and</strong> drag to show a box
Select View→<strong>2D</strong> Plotting Method→Contour Plot or right mouse button click.<br />
Contour drawing on the fly is slower. Do this after data processing.
NOESY <strong>Processing</strong>: Initial look<br />
• Reference is wrong<br />
• Apodization/window function need to change
Referencing<br />
Set crosshair over the<br />
reference peak<br />
Click<br />
Change reference ppm<br />
for both f1 <strong>and</strong> f2
Select f1 or f2 from menu buttons <strong>and</strong> change <strong>Processing</strong>→Apodization to:<br />
Sine Square 90.0 along t2<br />
Sine Bell 90.0 along t1<br />
wrong
The <strong>2D</strong> peaks will look smoother <strong>and</strong> the baseline noise is less <strong>with</strong> the new<br />
window function
• Select manual phase correction<br />
• Select f2. Drag pivot line (vertical blue line) to line up <strong>with</strong> a strong peak on left<br />
• Adjust PH0 so that the selected peak is perfectly in phase<br />
• Adjust PH1 so that the peaks on right also come into phase
After PH0 adjustment along f2
After PH1 adjustment along f2
• For f1, select a peak near the bottom (or top) as the pivot<br />
• <strong>Spectrum</strong> after PH0 adjustment<br />
• PH1 seems OK. NO linear phase correction necessary.
• Lower threshold so that baseline defects are seen<br />
• Apply Polynomial baseline correction order 2 or 3 to f2 <strong>and</strong> f1 separately
After f2 baseline correction
After both f2 <strong>and</strong> f1 baseline correction
Additional processing<br />
• <strong>Processing</strong>→Symmetrize→COSY-like<br />
• <strong>Spectrum</strong> quality improves.<br />
NOTE:<br />
• Be careful <strong>with</strong> the “reduce t1<br />
noise” or symmetrization<br />
procedure. Artificial crosspeaks may<br />
be created in the process if the<br />
background noise is strong.
• For small molecules, NOEs mostly have opposite signs <strong>with</strong> the diagonal peaks.<br />
• Typical artifacts are:<br />
• dispersive peaks (<strong>with</strong> mixed up/down signals) that come from through-bond<br />
COSY-correlations. These are suppressed but not completely.<br />
• exchange crosspeaks having same sign <strong>with</strong> diagonal peaks<br />
Incomplete suppression of COSY-type peaks<br />
(peaks have both positive <strong>and</strong> negative signals)
These through-bond COSY-type peaks tend to cancel some or all through-space NOEs<br />
because they have opposite signs in some overlapping areas. Here, more COSY-type<br />
peaks are seen between the aromatic ring protons.
Exchange crosspeaks in NOESY are shown as in-phase peaks having the same<br />
sign as the diagonal peaks but opposite to NOESY crosspeaks. They can result<br />
from:<br />
• chemical exchange, such as exchange of 1 H in H 2 O <strong>with</strong> an amide 1 H.<br />
• exchange among multiple conformers where a 1 H has a distinct chemical shift<br />
in each conformer.<br />
Exchange crosspeaks