


You also want an ePaper? Increase the reach of your titles
YUMPU automatically turns print PDFs into web optimized ePapers that Google loves.
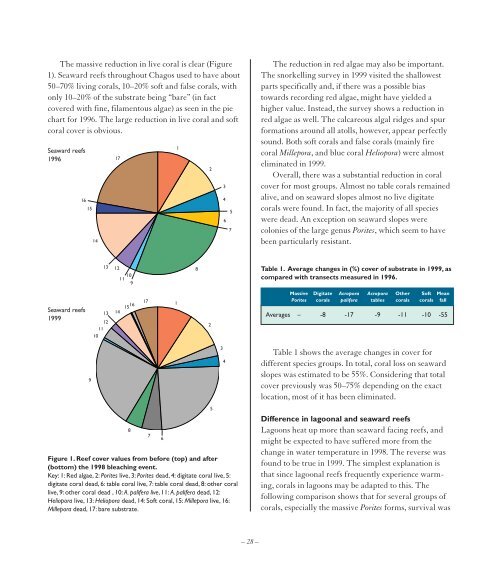
The massive reduction in live coral is clear (Figure<br />
1). Seaward reefs throughout Chagos used to have about<br />
50–70% living corals, 10–20% soft and false corals, with<br />
only 10–20% of the substrate being “bare’’ (in fact<br />
covered with fine, filamentous algae) as seen in the pie<br />
chart for 1996. The large reduction in live coral and soft<br />
coral cover is obvious.<br />
Seaward reefs<br />
1996<br />
16<br />
15<br />
14<br />
17<br />
1<br />
2<br />
3<br />
4<br />
6<br />
5<br />
7<br />
The reduction in red algae may also be important.<br />
The snorkelling survey in 1999 visited the shallowest<br />
parts specifically and, if there was a possible bias<br />
towards recording red algae, might have yielded a<br />
higher value. Instead, the survey shows a reduction in<br />
red algae as well. The calcareous algal ridges and spur<br />
formations around all atolls, however, appear perfectly<br />
sound. Both soft corals and false corals (mainly fire<br />
coral Millepora, and blue coral Heliopora) were almost<br />
eliminated in 1999.<br />
Overall, there was a substantial reduction in coral<br />
cover for most groups. Almost no table corals remained<br />
alive, and on seaward slopes almost no live digitate<br />
corals were found. In fact, the majority of all species<br />
were dead. An exception on seaward slopes were<br />
colonies of the large genus Porites, which seem to have<br />
been particularly resistant.<br />
13<br />
12<br />
10<br />
11<br />
9<br />
8<br />
Table 1. Average changes in (%) cover of substrate in 1999, as<br />
compared with transects measured in 1996.<br />
Seaward reefs<br />
1999<br />
12<br />
11<br />
10<br />
15<br />
16<br />
13 14<br />
17<br />
1<br />
2<br />
Massive Digitate Acropora Acropora Other Soft Mean<br />
Porites corals palifera tables corals corals fall<br />
Averages – -8 -17 -9 -11 -10 -55<br />
9<br />
8<br />
Figure 1. Reef cover values from before (top) and after<br />
(bottom) the 1998 bleaching event.<br />
Key: 1: Red algae, 2: Porites live, 3: Porites dead, 4: digitate coral live, 5:<br />
digitate coral dead, 6: table coral live, 7: table coral dead, 8: other coral<br />
live, 9: other coral dead , 10: A. palifera live, 11: A. palifera dead, 12:<br />
Heliopora live, 13: Heliopora dead, 14: Soft coral, 15: Millepora live, 16:<br />
Millepora dead, 17: bare substrate.<br />
7<br />
6<br />
5<br />
3<br />
4<br />
Table 1 shows the average changes in cover for<br />
different species groups. In total, coral loss on seaward<br />
slopes was estimated to be 55%. Considering that total<br />
cover previously was 50–75% depending on the exact<br />
location, most of it has been eliminated.<br />
Difference in lagoonal and seaward reefs<br />
Lagoons heat up more than seaward facing reefs, and<br />
might be expected to have suffered more from the<br />
change in water temperature in 1998. The reverse was<br />
found to be true in 1999. The simplest explanation is<br />
that since lagoonal reefs frequently experience warming,<br />
corals in lagoons may be adapted to this. The<br />
following comparison shows that for several groups of<br />
corals, especially the massive Porites forms, survival was<br />
– 28 –


