- Page 2:
! ! ! COASTAL OCEANS RESEARCH AND D
- Page 5 and 6:
COASTAL OCEANS RESEARCH AND DEVELOP
- Page 8 and 9:
' (")*$)*+' Foreword PART 1 - Regio
- Page 10 and 11:
The Lallie Didham Coral and Shell C
- Page 12 and 13:
! ! "#$%&#!'()(*+!$,-./(!0112! ! 3)
- Page 14 and 15:
,$)'-$.#+'/0*$#'12$.345)6'7'8"95)6'
- Page 16 and 17:
=">*4'/+5.'7'=>.#@' ' JERKER TAMELA
- Page 18 and 19:
emains patchy (Arthur 2008). Althou
- Page 20 and 21:
egions facing multiple stresses tha
- Page 22 and 23:
eports were identified as a crucial
- Page 24 and 25:
Climate Change Fourth Assessment Re
- Page 26 and 27:
Tamelander, J. and Hoon, V. (2008).
- Page 28 and 29:
)&..)'=$.'7'=>.#@' ' HANSA CHANSANG
- Page 30 and 31:
(Narumon 2008.) has compiled socioe
- Page 32 and 33:
(C:(HD=BC:'/:
- Page 34 and 35:
F.+*'/0#53.'.)&'B+2.)&+'7'=>.#@' '
- Page 36 and 37:
egions. Initially stopped in 1996 t
- Page 38 and 39:
!"#"$%&'(&)'*#+&,--(%&./&"0-&!$*./&
- Page 40 and 41:
8#F+-& HG& C*-/$;!($-$%(!6-$*@2,)*(
- Page 42 and 43:
coral cover over time (Fig. 3). Two
- Page 44:
Lee F. and Chou L. M. (1998). The A
- Page 47 and 48:
!9=&!:9!&70
- Page 49 and 50:
+1@75356=/1039=A
- Page 51 and 52:
*1E
- Page 53 and 54:
than 2m had been killed in Dutch Ba
- Page 55 and 56:
event and 2004 tsunami. In: Souter,
- Page 58 and 59:
!"#$%&'()*(+,,*(+,-$&,.(+,')/0%,( 1
- Page 60 and 61:
defence against waves provided by t
- Page 62 and 63:
=$L-,( H6!C+$*!($%0+3;&3-.%6!D$.$+*
- Page 64 and 65:
=$L-,(PI!*+3.$!%;$03$%!3($.&313$(!3
- Page 66 and 67:
H 2 S concentration in husk pit wat
- Page 68 and 69:
district alone, 90% of them being w
- Page 70 and 71:
of reefs remain healthy to support
- Page 72:
patterns of coral larval settlement
- Page 75 and 76:
'!!" !"#$"%&'$()"# &!" %!" $!" 5*61
- Page 77 and 78:
*(#+,'-,"+$./%0 #JI!! !.*%/-4+'-23-
- Page 79 and 80:
patterns of recruitment. Unraveling
- Page 81 and 82:
@5$*-&A!"#$%"&'"()*"+,-'"&'"#$..$/"
- Page 83 and 84:
fishing intensity can be observed.
- Page 85 and 86:
0D8E:;!& )'*#+&!"#"$%& Surveys were
- Page 87 and 88:
*+,-./*01 2+,3415 ! "# #! $# %!! &
- Page 89 and 90:
located very close to the mainland,
- Page 91 and 92:
Mahadevan S. and Nayar K.N., (1972)
- Page 93 and 94:
Acropora valida (Dana, 1846) * Acro
- Page 95 and 96:
Porites complanata Porites nodifera
- Page 97 and 98:
Oscillation (ENSO) event (Sheppard
- Page 99 and 100:
# * + ! !!"#$%&'$()*+,#-)./#0*1*0*%
- Page 101 and 102:
92:5.;2-7.5
- Page 103 and 104:
)*+.$6"F*'"& There is a general pau
- Page 105 and 106:
herbicides in coastal waters of the
- Page 107 and 108:
D4#"-&BC&>(0%#@+3%&#$'++A%)9$,0+/$-
- Page 109 and 110:
:#+4-&B=$!8+-%#0$"(F%-(-$7'(&&%,%7(
- Page 111 and 112:
i. ii. iv. iii. vi. vii. v. viii. x
- Page 113 and 114:
genus was Montipora (50% of live co
- Page 115 and 116:
seas of the Seychelles Bank in the
- Page 118 and 119:
!"#$%&'!()&*+',()-.'/"0")"1'' 2344+
- Page 120 and 121:
=(K%+'@A!8%-$'$:)!.#/!#)6.'$:)!.-;)
- Page 122 and 123:
their efforts were futile because f
- Page 124 and 125:
M=>C34.=IC10.17.I1>H3 X3346H3.7;P06
- Page 126:
the situation for the following gen
- Page 129 and 130:
estimated to be more than 5000 km (
- Page 131 and 132:
'A752#0!@#;H2)!%&!&%H+!)/12)!*%5L M
- Page 133 and 134:
8$F%(&I@&O22&!&/)-!M/%5#))!#1!5#+/0
- Page 135 and 136:
1,2342, 5,6
- Page 137 and 138:
8$F%(&LE!:H55#+N!%&!+22&!&/)-!%M)2+
- Page 139 and 140:
Comparison of coral reef criteria m
- Page 141 and 142:
McClanahan, T.R. and Shafir, S.H. (
- Page 143 and 144:
eing used to establish fish movemen
- Page 145 and 146:
eing more resilient as they are nom
- Page 147 and 148:
112
- Page 149 and 150:
communities on reefs subsequently e
- Page 151 and 152:
C$8,&'MN'"#$$%&'!&()#*+)!,-!.(/+012
- Page 153 and 154:
C$8,&'
- Page 155 and 156:
120
- Page 157 and 158:
(Davidson et al., 2006). It is boun
- Page 159 and 160:
D4%*(+IE+L2.%+,$;"%$))&*'03+!" asso
- Page 161 and 162:
D4%*(+L!"J26*2)$6"5)&2%"&'"*+,"4&.,
- Page 163 and 164:
Island, Mozambique, Marine Ecologic
- Page 165 and 166:
=23G#(*BC!"#$!%&'()&*+(&,-!,.!/,)01
- Page 167 and 168:
4%H-(*FC*&'#!)$/,)%&-3!($2710($!.,)
- Page 169 and 170:
larval source reefs, which could be
- Page 171 and 172:
4%H-(* JP* "#$!2,%&.&$%!H$$.!*$-(#,
- Page 173 and 174:
temporal Variation in Seawater Temp
- Page 175 and 176:
-(A.%$*BC!"#$!%&!'()!*)+'),-!.-/0#-
- Page 177 and 178:
8&F#$*EC!I%,#=!+$)20)+!/0C),+0'6!&%
- Page 179 and 180:
8&F#$*GC*Q#2'%,+!2%-',085'0-4!'%!'(
- Page 181 and 182:
intercepts. The island and Kenya si
- Page 183 and 184:
148
- Page 185 and 186:
150
- Page 187 and 188:
4+>'/2%"!!#$%!&'()*+,!&-./01!&*20&!
- Page 189 and 190:
)! (! '! &! %! $! #! "! ! *+,-./012
- Page 191 and 192:
!""#$#%&'$(%)*+&&$,-./$'+ 01 2 !""#
- Page 193 and 194:
&)M02% G"! #0$+! $B-+5$+40! >+("'$
- Page 195 and 196:
napoleon wrasse, is required to des
- Page 197 and 198:
@(;=' In response to worldwide degr
- Page 199 and 200:
transects, and at each 0.5 m interv
- Page 201 and 202:
A,,B*B31-*C397)11*.D6*-)E#5 #$!! #!
- Page 203 and 204:
dependency on fishing in these area
- Page 205 and 206:
Babcock, R.C. Kelly, S. Shears, N.T
- Page 207 and 208:
172
- Page 209 and 210: 1#:7.&B"!8,5%2!:$%0%!/%'5$,-!)22%22
- Page 211 and 212: @3A$*.& HI& F%'5$,-!-.6%0!)5!254(7!
- Page 213 and 214: 1#:7.&M>!25,*)5%(!0%%@!()*)=%!,'!H,
- Page 215 and 216: 1) showed an average coral cover 32
- Page 217 and 218: around 40%. Reefs in this area are
- Page 219 and 220: 184
- Page 221 and 222: 4 and 11 o S (Fig. 1). Forty-one is
- Page 223 and 224: coral reefs in the Indian Ocean in
- Page 225 and 226: C-A+3#' NE' ").(#+*.#0!1#R#-)>!#V!.
- Page 227 and 228: the Seychelles, containing 7 of the
- Page 229 and 230: ,-.% '(-( 7*.3-38* H9(3:8 1/9/00* )
- Page 231 and 232: ut minor elsewhere. These damages,
- Page 233 and 234: 198
- Page 235 and 236: 200
- Page 237 and 238: .61#$@!"#$%"&'"()*+,"(-).(!" Howeve
- Page 239 and 240: $ 3%8=B!8$ >.61#$ EF""/0.1$2."34()$
- Page 241 and 242: .61#$OF""Q.1H.5)$2."&'"H&1$>"$1.$"H
- Page 243 and 244: 5678947.:5( ,"#&!' +"#&!' *"#&!' )"
- Page 245 and 246: proportion of the total coral are a
- Page 247 and 248: 212
- Page 249 and 250: appeared to be males, releasing a c
- Page 251 and 252: D&'E,+(M"!0Q(%%*-+2!$-.!4)$B-*-+!95
- Page 253 and 254: :#4I+(LA!!>;(!%*,*-+!9( The 17 Acro
- Page 255 and 256: 8O5B@P2B>:!( ( This study was suppo
- Page 257 and 258: 222
- Page 259: critical for the survival of a cora
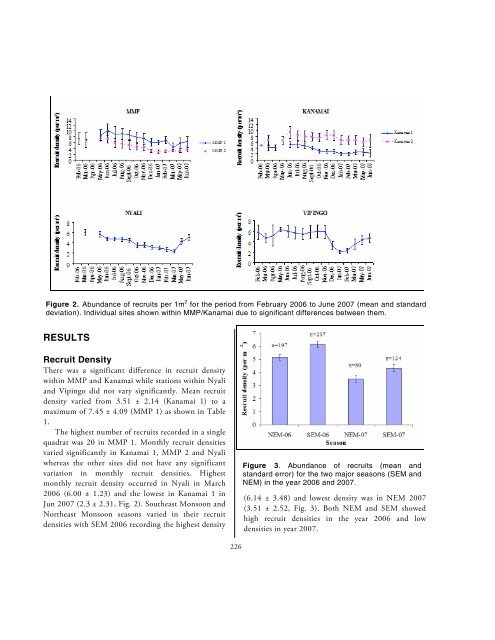
- Page 263 and 264: %@3.+'K5""P(#%(&*-*(+"(1"7.072*-&"%
- Page 265 and 266: '()*+,-)(. /-)(..012+(.3(2++ 4(,)-(
- Page 267 and 268: In conclusion, protection level and
- Page 269 and 270: 234
- Page 271 and 272: "#23,% AB!"#$%$&'#(!"%))*(#+&%$!,$#
- Page 273 and 274: :-02.(* ;
- Page 275 and 276: Although different zooxanthellae de
- Page 277 and 278: H(6I'$"/!""!"#$%$#&"#$%&%""'()*"+,-
- Page 279 and 280: 244
- Page 281 and 282: !&='#$(@.#$
- Page 283 and 284: 248
- Page 285 and 286: esilience of coral reef sites to cl
- Page 287 and 288: RESILIENCE FACTORS & INDICATORS a)
- Page 289 and 290: c) Cooling and flushing factors Cur
- Page 291 and 292: e) Shading and screening factors Co
- Page 293 and 294: g) Coral associates Obligate feeder
- Page 295 and 296: i) Anthropogenic factors Nutrient i
- Page 297 and 298: 262
- Page 299 and 300: Payet, 2005), problems in the regio
- Page 301 and 302: where these species are important c
- Page 303 and 304: hundreds to tens of thousands (Smit
- Page 305 and 306: @+I
- Page 307 and 308: (+&& ()&& BE21A$M9!N42$58N7 (&&& /&
- Page 309 and 310: De Young, C., (ed.) Review of the S
- Page 311 and 312:
Samoilys, M. A., Wells, S., Anderso
- Page 313 and 314:
the entire coral reef ecosystem is
- Page 315 and 316:
Thailand provided some evidence of
- Page 317 and 318:
282
- Page 319 and 320:
284
- Page 321 and 322:
informal discussion with key inform
- Page 323 and 324:
10 days, while higher operating eff
- Page 325 and 326:
more reef-associated fishes than us
- Page 327 and 328:
292
- Page 329 and 330:
(2A&#$ B"!#$%!&'!()$**+!+,-$./!$./!
- Page 331 and 332:
!*H,#$BI$B11'!'+,0"!:&9$-!.$61,!$./
- Page 333 and 334:
M U L S K @ J T > M 8$-$!$/+E$-!
- Page 335 and 336:
M"L M"K M"J M"> M "L "K "J "> M >
- Page 337 and 338:
!*H,#$MI$R1$3!,1-19*+F+*E"!X%19+1,!
- Page 339 and 340:
of only 13 species groups. It is no
- Page 341 and 342:
total collapse. Thus CPUE trends ov
- Page 343 and 344:
Arthur R, (2008). Patterns of benth
- Page 345 and 346:
8()K$%*L!"#$!%&!'()!*+#,+-.(#/)!0))
- Page 347 and 348:
8()K$%*BL!7,,8#/!#,5!2)#2%,#/!'0),5
- Page 349 and 350:
H&V3%* B6! .#'I(! $)0&%0#,I)! %&! &
- Page 351 and 352:
8()K$%*DL!!9)0I),'#4)!I%$%2+'+%,!%&
- Page 353 and 354:
the higher diversity reported here.
- Page 355 and 356:
Obura, D. (2001a). Participatory mo
- Page 357 and 358:
*&E,2)F!"#$%&$'("()*+",%)-"$'".&)"%
- Page 360 and 361:
-$(502)O!"I)12+.$'("@".2">A!" them
- Page 362 and 363:
showed declines in numbers of fishe
- Page 364 and 365:
*&E,2)P!"O%.$9*.)"23".2.*7"',9
- Page 366 and 367:
the lagoons are more exposed to oce
- Page 368 and 369:
e 5,890 fishers and 4,164 tonnes/yr
- Page 370 and 371:
!""#""$#%&'()'*+",#-)(./'0-12%+32&+
- Page 372 and 373:
D2G.#' KL' 32&+" 34=" 3'.-4>2+" -,"
- Page 374 and 375:
D2G.#'N5"G.-01"2&2$&.+:)1",&&"+(.0'
- Page 376 and 377:
!"#$"%$&'()"*+'*,( ") "' "% "# "! )
- Page 379 and 380:
344
- Page 381 and 382:
=63
- Page 383 and 384:
1. The Map Layers Window lists all
- Page 385 and 386:
detail for expert users. The issues
- Page 387 and 388:
352
- Page 389 and 390:
!"#$%&%!"'$(%)*+,+"#-.% /'0%1'+#2"%
- Page 391 and 392:
356
- Page 393 and 394:
gradually transformed from marine h
- Page 395 and 396:
8=4BC)!D!)!9B)ED=F-B8)) G#H/+*)IJ)!
- Page 397 and 398:
do not have qualifications to apply
- Page 399 and 400:
is around 5,000 baht (U$ 125), or 2
- Page 401 and 402:
='L(*)IJ)N"7,'4%$'%,427,)*+$,&-$%27
- Page 403 and 404:
training and workshops for small gr
- Page 405 and 406:
370
- Page 407 and 408:
Box 1: Principles for Identifying O
- Page 409 and 410:
-Needs a systematic approach that r
- Page 411 and 412:
!(E)#$HI$!"#$%&'(')*+,'-.%/%01')&/2
- Page 413 and 414:
Box 3: Key Stages in Supporting Liv
- Page 415 and 416:
contributed to their successes and
- Page 417 and 418:
$ $ 9&J$QK$B-.#',3(-.0-;$+(>3&',$3"
- Page 419 and 420:
6$S&'P0-;$C/@$6=='&(>"$ The SLED ap
- Page 421 and 422:
386
- Page 423 and 424:
growing populations that utilize th
- Page 425 and 426:
particularly valuable resources sup
- Page 427 and 428:
@/A6+#$IC!!.&'*#/01*21$3!2#3!#4!3%&
- Page 429 and 430:
successful because the products hav
- Page 431 and 432:
396
- Page 433 and 434:
et al., 2007). Many conservation pr
- Page 435 and 436:
8$GB)&HI&7$/1/"+/$+1,%"(/%)/1",1/"0
- Page 437 and 438:
C(/"1)&KI&V*.-")1,
- Page 439 and 440:
Aquatic protected areas as fisherie
- Page 441 and 442:
82.*%(BC!"!#$%!&'()*+,'-!&'-$*.&$/!
- Page 443 and 444:
408
- Page 445 and 446:
78.*%(
- Page 447 and 448:
I+J)4,' KL' !"#$ %&$ '()$ *+,%,-%./
- Page 449 and 450:
#5&,'ML'I+4)0+(%%-$"7'+4+'+)5$1)7%1
- Page 451 and 452:
much fewer households compared to f
- Page 453 and 454:
Malleret-King D, King A, Manghubhai
- Page 455 and 456:
evening respectively) during dry se
- Page 457 and 458:
'71.&# QP!)'#!$1!90%:'!6$',(!,-$.+%
- Page 459 and 460:
#;= #;< #;$ !;> !;= !;< !;$ # ! ##$
- Page 461 and 462:
2($&.#L(37$/# Conversion of wetland
- Page 463 and 464:
that nitrogen was well utilized in
- Page 465 and 466:
Boyd, C. E. (1990). Water quality i
- Page 467 and 468:
432
- Page 469 and 470:
434
- Page 471 and 472:
(*/&"'!"#$%"&%'%()*+%,-")."-%/0$1,2
- Page 473 and 474:
80% of the participants rating all
- Page 475 and 476:
obtained during our surveys of the
- Page 477 and 478:
In Kenya, the primary school curric
- Page 479 and 480:
A pre-seminar questionnaire is used
- Page 481 and 482:
446
- Page 483 and 484:
Sarah Ater CORDIO East Africa 9 Kib
- Page 485 and 486:
Andriamalala Gildas Blue Ventures M
- Page 487 and 488:
Alke Kruger Oceanographic Research
- Page 489 and 490:
William Nyaga CORDIO East Africa 9
- Page 491 and 492:
Nitiya Sangkhanan Environmental Sci


