Solar cosmic ray events for the period 1561
Solar cosmic ray events for the period 1561
Solar cosmic ray events for the period 1561

Create successful ePaper yourself
Turn your PDF publications into a flip-book with our unique Google optimized e-Paper software.
JOURNAL OF GEOPHYSICAL RESEARCH, VOL. 106, NO. A10, PAGES 21,599-21,609, OCTOBER 1, 2001<br />
<strong>Solar</strong> <strong>cosmic</strong> <strong>ray</strong> <strong>events</strong> <strong>for</strong> <strong>the</strong> <strong>period</strong> <strong>1561</strong>-1994<br />
2. The Gleissberg <strong>period</strong>icity<br />
K. G. McCracken<br />
Institute <strong>for</strong> Physical Science and Technology, University of Maryland, College Park, Maryland, USA<br />
G. A.M. Dreschhoff<br />
Department of Physics and Astronomy, University of Kansas, Lawrence, Kansas, USA<br />
D. F. Smart and M. A. Shea<br />
Air Force Research Laboratory, Space Vehicles Directorate, Hanscorn Air Force Base, Bed<strong>for</strong>d<br />
Massachusetts, USA<br />
Abstract. A total of 125 large fluence solar proton <strong>events</strong> identified from <strong>the</strong> nitrate<br />
deposition in ice core from Greenland <strong>for</strong> <strong>the</strong> <strong>period</strong> <strong>1561</strong>-1950 are examined in an<br />
exploratory study of <strong>the</strong> geophysical in<strong>for</strong>mation that will be available from such data in<br />
<strong>the</strong> future. These data have been augmented with ionospheric and satellite data <strong>for</strong> <strong>the</strong><br />
<strong>period</strong> 1950-1994. There were five <strong>period</strong>s in <strong>the</strong> vicinity of 1610, 1710, 1790, 1870, and<br />
1950, when large >30 MeV proton <strong>events</strong> with fluence greater than 2 x 109 cm -2 were<br />
up to 8 times more frequenthan in <strong>the</strong> era of satellite observation. There is a welldefined<br />
Gleissberg (approximately 80 year) <strong>period</strong>icity in <strong>the</strong> large fluence proton <strong>events</strong>,<br />
with six well-defined minima, two in close association with <strong>the</strong> Maunder and Dalton<br />
minima in sunspot number. The present "satellite" era is recognized as a recurrence of<br />
this series of minima. Comparison of <strong>the</strong> total solar proton production <strong>for</strong> <strong>the</strong> five<br />
Gleissberg cycle since 1580 shows that <strong>the</strong> cycle 1820-1910 was <strong>the</strong> most active followed<br />
by <strong>the</strong> cycle 1580-1660. The present Gleissberg cycle is one of <strong>the</strong> least effective i n <strong>the</strong><br />
production of solar proton <strong>events</strong> at Earth. It is shown that <strong>the</strong> solar and solar proton<br />
event data both indicate that <strong>the</strong> Maunder Minimum ended about 1700, 16 years be<strong>for</strong>e<br />
<strong>the</strong> commonly accepte date of 1716. It is proposed that <strong>the</strong> delayed "switch on" of<br />
aurorae after <strong>the</strong> Maunder Minimum is due to <strong>the</strong> changing nature of <strong>the</strong> solar corona<br />
from "Maunder Minimum" conditions to <strong>the</strong> more active conditions of <strong>the</strong> Gleissberg<br />
cycle, and a physical mechanism<br />
proposed in which variations in <strong>the</strong> coronal densities<br />
modulate <strong>the</strong> efficiency of solar proton event production throughou<strong>the</strong> Gleissberg cycle.<br />
The "streaming limited fluence" <strong>for</strong> >30 MeV protons is estimated to be 6-8 x 10⁹<br />
cm -2, and <strong>the</strong> rapid decrease in <strong>the</strong> probability of occurrence of solar proton <strong>events</strong><br />
observed in <strong>the</strong> vicinity of this fluence is proposed to be due to this effect.<br />
1. Introduction<br />
2. Occurrence of Large <strong>Solar</strong> Proton Events<br />
in <strong>the</strong> Interval <strong>1561</strong>-1994<br />
In a companion paper, McCracken et al. [this issue] show<br />
that <strong>the</strong> impulsive nitrate <strong>events</strong> observed in polar ice cores As described in sections 4 and 5 of McCracken et al. [this<br />
[Dreschhoff and Zeller, 1990; Zeller and Dreschhoff, 1995] are issue], <strong>the</strong>re were 156 impulsive nitrate <strong>events</strong> (>27 ng g-X)<br />
identified in <strong>the</strong> Greenland ice core between <strong>1561</strong> and 1950.<br />
<strong>the</strong> consequence of <strong>the</strong> occurrence of large fluence solar proton<br />
<strong>events</strong> (SPEs) at Earth. Using this technique, solar proton (The quantity ng g- x is used to quantify <strong>the</strong> nitrate deposition.<br />
This is a measure of <strong>the</strong> total nitrate concentration that would<br />
<strong>events</strong> can be usually dated to within +2 months <strong>for</strong> <strong>the</strong> <strong>period</strong><br />
have been observed if all <strong>the</strong> nitrate in that event had been<br />
<strong>1561</strong>-1950, and McCracken et al. [this issue] have detailed <strong>the</strong><br />
computations-that allow an estimate of <strong>the</strong> >30 MeV fluences precipitated into a single sample.) Figure 1 displays <strong>the</strong> occur<strong>for</strong><br />
<strong>the</strong> 125 impulsive nitrate <strong>events</strong> with fluences >1.0 x 10⁹<br />
rence of solar proton <strong>events</strong> between <strong>1561</strong> and 1994. These<br />
<strong>events</strong> all have a >30 MeV omnidirectional fluence above<br />
cm -2 in that interval. In this second paper <strong>the</strong>se impulsive<br />
1.0 x 109 cm -2. Events from <strong>1561</strong> to 1950 have been derived<br />
nitrate <strong>events</strong> toge<strong>the</strong>r with satellite and o<strong>the</strong>r data <strong>for</strong> <strong>the</strong><br />
<strong>period</strong> 1950-1994 are used to study <strong>the</strong> manner in which SPEs<br />
from <strong>the</strong> Greenland ice core data; <strong>events</strong> after 1950 are from<br />
have varied with time over <strong>the</strong> <strong>period</strong> <strong>1561</strong>-1994.<br />
ground level and satellite data [Shea and Smart, 1990, 1994].<br />
After allowance <strong>for</strong> <strong>the</strong> density of <strong>the</strong> ice core, 31 of <strong>the</strong> 156<br />
nitrate <strong>events</strong> identified by McCracken et al. [this issue] fell<br />
below <strong>the</strong> >30 MeV fluence cutoff of 1.0 x 109 cm -2, leaving<br />
Copyright 2001 by <strong>the</strong> American Geophysical Union.<br />
<strong>the</strong> 125 <strong>events</strong> that are used throughouthis companion paper.<br />
Paper number 2000JA000238.<br />
To fur<strong>the</strong>r quantify <strong>the</strong> occurrence of solar proton <strong>events</strong>,<br />
0148-0227/01/2000JA000238509.00<br />
Table 1 lists <strong>the</strong> observed Schwabe (11 year) cycles agains<strong>the</strong><br />
21,599
ß<br />
=l<br />
.<br />
21,600 MCCRACKEN ET AL.: SOLAR COSMIC RAY GLEISSBERG PERIODICITY<br />
200<br />
z<br />
m 15o<br />
- lO0<br />
I ......... i ......... i ......... i ......... i .........<br />
- ,<br />
uJ 50<br />
e •24<br />
0<br />
" ........ ' ...... •$%'Deiec•ti0h'<br />
EfficJeni:9 .... ' ..... li<br />
Gleissberg<br />
Minima<br />
1 500 1 600 1 700 1 800 1 900 2000<br />
YEAR<br />
Figure 1. The times of occurrence of >30 MeV solar proton <strong>events</strong> with fluencexceeding 1.0 x 109 cm -2<br />
as derived.from <strong>the</strong> nitrate data (<strong>1561</strong>-1950) and from ionospheric and satellite data since 1950. The times<br />
assigned to <strong>the</strong> minima of <strong>the</strong> Gleissberg cycle are shown by <strong>the</strong> triangular markers. The annual international<br />
sunspot numbers are given in <strong>the</strong> top panel.<br />
number of SPEs identified from <strong>the</strong> nitrate data <strong>for</strong> <strong>the</strong> 35<br />
Schwabe cycles from 1567-1954. (This paper uses several<br />
terms to identify various solar cycles as follows: Schwabe cycle,<br />
<strong>the</strong> -11-year <strong>period</strong>icity in sunspots [Schwabe, 1844; Waldmeier,<br />
1961]; Hale cycle, two consecutive 11-year sunspot cycles<br />
constituting <strong>the</strong> <strong>period</strong> in which <strong>the</strong> magnetic polarity of<br />
bipolar sunspots complete a cycle of change [Hale, 1908; Hale<br />
and Nicholson, 1925]; Gleissberg cycle, originally, <strong>the</strong> maximum<br />
sunspot number amplitude modulation having a <strong>period</strong><br />
between 80-100 years in length. The current usage is any<br />
solar-terrestrial phenomena having a modulation <strong>period</strong> of<br />
-80-100 years [Gleissberg, 1958, 1965, 1966].) The minima of<br />
<strong>the</strong> solar cycles from 1611 to <strong>the</strong> present are from McKinnon<br />
[1987]; minima prior to 1611 have been assumed to be in 1567,<br />
1578, 1589, and 1600. Two <strong>events</strong> from Table 1 of McCracken<br />
et al. [this issue] occurred prior to 1567 and are not included in<br />
Table 1.<br />
It is important to recall that <strong>the</strong> data in Figure 1, Table 1,<br />
and elsewhere in this paper are from <strong>the</strong> Greenland ice core<br />
only. In addition, <strong>the</strong>re is a variability in <strong>the</strong> conversion factor<br />
from nitrate to fluence which is poorly quantified at this time<br />
(see section 8 of McCracken et al. [this issue]). For example,<br />
<strong>the</strong> known precipitation processes indicate that <strong>the</strong> fluence of<br />
SPEs occurring in <strong>the</strong> nor<strong>the</strong>rn summer may be underestimated<br />
or even missing. Thus <strong>the</strong> event of July 25, 1946, probably<br />
<strong>the</strong> largest fluence event in <strong>the</strong> "instrumental" <strong>cosmic</strong> <strong>ray</strong><br />
Table 1. Distribution of <strong>the</strong> Large <strong>Solar</strong> Proton Events<br />
(>30 MeV Fluence >2.0 x 109 cm -2) Observed During<br />
Schwabe (11 Year) <strong>Solar</strong> Sunspot Cycles<br />
SPE per Cycle<br />
0 1 2 3 4 5 6<br />
Number of cycles 7 6 11 7 2 1 1<br />
Normalized frequency 0 1.3 2.7 4 5.3 6.7 8<br />
era, is missing from Figure 1 even though <strong>the</strong> nitrate deposition<br />
from this event is large in <strong>the</strong> Antarctic ice core as illustrated<br />
in Figure 4b of McCracken et al. [this issue].<br />
The detection efficiency bar in <strong>the</strong> middle of Figure 1 should<br />
be noted. Since about 1950, satellite and o<strong>the</strong>r ground-based<br />
detectors have provided 100% detection efficiency; however,<br />
prior to about 1950 <strong>the</strong> detection sensitivity is less. In addition,<br />
as discussed in <strong>the</strong> previous paragraph, we are using only <strong>the</strong><br />
Greenland ice core <strong>for</strong> this analysis. We estimate <strong>the</strong> detection<br />
efficiency prior to 1950 to be -75%, and thus <strong>the</strong> Greenland<br />
data underestimate SPE occurrence by a factor of about 1.33.<br />
Whenever we have made comparisons over <strong>the</strong> entire interval<br />
<strong>1561</strong>-1994, <strong>the</strong> SPE frequencies derived from <strong>the</strong> Greenland<br />
data have been increased by this factor to normalize <strong>the</strong> data<br />
to <strong>the</strong> present era. None of <strong>the</strong> conclusions of this paper are<br />
critically dependent upon <strong>the</strong> value of this normalization factor<br />
within <strong>the</strong> range 1.0-2.0. The normalized frequency per<br />
Schwabe cycle is given in Table 1.<br />
In addition to <strong>the</strong> seasonal variation in conversion factor, <strong>the</strong><br />
experimental errors discussed in connection with Table 2 of<br />
McCracken et al. [this issue] mean that <strong>the</strong> average conversion<br />
factor may have an uncertainty up to _+50%. However, <strong>the</strong><br />
uncertainties in <strong>the</strong> conversion factor from nitrate deposition<br />
to fluence will be identical <strong>for</strong> <strong>the</strong> whole <strong>period</strong> <strong>1561</strong>-1950, and<br />
all conclusions regarding <strong>the</strong> time and fluence dependence of<br />
solar proton <strong>events</strong> <strong>for</strong> that <strong>period</strong> will be unaffected by <strong>the</strong>se<br />
errors. While <strong>the</strong>re may be a discontinuity in <strong>the</strong> accuracy of<br />
<strong>the</strong> fluence estimates in <strong>the</strong> vicinity of 1970, as detailed in<br />
section 1 of McCracken et al. [this issue], <strong>the</strong> conclusions in this<br />
paper have been tested and shown to be unaffected by <strong>the</strong><br />
degree of error involved.<br />
Figure 2 displays <strong>the</strong> two-cycle running average of <strong>the</strong> number<br />
of large fluence solar proton <strong>events</strong> and <strong>the</strong> two-cycle<br />
running average of <strong>the</strong> maximum value of <strong>the</strong> annual sunspot<br />
number <strong>for</strong> each Schwabe (11 year) sunspot cycle. The starting<br />
and end dates <strong>for</strong> each Schwabe sunspot cycle, as well as <strong>the</strong><br />
estimates of <strong>the</strong> maximum sunspot numbers prior to 1700, are
MCCRACKEN ET AL.: SOLAR COSMIC RAY GLEISSBERG PERIODICITY 21,601<br />
o<br />
'o<br />
o<br />
uJ<br />
-4o<br />
-30<br />
-20<br />
-10<br />
0<br />
10<br />
20<br />
8<br />
Gleissberg<br />
l<br />
Minima<br />
fluence solar proton <strong>events</strong> has varied strongly with time since<br />
<strong>1561</strong> from zero <strong>for</strong> two separate Hale <strong>period</strong>s of 22 years<br />
(centered on 1744 and 1833) up to five and six per Hale cycle<br />
(centered on 1889 and 1611, respectively). Table 1 indicates<br />
that <strong>the</strong> individual Schwabe cycles may have higher normalized<br />
frequencies, ranging from 0 to 8. For example, after normalization,<br />
we estimate that <strong>the</strong>re were eight large solar proton<br />
<strong>events</strong> <strong>for</strong> <strong>the</strong> Schwabe cycle that peaked about 1605 and seven<br />
large <strong>events</strong> <strong>for</strong> cycle 13 which peaked about 1893 [McKinnon,<br />
1987]. For <strong>the</strong> <strong>period</strong> 1650-1699 in <strong>the</strong> Maunder Minimum <strong>the</strong><br />
normalized frequency of <strong>events</strong> (>30 MeV fluence >2.0 x 10⁹<br />
cm -2) is 0.6 event per Schwabe cycle. Thus <strong>the</strong> event frequency<br />
<strong>for</strong> <strong>the</strong>se large fluence SPEs averaged over <strong>period</strong>s of approximately<br />
two decades varies by a factor of 10 or more over <strong>the</strong><br />
interval <strong>1561</strong>-1994.<br />
Referring again to Figure 2, we find that <strong>the</strong> normalized<br />
frequency of large SPEs in <strong>the</strong> "satellite measurement era"<br />
(Schwabe cycles 20-22, 1964-1996) averaged about one event<br />
per Schwabe cycle. This is to be compared with normalized<br />
frequencies of 6-8 SPEs per Schwabe cycle in <strong>the</strong> vicinity of<br />
1605 and 1893 as noted above and in Table 1.<br />
n<br />
(r)<br />
z<br />
(r)<br />
200<br />
150<br />
100<br />
1<br />
0<br />
5O<br />
o<br />
1500 1600 1700 1800 1900 2000<br />
YEAR<br />
Figure 2. The frequency of occurrence of solar proton <strong>events</strong><br />
and <strong>the</strong> maximum annual sunspot number <strong>for</strong> <strong>the</strong> <strong>period</strong> <strong>1561</strong>-<br />
1994. The data are averaged by a two solar cycle running<br />
means. Prior to 1950 <strong>the</strong> detection efficiency (<strong>for</strong> data from <strong>the</strong><br />
nor<strong>the</strong>rn polar cap) is taken to be 75%, and <strong>the</strong> data displayed<br />
are normalized by multiplication by 1.33. The data after 1950<br />
have equal sensitivity throughou<strong>the</strong> year, and no adjustment<br />
has been necessary. The times assigned to <strong>the</strong> minima of <strong>the</strong><br />
Gleissberg cycle in Figure 1 are shown by <strong>the</strong> arrows. The •4C<br />
production rates as computed by Stuiver and Quay [1980] are<br />
relative to <strong>the</strong> average <strong>for</strong> <strong>the</strong> <strong>period</strong>.<br />
those given by Eddy [1976]. For this figure we have selected<br />
only those solar proton <strong>events</strong> having a >30 MeV fluence<br />
>2 X 10 9 cm -2. We have excluded <strong>events</strong> with fluence 30 MeV fluence of<br />
2 x 109 cm -2) exhibits a very clear Gleissberg <strong>period</strong>icity.<br />
There are five well-defined maxima in <strong>the</strong> vicinity of 1610,<br />
1710, 1790, 1870, and 1950 with an average repetition <strong>period</strong> of<br />
about 85 years. The lower graph in Figure 1 also indicates that<br />
<strong>the</strong> Gleissberg <strong>period</strong>icity is also evident <strong>for</strong> solar proton<br />
<strong>events</strong> having a fluence > 1 x 109 cm -2 above 30 MeV.<br />
Referring to Figures 1 and 2, note <strong>the</strong> clearly defined minima<br />
of <strong>the</strong> Gleissberg <strong>period</strong>icity in <strong>the</strong> solar proton event data<br />
(<strong>the</strong> small phase lags between <strong>the</strong> data are discussed in section<br />
5). Two of <strong>the</strong> minima are closely associated in time with <strong>the</strong><br />
well-known Maunder (1645-1700) and Dalton (1810-1830)<br />
Minima of <strong>the</strong> sunspot number. Four o<strong>the</strong>r minima near 1560-<br />
1580, 1750, 1910, and <strong>the</strong> vicinity of 1980 appear to be members<br />
of <strong>the</strong> same approximately 80- to 85-year sequence. Thus<br />
<strong>the</strong> satellite era of observations has coincided with a recur-<br />
rence of this persistent series of minima in solar proton event<br />
frequency.<br />
Satellite measurements have shown that <strong>the</strong>re are --•80 significant<br />
solar proton <strong>events</strong> per Schwabe cycle [Shea and<br />
Smart, 1999], while less than eight large fluence <strong>events</strong> are seen<br />
in <strong>the</strong> nitrate record per cycle. (Shea and Smart [1999] used <strong>the</strong><br />
criterion <strong>for</strong> significant <strong>events</strong> as any individual event with a
21,602 MCCRACKEN ET AL.: SOLAR COSMIC RAY GLEISSBERG PERIODICITY<br />
Table 2. Estimates of <strong>the</strong> Total Fluence of Protons >30 MeV <strong>for</strong> <strong>the</strong> Five Gleissberg Cycles, 1580-1985 a<br />
Gleissberg Average Number Fluence of Five Estimated Fluence Ranking<br />
Cycle SSN of SPE Largest SPE (Whole Cycle) (by Fluence)<br />
1580-1660 unknown 2! 31.6 X 10⁹ 35.9 X 10⁹ 2<br />
1660-1750 58.4 8 27.4 X 10⁹ 31.2 X 10⁹ 3<br />
1750-1830 95.3 10 25.7 X 10⁹ 29.2 X 10⁹ 5<br />
1830-1910 97.8 19 54.9 X 10⁹ 62.4 X 10⁹ 1<br />
1910-19857 128.4 10 26.7 X 10⁹ 30.3 • 109 4<br />
aAbbreviations SSN, sunspot number; SPE, solar proton event.<br />
>10 MeV flux equal to or greater than 10 protons cm -2 s -1 years. The sunspot data are so sketchy that it has been previster-•.)<br />
We now investigate <strong>the</strong> use of <strong>the</strong> relatively few SPEs ously impossible to use <strong>the</strong>m to make quantitative comparisons<br />
seen in <strong>the</strong> nitrate record to characterize <strong>the</strong> whole of <strong>the</strong> SPE<br />
cumulative normalized probabilities <strong>for</strong> each Schwabe cycle.<br />
Using <strong>the</strong> tabulations of Shea and Smart [1990, 1994] and<br />
Smart and Shea [1997], we <strong>for</strong>m <strong>the</strong> ratio between <strong>the</strong> total<br />
between <strong>the</strong> solar activity prior to 1700 and that of <strong>the</strong> wellinstrumented<br />
20th century. The solar proton data derived from<br />
<strong>the</strong> nitrate deposition in polar ice provide <strong>the</strong> first quantitative<br />
measurement of <strong>the</strong> solar activity in <strong>the</strong> vicinity of 1600, and we<br />
fluence <strong>for</strong> all <strong>the</strong> significant solar proton <strong>events</strong> in a Schwabe conclude that <strong>the</strong> Sun was as active <strong>the</strong>n as in <strong>the</strong> 19th and 20th<br />
cycle, and <strong>the</strong> sum of <strong>the</strong> fluences of <strong>the</strong> five largest solar<br />
proton <strong>events</strong>. (To determine <strong>the</strong> fluence <strong>for</strong> each of <strong>the</strong> five<br />
largest <strong>events</strong> in a Schwabe cycle, <strong>the</strong> fluence of major discrete<br />
injections within an -14-day <strong>period</strong> were summed as one<br />
event. Thus <strong>the</strong> total fluence <strong>for</strong> <strong>the</strong> October 1989 sequence of<br />
activity includes <strong>the</strong> four major discrete proton <strong>events</strong> on Occenturies.<br />
Consider <strong>the</strong> immediate implications of Figure 2 and <strong>the</strong><br />
previous discussion. We have found that <strong>the</strong> present "satellite<br />
epoch" is a <strong>period</strong> of abnormally low solar proton event frequency,<br />
and this <strong>period</strong> (1967-1994) is close to <strong>the</strong> sixth member<br />
of <strong>the</strong> series of minima of <strong>the</strong> Gleissberg <strong>period</strong>icity in <strong>the</strong><br />
tober 19, 22, 24, and 27.) For Schwabe cycles 19, 20, and 22 <strong>the</strong> interval <strong>1561</strong>-1994. Our discussion has shown that <strong>the</strong> normalratio<br />
is remarkably constant (1.16, 1.15, and 1.10, respectively), ized solar proton event frequency has increased rapidly followand<br />
this indicates that we may estimate <strong>the</strong> total solar proton ing <strong>the</strong> earlier minima to <strong>the</strong> vicinity of 6-8 large SPEs per<br />
event output, provided we know <strong>the</strong> fluences of <strong>the</strong> five largest Schwabe cycle. Repetition of that behavior would mean that<br />
<strong>events</strong> from <strong>the</strong> ice cores. The ratio <strong>for</strong> cycle 21 is 1.66; however,<br />
since <strong>the</strong> highest solar proton event fluence during this<br />
cycle was only 4.4 x 108 cm -2, and <strong>the</strong> total fluence <strong>for</strong> <strong>the</strong><br />
whole cycle was very low, we propose that this ratio is not<br />
indicative of <strong>the</strong> average solar proton fluence <strong>for</strong> <strong>the</strong> majority<br />
of Schwabe cycles within a Gleissberg cycle.<br />
<strong>the</strong> solar proton event frequency and <strong>the</strong> total fluence could<br />
increase by a factor of 6 to 8 possibly commencing in <strong>the</strong> next<br />
Schwabe cycle. Should this prediction be correct, <strong>the</strong> Earth will<br />
experience substantially more solar proton <strong>events</strong> and solar<br />
<strong>cosmic</strong> <strong>ray</strong> ground level <strong>events</strong> than has been our experience<br />
during <strong>the</strong> <strong>period</strong> since 1950. It may approximate <strong>the</strong> situation<br />
Using <strong>the</strong> average of <strong>the</strong> fluence ratios <strong>for</strong> Schwabe cycles in <strong>the</strong> <strong>period</strong> 1940-1950, during which time four large ground<br />
19, 20, and 22, Table 2 presents estimates of <strong>the</strong> total solar<br />
proton fluence <strong>for</strong> each of <strong>the</strong> five Gleissberg cycles evident in<br />
Figures 1 and 2. The averages of <strong>the</strong> peak annual sunspot<br />
indices <strong>for</strong> <strong>the</strong> constituent Schwabe cycles are given as well as<br />
level <strong>events</strong> were observed with <strong>the</strong> relatively insensitive ionization<br />
chambers in use at that time [Smart and Shea, 1991].<br />
We note, however, ano<strong>the</strong>r possibility with respect to solar<br />
proton <strong>events</strong> in <strong>the</strong> future. Figure 1 shows that <strong>the</strong> sunspot<br />
<strong>the</strong> number of solar proton <strong>events</strong> with fluence >2.0 x 10⁹ number <strong>for</strong> <strong>the</strong> 22nd Schwabe cycle (1986-1996) attained one<br />
cm '2 within <strong>the</strong> cycle.<br />
of its highest values in <strong>the</strong> historic record and that <strong>the</strong>re was no<br />
Table 2 indicates that <strong>the</strong> total number of large fluence solar<br />
proton <strong>events</strong> and <strong>the</strong>ir total integrated fluence at Earth has<br />
indication of an approaching Gleissberg minimum in <strong>the</strong> sunspot<br />
number that was comparable to earlier minima. This may<br />
not varied by more than a factor of 2-2.6 from one Gleissberg support <strong>the</strong> suggestion of Lean et al. [1992] that <strong>the</strong> Sun is<br />
cycle to ano<strong>the</strong>r. Table 2 fur<strong>the</strong>r shows that our total experience<br />
of solar proton <strong>events</strong>, both with ground-based instruments<br />
and with satellites, has been <strong>for</strong> one of <strong>the</strong> least active<br />
Gleissberg cycles in <strong>the</strong> past 433 years. Fur<strong>the</strong>rmore, 80% of<br />
<strong>the</strong> <strong>events</strong> and fluence <strong>for</strong> <strong>the</strong> Gleissberg cycle starting in 1910<br />
occurred prior to 1960. This is a fur<strong>the</strong>r indication that <strong>the</strong><br />
solar proton <strong>events</strong> that were observed during <strong>the</strong> satellite era<br />
were far from typical of <strong>the</strong> solar proton <strong>events</strong> that occurred<br />
during <strong>the</strong> previous four centuries.<br />
Table 2 and Figure 1 show that <strong>the</strong> Gleissberg cycle 1830-<br />
1910 had <strong>the</strong> highest solar proton event fluence in <strong>the</strong> <strong>period</strong><br />
under study. There are good magnetic and solar records <strong>for</strong><br />
entering a phase similar to <strong>the</strong> "Grand Maximum" of 1050-<br />
1250 A.D. [Eddy, 1976]. The consequences of this possibility<br />
<strong>for</strong> solar proton event occurrence are difficult to predict. Thus<br />
<strong>the</strong> very low frequency of occurrence of large fluence solar<br />
proton <strong>events</strong> <strong>for</strong> <strong>the</strong> <strong>period</strong> from 1970 suggests that <strong>the</strong> highest<br />
values of sunspot number may be associated with a factor<br />
that reduces <strong>the</strong> frequency of large fluence solar proton <strong>events</strong><br />
at Earth, and this is discussed in section 6. The uncertainties in<br />
<strong>the</strong> physics will only be resolved once solar-generated nitrate<br />
<strong>events</strong> have been measured <strong>for</strong> <strong>the</strong> Grand Maximum, using <strong>the</strong><br />
procedure described by McCracken et al. [this issue].<br />
Satellite engineering practice uses <strong>the</strong> SPE and related somost<br />
of that <strong>period</strong> (see section 6), and retrospective analyses lar-terrestrial characteristics <strong>for</strong> solar cycles 20-22 to deterto<br />
determine whe<strong>the</strong>r <strong>the</strong>re are features that could explain <strong>the</strong><br />
high frequency of large solar proton <strong>events</strong> will be worthwhile.<br />
Table 2 shows that <strong>the</strong> Gleissberg cycle 1580-1660 had <strong>the</strong><br />
highest number of solar proton <strong>events</strong> and <strong>the</strong> second highest<br />
total integrated solar proton event fluence in <strong>the</strong> past 433<br />
mine engineering and commercial risk in addition to operational<br />
lifetimes. A return to <strong>the</strong> high solar proton event rates<br />
observed at <strong>the</strong> maxima of <strong>the</strong> Gleissberg <strong>period</strong>icity shown in<br />
Figure 2 would have substantial impact on space engineering<br />
and space travel.
MCCRACKEN ET AL.: SOLAR COSMIC RAY GLEISSBERG PERIODICITY 21,603<br />
100<br />
90<br />
uJ 80<br />
• 7o<br />
•)<br />
z<br />
60<br />
50<br />
•> 40<br />
I-- ;0<br />
._1 20<br />
n- 10<br />
0<br />
m 8<br />
MAXIMUM SUNSPOT = 100<br />
MAXIMUM AURORA - 50<br />
-t<br />
L _ _ _<br />
-- i -i i . i ['<br />
1650 1660 1670 1680 1690 1700 1710 1720 1730 1740 1750<br />
YEAR<br />
Figure 3. Sunspot, aurorae, and solar proton event activity in <strong>the</strong> <strong>period</strong> 1650-1750, illustrating <strong>the</strong> phase<br />
lags between <strong>the</strong> phenomenat <strong>the</strong> end of <strong>the</strong> Maunder Minimum. For clarity of presentation <strong>the</strong> maximum<br />
sunspot numbers from <strong>the</strong> National Geophysical Data Center are normalized to 100 (solid dark line); <strong>the</strong><br />
aurorae data (g<strong>ray</strong> shading) from Eddy [1976] are normalized to 50.<br />
4. End of <strong>the</strong> Maunder Minimum<br />
In <strong>the</strong> following, we examine a feature of <strong>the</strong> solar proton<br />
event data that may provide insight into <strong>the</strong> varying conditions<br />
in <strong>the</strong> inner solar system during <strong>the</strong> Gl½issbcrg cycle. Figure 3<br />
displays <strong>the</strong> international sunspot number [McKinnon, 1987;<br />
National Geophysical Data Center, 2000] and aurora½ occurrence<br />
[Eddy, 1976, 1977] between 1650 and 1750. The solar<br />
proton event distribution <strong>for</strong> <strong>the</strong> same <strong>period</strong> is also shown.<br />
Since <strong>the</strong> pioneering work of Eddy, <strong>the</strong>re has been a concerted<br />
international ef<strong>for</strong>t to recover "lost" sunspot observations<br />
prior to and during <strong>the</strong> Maunder Minima [Letfus, 1993,<br />
1999; Hoyt and Schatten, 1995a, 1995b, 1996]. There has been<br />
a rcnormalization of <strong>the</strong>se early observations into <strong>the</strong> criteria<br />
<strong>for</strong> <strong>the</strong> international sunspot number [Hoyt and Shatten, 1992,<br />
1995c, 1995d, 1998a, 1998b], and <strong>the</strong>se are <strong>the</strong> sunspot numbers<br />
plotted in <strong>the</strong> figures in this paper. These numbers are<br />
available from <strong>the</strong> National Geophysical Data Center [2000].<br />
The abrupt increase in aurora½ circa 1715 led Eddy to conclude<br />
that <strong>the</strong> Maunder Minimum ended in 1715. Quoting <strong>the</strong><br />
work of Eddy [1976, 1977], this date has been accepted by many<br />
scientists. Certainly, <strong>the</strong> aurora½ data make it clear that <strong>the</strong><br />
major break with <strong>the</strong> past behavior of <strong>the</strong> geomagnetic field<br />
did not occur until 1715-1716.<br />
Consider, now, <strong>the</strong> rcnormalizcd international sunspot numbers<br />
toge<strong>the</strong>r with <strong>the</strong> solar proton <strong>events</strong> having >30 McV<br />
flucnc½s >2.0 x 10 • cm -:. These data are displayed in Figure<br />
3. From Table 1 of McCracken et al. [this issue] we find four<br />
large solar proton <strong>events</strong> observed in <strong>the</strong> nitrate record during<br />
Schwab½ cycle 1698-1711 (i.e., in 1700, 1701, 1706, and 1710).<br />
Table 1 shows that this cycle was one of <strong>the</strong> four cycles yielding<br />
<strong>the</strong> highest number of solar proton <strong>events</strong> in <strong>the</strong> nitrate record<br />
between <strong>1561</strong> and 1950. Thus, in <strong>the</strong> 15 years prior to 1715,<br />
four large fluence solar proton <strong>events</strong> were identified compared<br />
to three in <strong>the</strong> 16-year <strong>period</strong> <strong>the</strong>reafter.<br />
The observed annual frequency of large fluence solar proton<br />
<strong>events</strong> derived from <strong>the</strong> nitrate record was 0.04 yr- • during <strong>the</strong><br />
<strong>period</strong> 1650-1699. (Note that <strong>the</strong> following discussion does not<br />
use normalized proton event occurrence.) Testing <strong>the</strong> hypo<strong>the</strong>sis<br />
that <strong>the</strong> solar conditions during <strong>the</strong> <strong>period</strong> 1700-1715<br />
were identical to those during 1650-1699, we compute that <strong>the</strong><br />
probability that four solar proton <strong>events</strong> would occur in 15<br />
years is 2.2 x 10 -3. This low probability indicates that <strong>the</strong><br />
physical conditions changed abruptly in <strong>the</strong> vicinity of 1700.<br />
While aurorae apparently did not "switch on" until about 1715,<br />
<strong>the</strong> switch on in large fluence solar proton event occurrence<br />
above <strong>the</strong> very low frequency of <strong>the</strong> Maunder Minimum occurred<br />
15 years earlier. Figure 3 also shows that <strong>the</strong>re were few<br />
SPE after 1735, at which time <strong>the</strong> aurorae were just reaching a<br />
plateau, which persisted until -1750. These results imply that<br />
<strong>the</strong>re was a phase lag of approximately 15 years between <strong>the</strong><br />
commencement of solar proton <strong>events</strong> and <strong>the</strong> onset of geomagnetic<br />
activity.<br />
The SPE data, toge<strong>the</strong>r with <strong>the</strong> estimates of <strong>the</strong> international<br />
sunspot number shown in Figure 1 indicate that <strong>the</strong> Sun<br />
had commenced to develop substantial magnetic fields during<br />
1700-1715, leading to particle acceleration processesimilar to<br />
those occurring in modern times. However, <strong>the</strong> paucity of<br />
aurorae during those years (with implication of a paucity of<br />
geomagnetic storms) fur<strong>the</strong>r implies ei<strong>the</strong>r (1) that few interplanetary<br />
shock waves reached Earth, or (2) <strong>the</strong> absence of<br />
strong southward directed Bz fields interacting with <strong>the</strong> magnetosphere.
.<br />
21,604 MCCRACKEN ET AL.: SOLAR COSMIC RAY GLEISSBERG PERIODICITY<br />
3.5<br />
SSN<br />
150<br />
14o<br />
3.0<br />
SPE<br />
13o<br />
12o<br />
ci<br />
2.5<br />
110<br />
100<br />
2.0<br />
9o<br />
LLI<br />
1.5<br />
8o<br />
7o<br />
1.0<br />
. , I , I , I , I , I , I , I , I<br />
0 I 2 3 4 5 6 7 8<br />
6o<br />
, - 50<br />
9<br />
NOMINAL SCHWABE CYCLE<br />
Figure 4. The variation in solar proton event frequency and peak sunspot number (SSN) throughou<strong>the</strong><br />
sunspot Gleissberg cycle. The data are averaged over <strong>the</strong> two sunspot Gleissberg cycles 1750-1830 and<br />
1830-1910. Each data point corresponds to <strong>the</strong> average of <strong>the</strong> two Schwabe cycles at that phase in <strong>the</strong><br />
Gleissberg cycle. A linear detrend has been applied.<br />
In section 6 we interpret <strong>the</strong> delay between <strong>the</strong> solar proton<br />
event and aurorae onsets to be associated with changes in <strong>the</strong><br />
solar corona and conclude that <strong>the</strong> sunspot and solar proton<br />
event data indicate that <strong>the</strong> Maunder Minimum as expressed in<br />
solar properties ended about 1700. Similar conclusions have<br />
been reached previously by Schove [1979, 1983].<br />
5. <strong>Solar</strong> Proton Event Frequency Throughout<br />
<strong>the</strong> Gleissberg Cycle<br />
Figure 4 displays <strong>the</strong> frequency of occurrence of large fluence<br />
solar proton <strong>events</strong> and <strong>the</strong> sunspot number as a function<br />
of time, averaged over <strong>the</strong> two Gleissberg cycles 1750-1830<br />
and 1830-1910. Each data point corresponds to <strong>the</strong> average of<br />
<strong>the</strong> two Schwabe cycles at that phase in <strong>the</strong> Gleissberg cycle.<br />
The absence of reliable sunspot numbers <strong>for</strong> earlier Gleissberg<br />
cycles precluded <strong>the</strong>ir initial use, and <strong>the</strong> Gleissberg cycle after<br />
1910 was not included since it is not clear that this cycle has<br />
reached completion.<br />
Examination of Figure 4 shows that <strong>the</strong> variation of <strong>the</strong><br />
sunspot number is broadly symmetric about <strong>the</strong> midpoint of<br />
<strong>the</strong> Gleissberg cycle, as can be seen in <strong>the</strong> individual sunspot<br />
Gleissberg cycles displayed in Figure 1. By way of contrast, <strong>the</strong><br />
frequency of occurrence of large fluence solar proton <strong>events</strong><br />
appears to increase in an approximately monotonic manner to<br />
a maximum late in <strong>the</strong> Gleissberg cycle. Identifying <strong>the</strong> Maunder<br />
Minimum as <strong>the</strong> first half of <strong>the</strong> preceding sunspot Gleiss-<br />
berg cycle (i.e., 1660-1750), <strong>the</strong> same bias toward SPE activity<br />
late in <strong>the</strong> Gleissberg cycle is evident.<br />
In view of <strong>the</strong> small numbers of large fluence solar proton<br />
<strong>events</strong> in each Schwabe cycle, and <strong>the</strong> limited scope of <strong>the</strong><br />
result (three Gleissberg cycles at best), this result must be<br />
viewed with caution. Until it can be tested over a longer time<br />
series of SPE data, we regard it as a simple experimental result<br />
that <strong>the</strong>re was a skewed distribution of SPE occurrence in <strong>the</strong><br />
last half of <strong>the</strong> three consecutive Gleissberg cycles 1650-1910.<br />
We note that this behavior does not appear to have occurred in<br />
<strong>the</strong> Gleissberg cycle 1910-19857; however, <strong>the</strong> fact that <strong>the</strong><br />
international sunspot number had not commenced to decline<br />
up to <strong>the</strong> end of <strong>the</strong> 22nd Schwabe cycle indicates that o<strong>the</strong>r<br />
factors may be operating.<br />
6. Role of <strong>the</strong> Corona<br />
Eddy [1976, 1977] and Parker [1975] have discussed <strong>the</strong> fact<br />
that eclipse observations indicate that <strong>the</strong> solar corona was<br />
almost invisible at <strong>the</strong> end of <strong>the</strong> Maunder Minimum and that<br />
<strong>the</strong> first observation of coronal streamers occurred in 1716.<br />
(See description of observation by R. Cotes given by Eddy<br />
[1976].) These authors suggesthat <strong>the</strong> whole sun was essentially<br />
a "coronal hole" at <strong>the</strong> end of <strong>the</strong> Maunder Minimum.<br />
This would imply a considerably faster, less dense solar wind,<br />
and <strong>the</strong> paucity of sunspots suggests that <strong>the</strong> magnetic field<br />
entrained in <strong>the</strong> solar wind may have been considerably weaker<br />
than in <strong>the</strong> modern era. The low inferred K coronal intensities<br />
[Eddy, 1976] suggesthat <strong>the</strong> matter density in <strong>the</strong> corona may<br />
have been one or more orders of magnitude less than in our<br />
present experience.<br />
Fur<strong>the</strong>r, <strong>the</strong> corona is known to change greatly between <strong>the</strong><br />
minimum and maximum of <strong>the</strong> Schwabe cycle. It is to be<br />
expected that <strong>the</strong>re would be similar quantitative changes between<br />
<strong>the</strong> minima and maxima of <strong>the</strong> Gleissberg cycle. For<br />
example, Lockwood et al. [1999] have reported that <strong>the</strong> Sun's<br />
coronal field has increased by a factor of 2.3 since 1901 (i.e.,<br />
since <strong>the</strong> 1910 minimum of <strong>the</strong> Gleissberg <strong>period</strong>icity). Consider<br />
<strong>the</strong>re<strong>for</strong>e a model summarized by Table 3. In this table<br />
both Gleissberg columns refer to <strong>the</strong> maxima of <strong>the</strong> Schwabe<br />
cycles at that phase of <strong>the</strong> Gleissberg cycle.<br />
We sugges<strong>the</strong> following model which is based on <strong>the</strong> "coronal<br />
mass ejection acceleration model" of Reames and o<strong>the</strong>rs<br />
[cf. Reames, 1995, 1999]. We do this because many of <strong>the</strong> large<br />
fluence solar proton <strong>events</strong> in <strong>the</strong> nitrate and satellite records<br />
since <strong>the</strong> commencement of magnetic recording in <strong>the</strong> mid<br />
1800s were accompanied by exceptional geomagnetic storms.<br />
Thus <strong>the</strong> Carrington event in 1859, those of 1909 and 1928,<br />
February 1942, July 1946, November 1960, and August 1972<br />
were all associated with major magnetic storms, resulting from<br />
solar activity near central meridian [Carrington, 1860; Cliver et
MCCRACKEN ET AL.: SOLAR COSMIC RAY GLEISSBERG PERIODICITY 21,605<br />
Table 3. Phenomenological Model of Coronal Properties and Their Consequences<br />
Throughout <strong>the</strong> Gleissberg Cycle<br />
<strong>Solar</strong> and Gleissberg Gleissberg<br />
Interplanetary Maunder Minimum Maximum<br />
Features Minimum (e.g., 1910) (e.g., 1860)<br />
Coronal matter density very low low high<br />
Coronal magnetic field low higher X2 higher<br />
Coronal mass ejection velocity high medium low<br />
<strong>Solar</strong> proton acceleration very efficient efficient less efficient<br />
Interplanetary shock weak strong strong<br />
al., 1990a, 1990b; Shea et al., 1999]. There are two <strong>events</strong> in <strong>the</strong><br />
recent nitrate record that are <strong>the</strong> consequence of activity on<br />
<strong>the</strong> western limb of <strong>the</strong> Sun (i.e., February 1956 and September<br />
1989). However, <strong>the</strong>se <strong>events</strong> are not <strong>the</strong> results of coronal<br />
mass ejections (CMEs) directed toward <strong>the</strong> Earth and are not<br />
associated with exceptionally large fluences at <strong>the</strong> Earth. Fur<strong>the</strong>rmore,<br />
previous studies have shown that solar proton <strong>events</strong><br />
associated with solar activity near central meridian that result<br />
in fast coronal mass ejections have fluences that are usually up<br />
to an order of magnitude greater than those associated with<br />
compensate to some degree <strong>for</strong> <strong>the</strong> increased coronal matter<br />
densities. However, <strong>the</strong> model would be interpreted to indicate<br />
that this was insufficiento compensate <strong>for</strong> <strong>the</strong> higher coronal<br />
density in <strong>the</strong> vicinity of 1735 as proposed by <strong>the</strong> model.<br />
Through <strong>the</strong> declining phase of <strong>the</strong> Gleissberg cycle, <strong>the</strong><br />
model indicates that <strong>the</strong> matter and magnetic densities of <strong>the</strong><br />
corona would slowly decline. As a result, <strong>the</strong> CME ejection<br />
velocities could be higher and <strong>the</strong> particle acceleration increasingly<br />
efficient. Approaching <strong>the</strong> minimum of <strong>the</strong> Gleissberg<br />
cycle, CMEs would achieve higher ejection velocities, and parfast<br />
CMEs from western limb solar activity [Shea and Smart, ticle acceleration would become more efficient. This is consis-<br />
1993, 1996; Reames, 1999].<br />
For <strong>the</strong> model summarized in Table 3 <strong>the</strong> matter and magnetic<br />
densities are lowest in <strong>the</strong> Maunder Minimum, somewhat<br />
higher in <strong>the</strong> o<strong>the</strong>r minima of Gleissberg cycles and highest<br />
near <strong>the</strong> maxima of a Gleissberg cycle. As a consequence, even<br />
tent with <strong>the</strong> data in Figure 1 prior to <strong>the</strong> Gleissberg minima of<br />
1820 and 1910, and <strong>the</strong> tendency to skewness noted in Figure<br />
4. In particular, <strong>the</strong> model predicts that provided that <strong>the</strong>re<br />
was sufficient magnetic activity on <strong>the</strong> Sun to generate CMEs,<br />
<strong>the</strong> frequency of occurrence of solar proton <strong>events</strong> could be at<br />
a small CME at <strong>the</strong> end of <strong>the</strong> Maunder Minimum would meet a maximum immediately prior to and during <strong>the</strong> sunspot<br />
little resistance from <strong>the</strong> surrounding coronal medium, and <strong>the</strong><br />
ejection velocity would be high. It has been shown that <strong>the</strong><br />
Gleissberg minima. Reference to Figure 1 shows that this was<br />
<strong>the</strong> case <strong>for</strong> <strong>the</strong> sunspot Gleissberg minima circa 1820 and<br />
efficiency of solar proton acceleration by a CME varies as <strong>the</strong> 1910. On <strong>the</strong> basis of this model <strong>the</strong> relative absence of solar<br />
fourth power of <strong>the</strong> CME velocity IReames, 2000]; as a consequence<br />
acceleration would be particularly effective during and<br />
immediately after <strong>the</strong> Maunder Minimum. Fur<strong>the</strong>rmore, <strong>the</strong><br />
low particle and magnetic density in interplanetary space<br />
would mean that <strong>the</strong> shock wave generated by <strong>the</strong> CME would<br />
have a considerably smaller momentum density than in <strong>the</strong><br />
present era, and <strong>the</strong>re would be minor geomagnetic activity<br />
when it reached Earth. These predictions are consistent with<br />
<strong>the</strong> data summarized in Figure 3 illustrating <strong>the</strong> paucity of<br />
aurorae prior to --• 1715.<br />
On <strong>the</strong> basis of this model, efficient propagation of shock<br />
waves to <strong>the</strong> orbit of Earth would not occur until <strong>the</strong>re had<br />
proton <strong>events</strong> during <strong>the</strong> Maunder Minimum would be due to<br />
<strong>the</strong> virtual absence of coronal mass ejections at that time.<br />
In summary, our phenomenological model accounts <strong>for</strong> <strong>the</strong><br />
early "turn on" of large fluence solar proton <strong>events</strong> after <strong>the</strong><br />
Maunder Minimum and <strong>the</strong> delayed onset of geomagnetic<br />
activity. The model is also in accord with <strong>the</strong> higher frequency<br />
of large fluence solar proton <strong>events</strong> during <strong>the</strong> declining phase<br />
and minima of several Gleissberg cycles. Examination of<br />
eclipse and magnetic records, in conjunction with <strong>the</strong> SPE data<br />
<strong>for</strong> <strong>the</strong> <strong>period</strong> 1880-1920 will assist in validating this model,<br />
and fur<strong>the</strong>r extending our understanding of <strong>the</strong> extent to which<br />
coronal changes are associated with <strong>the</strong> time variability of solar<br />
proton <strong>events</strong>. This, in turn, will allow <strong>the</strong> long-term changes in<br />
<strong>the</strong> solar wind, and <strong>the</strong> modulation of <strong>the</strong> galactic <strong>cosmic</strong><br />
radiation to be investigated.<br />
been enough solar activity to increase <strong>the</strong> coronal and interplanetary<br />
matter and magnetic density, through <strong>the</strong> development<br />
of coronal streamers, and an extended corona. As noted<br />
above, clear evidence of <strong>the</strong> development of <strong>the</strong> corona was<br />
not reported until 1716, at which time <strong>the</strong> upsurge in aurorae<br />
indicates that geomagnetic storms had commenced 15 years<br />
after <strong>the</strong> commencement of large fluence solar proton <strong>events</strong><br />
and a large increase in <strong>the</strong> sunspot number.<br />
The model implies that CMEs near <strong>the</strong> maximum of <strong>the</strong><br />
Gleissberg cycle would encounter <strong>the</strong> greatest resistance from<br />
<strong>the</strong> matter and magnetic densities. As a consequence, <strong>the</strong> average<br />
ejection velocities would be lower, and because of <strong>the</strong><br />
fourth power law of velocity [Reames, 2000], particle acceleration<br />
would be less efficient. This prediction is consistent with<br />
<strong>the</strong> absence of large solar proton <strong>events</strong> after 1735, near <strong>the</strong><br />
peak of <strong>the</strong> Gleissberg cycle from 1650-1750. The kinetic<br />
energy of <strong>the</strong> CME will probably increase as <strong>the</strong> maximum of<br />
<strong>the</strong> Gleissberg cycle is approached, and this can be expected to<br />
7. Maximum Fluence <strong>for</strong> a <strong>Solar</strong> Proton Event<br />
and <strong>the</strong> Streaming Limit <strong>for</strong> <strong>Solar</strong> Proton Event<br />
Fluence<br />
In <strong>the</strong> modern epoch <strong>the</strong> highest estimated >30 MeV proton<br />
fluence was 9.0 x 109 cm -2 <strong>for</strong> <strong>the</strong> event of November 12,<br />
1960 [Shea and Smart, 1990]. For engineering and o<strong>the</strong>r purposes<br />
<strong>the</strong> sequence of <strong>events</strong> August 2-7, 1972, with a >30<br />
MeV proton fluence of 5 x 109 cm -2 [She and Smart, 1990]<br />
is taken as <strong>the</strong> maximum<br />
credible fluence.<br />
Reference to Table 1 of McCracken et al. [this issue] indicates<br />
that <strong>the</strong> fluence associated with <strong>the</strong> Carrington white<br />
light flare is estimated to be 18.8 x 109 cm -2. As discussed in<br />
section 8 of McCracken et al. [this issue], this estimate was
21,606 MCCRACKEN ET AL.: SOLAR COSMIC RAY GLEISSBERG PERIODICITY<br />
based upon a value of 40 <strong>for</strong> <strong>the</strong> conversion factor, K(t, h),<br />
which was regarded as a conservativ estimate <strong>for</strong> <strong>the</strong> entire<br />
data series. However, <strong>the</strong> Carrington event occurred on September<br />
1, 1859, and <strong>the</strong> late summer precipitation process was<br />
probably less efficient than is implied by a conversion factor of<br />
Observatory [1955]; thus <strong>the</strong> 13th Schwabe cycle (1889-1901)<br />
appears to have been a time of substantial magnetic disturbance.<br />
As a consequence, <strong>the</strong>se three <strong>events</strong> with fluences at or<br />
above our estimate of <strong>the</strong> maximum streaming limited fluence<br />
may be due to <strong>the</strong> superposition or interaction of several ac-<br />
40. Taking <strong>the</strong> event of August 1972 as a better approximation celeration <strong>events</strong> within <strong>the</strong> 6 weeks resolution time of <strong>the</strong><br />
to <strong>the</strong> precipitation of nitrate in <strong>the</strong> polar summer, Table 3 of<br />
McCracken et al. [this issue] shows that a value of 20 <strong>for</strong> K(t,<br />
A) would be more appropriate. This implies that <strong>the</strong> >30 MeV<br />
nitrate data. We propose that <strong>the</strong>se <strong>events</strong> deserve more careful<br />
study. If superposition or interaction can be shown to have<br />
been likely, it will even more firmly establish <strong>the</strong> streaming<br />
fluence of <strong>the</strong> Carrington event could have been about 36 x limit <strong>for</strong> fluence to be in <strong>the</strong> vicinity of 6-8 x 109 cm -2 <strong>for</strong><br />
109 cm -2. Thus <strong>the</strong> two estimates indicate that <strong>the</strong> fluence <strong>for</strong><br />
>30 MeV protons per event. Never<strong>the</strong>less, <strong>the</strong> possibility that<br />
<strong>the</strong> September 1859 solar proton event was between 4 and 8 a solar proton episode can achieve a >30 MeV fluence of<br />
times greater than <strong>the</strong> August 1972 solar proton event. 18-36 x 109 cm -2 has substantial implications <strong>for</strong> human<br />
Reames [1999] has summarized <strong>the</strong> work that has lead to <strong>the</strong> space flight and satellite engineering.<br />
recognition that <strong>the</strong> intensities of solar proton <strong>events</strong> associated<br />
with "gradual" solar X-<strong>ray</strong> activity exhibit an asymptotic<br />
8.<br />
value of particle flux due to interaction between resonant ion<br />
<strong>Solar</strong> Proton Event Occurrence as an Index<br />
waves and <strong>the</strong> SPE fluxes, yielding streaming limited particle<br />
fluxes early in a solar proton event. This proces should also set<br />
of <strong>Solar</strong> Activity<br />
The sunspot number is commonly used as an index of solar<br />
a limit <strong>for</strong> <strong>the</strong> fluence in a very large event, and we now test disturbance, in large part due to <strong>the</strong> fact that it has been<br />
whe<strong>the</strong>r <strong>the</strong> Carrington event, and o<strong>the</strong>r large SPEs in <strong>the</strong> possible to extrapolate it with some certainty to <strong>the</strong> middle of<br />
nitrate record have approached or exceeded that limit. We <strong>the</strong> 18th century [Eddy, 1976]. It has been shown to be a useful<br />
take <strong>the</strong> event of October 19, 1989, with a >30 MeV omnidiindex<br />
to understand <strong>the</strong> time dependence of many interplanrectional<br />
fluence of 4.2 x 109 cm -2 as a model of a large event. etary and terrestrial phenomena, and it itself has provided a<br />
This is <strong>the</strong> largest >30 MeV fluence solar proton event in <strong>the</strong> clear insight into <strong>the</strong> short-term (30<br />
observed in •4C are of solar or orbital origin [Sonett et al.,<br />
MeV fluence <strong>for</strong> a very large SPE to be 8 x 109 cm -2.<br />
1997], require reliable solar data over a timescale of 10,000<br />
Figure 5 of McCracken et al. [this issue] illustrates <strong>the</strong> cuyears<br />
or more.<br />
mulative normalized probabilities <strong>for</strong> large solar proton <strong>events</strong>,<br />
A similar difficulty is encountered in <strong>the</strong> validation and study<br />
as measured by both spacecraft and by <strong>the</strong> nitrate record. As<br />
of longer-term solar effects upon terrestrial phenomena, where<br />
can be seen in this figure, <strong>the</strong>re is a major reduction in probthose<br />
data <strong>the</strong>mselves are noisy and contain more than one<br />
ability of occurrence of SPEs with fluences at and above <strong>the</strong><br />
source of variability. Thus <strong>the</strong> validation of solar control on <strong>the</strong><br />
vicinity of 6 x 109 cm -2. In view of <strong>the</strong> approximate agreement<br />
14C in <strong>the</strong> Earth's atmosphere, in <strong>the</strong> presence of <strong>the</strong> low-pass<br />
with our estimate, we speculate that this feature of Figure 5 of<br />
filtering effects of <strong>the</strong> Earth's biosphere and oceans, and<br />
McCracken et al. [this issue] is indicative of streaming limitations<br />
on <strong>the</strong> fluences above about 8 x 109 cm -2. Although <strong>the</strong><br />
changes in <strong>the</strong> Earth's magnetic dipole, has been difficult and<br />
Carrington solar proton event and several o<strong>the</strong>rs in Figure 1<br />
has relied on fragmentary records of sunspots and aurorae<br />
indicate that fluences greater than our estimate of <strong>the</strong> stream-<br />
[e.g., Stuiver and Quay, 1980]. Likewise, <strong>the</strong> demonstration of<br />
solar control of climatic variables such as <strong>the</strong> eustatic sea level<br />
ing limited fluences do occur, <strong>the</strong> cumulative probability curve<br />
suggests that <strong>the</strong> streaming limit is effective about 6-8 x 10⁹<br />
in <strong>the</strong> presence of isostatic rebound (mechanical hysterisis of<br />
cm -2 <strong>for</strong> fluences of >30 MeV protons.<br />
<strong>the</strong> Earth's crust) is contentious due to <strong>the</strong> fragmentary nature<br />
Figure 1 of this present paper and Table 1 of McCracken et of solar data over time scales of >400 years [Fairbridge, 1967].<br />
al. [this issue] indicate that <strong>the</strong>re were five <strong>events</strong> in <strong>the</strong> inter- Without an independent index of solar activity, it is unlikely<br />
val <strong>1561</strong>-1950 that equal or exceed our 8 x 109 cm -2 estimate that unambiguous validation of solar control beyond 1000<br />
of <strong>the</strong> streaming limited >30 MeV fluence. Of <strong>the</strong>se <strong>the</strong>re are years into <strong>the</strong> past will be possible.<br />
good magnetic and solar records <strong>for</strong> <strong>the</strong> Carrington solar pro- For <strong>the</strong> above reasons, <strong>the</strong> ability to quantify solar activity<br />
ton event of 1859 and <strong>the</strong> <strong>events</strong> of 1895 and 1896. Close through <strong>the</strong> identification of solar proton <strong>events</strong> in polar ice<br />
examination of <strong>the</strong>se collateral data should be profitable. It is<br />
beyond <strong>the</strong> scope of this paper to do this, o<strong>the</strong>r than to note<br />
that <strong>the</strong> interplanetary medium may have been particularly<br />
disturbed at <strong>the</strong>se three times or that <strong>the</strong>re may have been two<br />
completely independent SPEs within our "resolution time" of<br />
about 6 weeks. There were several well-documented magnetic<br />
storms at <strong>the</strong> time of <strong>the</strong> Carrington event, one with an exceptionally<br />
fast transit time of 17.1 hours [Cliver et al., 1990a,<br />
1990b]. The year 1894 contained eight of <strong>the</strong> "Great Geomagcores<br />
has significance far beyond <strong>the</strong> study of <strong>the</strong> <strong>events</strong> <strong>the</strong>mselves.<br />
As stated in section 11 of McCracken et al. [this issue],<br />
drill holes extending into ice that is 40,000 years old are common,<br />
while <strong>the</strong>re have been two drill holes extending into ice<br />
more than 200,000 years old [Legrand and Mayewski, 1997].<br />
Since <strong>the</strong> nitrate is securely trapped in <strong>the</strong> crystals of consolidated<br />
ice and <strong>the</strong>re are no known decay mechanisms, it is<br />
feasible to consider <strong>the</strong> identification of solar proton <strong>events</strong><br />
extending far into <strong>the</strong> past. We can <strong>the</strong>re<strong>for</strong>e anticipate using<br />
netic Storms" 1874-1952 as identified by <strong>the</strong> Royal Greenwich <strong>the</strong> impulsive nitrate <strong>events</strong> to study solar activity and solar
MCCRACKEN ET AL.: SOLAR COSMIC RAY GLEISSBERG PERIODICITY 21,607<br />
magnetic properties over a <strong>period</strong> of time that is up to 100<br />
times <strong>the</strong> length available to us today.<br />
There will be a similar impact upon <strong>the</strong> study of solar control<br />
on <strong>the</strong> he!iosphere and <strong>the</strong> terrestrial environment. There have<br />
been a number of studies that have indicated a correlation<br />
between sunspot number and <strong>the</strong> climate of Earth [Fairbridge,<br />
1967; Eddy, 1976, 1977]. It has been proposed that <strong>the</strong> "little<br />
ice ages" were associated with <strong>the</strong> Spoerer and Maunder Minto<br />
8 per Schwabe cycle.<br />
ima, and that <strong>the</strong>re was a "Grand Sunspot Maximum," 1100-<br />
2. The <strong>period</strong> of satellite measurement (1964-1996) has<br />
1250 A.D., that correlated with a warm climate in Europe. It<br />
had a low normalized frequency of large fiuence solar proton<br />
has been argued that <strong>the</strong> cloud cover of <strong>the</strong> polar regions is<br />
event occurrence (one event/Schwabe cycle) compared to up to<br />
positively correlated with <strong>the</strong> galactic <strong>cosmic</strong> radiation [Svens-<br />
8/cycle observed during <strong>the</strong> <strong>period</strong>s circa 1610, 1710, 1790,<br />
mark and Friis-Christensen, 1997], <strong>the</strong>reby defining a possible<br />
1870, and 1950.<br />
mechanism whereby <strong>the</strong> Sun can influence climate. Verifica-<br />
3. The frequency of occurrence of large solar proton<br />
tion of <strong>the</strong>se hypo<strong>the</strong>ses has been impossible due to <strong>the</strong> uncertain<br />
knowledge of solar activity prior to 1700. The rate of<br />
<strong>events</strong> exhibits an approximate 80-85 year (Gleissberg) <strong>period</strong>icity<br />
previously recognized in sunspot numbers. Six minima<br />
occurrence of SPE, acting as a proxy <strong>for</strong> solar activity as indicated<br />
in Figure 4, toge<strong>the</strong>r with <strong>the</strong> measurements of <strong>the</strong><br />
of <strong>the</strong> Gleissberg <strong>period</strong>icity are evident in <strong>the</strong> SPE data, two<br />
being closely associated with <strong>the</strong> Maunder and Dalton Minima<br />
galacti<strong>cosmic</strong> radiation provided by •øBe and •4C, will now<br />
allow <strong>the</strong>se hypo<strong>the</strong>ses to be tested over a much greater <strong>period</strong><br />
in <strong>the</strong> sunspot numbers. It is concluded that <strong>the</strong> satellite era of<br />
observations has coincided with <strong>the</strong> recurrence of this series of<br />
than has been possible previously.<br />
In summary, it is appropriate to think of <strong>the</strong> Sun and <strong>the</strong><br />
Gleissberg minima in SPE frequency.<br />
heliosphere as a tightly coupled physical system, with transfer<br />
4. The five largest solar proton <strong>events</strong> in a Schwabe cycle<br />
functions, and feedback paths that have time constants ranging<br />
provide a sensitive indicator of <strong>the</strong> cumulative probability of all<br />
from days to millenniand longer. To date, •øBe, •4C, and<br />
<strong>the</strong> solar proton <strong>events</strong> <strong>for</strong> that cycle.<br />
world climate have been <strong>the</strong> only system outputs that are<br />
5. The Gleissberg <strong>period</strong> 1820-1910 was <strong>the</strong> most prolific<br />
available <strong>for</strong> <strong>the</strong> past 30,000 years (<strong>for</strong>•4C) and > 100,000 years generator of solar proton <strong>events</strong> followed by <strong>the</strong> <strong>period</strong> 1580-<br />
(<strong>for</strong> •øBe). However, <strong>the</strong>se have been outputs that occurred 1660. The present Gleissberg <strong>period</strong> (1910-19857) is one of<br />
toward <strong>the</strong> output end of <strong>the</strong> total heliospheric system, and we <strong>the</strong> least effective in large fluence solar proton <strong>events</strong> observed<br />
at Earth.<br />
have had no knowledge of <strong>the</strong> concurrent solar activity that<br />
was driving <strong>the</strong> system. With <strong>the</strong> impulsive nitrate measure- 6. The resumption of solar proton event activity after <strong>the</strong><br />
ments of SPEs we have identified, <strong>for</strong> <strong>the</strong> first time, a semi- Maunder Minimum occurred 16 years prior to <strong>the</strong> generally<br />
quantitative monitor of <strong>the</strong> solar activity that has driven <strong>the</strong> accepted end of <strong>the</strong> minimum, as gauged from aurorae and<br />
heliospheric system <strong>for</strong> thousands of years in <strong>the</strong> past.<br />
Examination of Figure 2 shows that while <strong>the</strong> solar proton<br />
event frequency and sunspot number curves show some similarities,<br />
<strong>the</strong>y are not identical. This is fur<strong>the</strong>r demonstrated by<br />
comparison of <strong>the</strong> second, third, and fifth columns in Table 2.<br />
Thus we note that (1) while <strong>the</strong> average peak sunspot numbers<br />
<strong>for</strong> <strong>the</strong> third and fourth Gleissberg cycles are almost equal,<br />
both of <strong>the</strong> SPE parameters (columns 3 and 5) <strong>for</strong> <strong>the</strong> fourth<br />
Gleissberg cycle are almost twice those <strong>for</strong> <strong>the</strong> third cycle, and<br />
(2) in Figure 2 <strong>the</strong> SPE frequency drops monotonically from<br />
1950 to one of <strong>the</strong> lowest values in <strong>the</strong> 433 years of SPE data,<br />
while over <strong>the</strong> same time <strong>the</strong> sunspot number has attained <strong>the</strong><br />
highest values in <strong>the</strong> whole sunspot record.<br />
The production of •4C is considered to be a maximum when<br />
<strong>the</strong> galactic <strong>cosmic</strong> radiation flux is at a maximum. This has<br />
occurred, in our <strong>cosmic</strong> radiation instrumentation era, at sunspot<br />
minimum. Figure 2 includes <strong>the</strong> •4C production rates as<br />
computed by Stuiver and Quay [1980]. Interpreting it as a plot<br />
of <strong>the</strong> galactic <strong>cosmic</strong> radiation versus time, a similar disparity<br />
is noted as above. Thus <strong>the</strong> high solar proton event frequency<br />
<strong>for</strong> <strong>the</strong> fourth Gleissberg cycle (1830-1910) is not reflected in<br />
deeper modulation than in <strong>the</strong> third.<br />
Our knowledge of <strong>the</strong> Sun is sufficiently detailed that such<br />
differences are not unexpected, and <strong>the</strong>ir study can be expected<br />
to fur<strong>the</strong>r our state of knowledge (see section 6). As a<br />
semiquantitative indicator of enhanced solar activity <strong>for</strong> use in<br />
<strong>the</strong> analysis of o<strong>the</strong>r phenomena, <strong>the</strong> ability to extend it far<br />
into <strong>the</strong> past is expected to be much more important than <strong>the</strong><br />
apparent differences between <strong>the</strong> large fiuence solar proton<br />
event frequency and sunspot number.<br />
9. Conclusions<br />
Analysis of <strong>the</strong> characteristics of <strong>the</strong> nitrate <strong>events</strong> <strong>1561</strong>-<br />
1950, and •ionospheric and <strong>the</strong> satellite measurements 1950-<br />
1994, has provided <strong>the</strong> following in<strong>for</strong>mation about solarterrestrial<br />
phenomena.<br />
1. The normalized frequency of occurrence of large fluence<br />
solar proton <strong>events</strong> has varied by a factor of 15 from 0.5<br />
solar observations. The statistical probability of this occurring<br />
by chance is small, and we conclude that this is a real effect,<br />
indicative of <strong>the</strong> solar or heliospheric conditions at <strong>the</strong> time.<br />
Thus <strong>the</strong> Maunder Minimum in solar phenomena ended about<br />
1700 and not 1715-1716.<br />
7. The occurrence of solar proton <strong>events</strong> is shown to have<br />
been skewed to <strong>the</strong> declining phase of <strong>the</strong> three sunspot Gleissberg<br />
cycles 1660-1910.<br />
8. The largest SPE in <strong>the</strong> nitrate record, and associated<br />
with <strong>the</strong> Carrington white light flare, had a >30 MeV proton<br />
fluence that was in <strong>the</strong> range 18-36 x 109 cm -2. This is a<br />
factor of 4-8 times greater than <strong>the</strong> value <strong>for</strong> <strong>the</strong> August 1972<br />
event, which has frequently been regarded as <strong>the</strong> "worst case"<br />
solar proton event.<br />
From <strong>the</strong> results derived in this paper we (1) propose a<br />
phenomenological model, wherein variations in <strong>the</strong> properties<br />
of <strong>the</strong> solar corona account <strong>for</strong> <strong>the</strong> delayed switch on of aurorae<br />
after <strong>the</strong> Maunder Minimum and th e tendency <strong>for</strong> <strong>the</strong> SPE<br />
frequency to increase during <strong>the</strong> declining phase of <strong>the</strong> sunspot<br />
Gleissberg cycle. We (2) estimate that <strong>the</strong> streaming limited<br />
fluence <strong>for</strong> >30 MeV protons is 8 x ]09 cm -2 and speculate<br />
that <strong>the</strong> break in slope in <strong>the</strong> cumulative probability distribution<br />
in <strong>the</strong> vicinity of 6 x 109 cm -2 in Figure 5 of McCracken<br />
et al. [this issue] is indicative of this effect. This suggests that<br />
<strong>the</strong> Carrington SPE of 1859 is an example of a solar proton<br />
event that exceeded <strong>the</strong> streaming limit, and <strong>the</strong>re<strong>for</strong>e worthy<br />
of careful study using <strong>the</strong> magnetic and o<strong>the</strong>r data from that<br />
time. We (3) predict that <strong>the</strong> frequency of large solar proton<br />
<strong>events</strong> may incr. ease from its present low value by a factor of 6<br />
to 8 commencing perhaps in <strong>the</strong> next Schwabe cycle. Should
21,608 MCCRACKEN ET AL.: SOLAR COSMIC RAY GLEISSBERG PERIODICITY<br />
this prediction be correct, <strong>the</strong> Earth will experience substan- Hoyt, D. V., and K. H. Schatten, How well was <strong>the</strong> Sun observed<br />
tially more solar proton <strong>events</strong> and ground level <strong>events</strong> than during <strong>the</strong> Maunder minimum, Sol. Phys., 165, 181-192, 1996.<br />
Hoyt, D. V., and K. H. Schatten, The Role of <strong>the</strong> Sun in Climate<br />
has been our experience during <strong>the</strong> <strong>period</strong> since 1950. This will<br />
Change, Ox<strong>for</strong>d Univ. Press, New York, 1997.<br />
have major implications <strong>for</strong> space flight and engineering. Hoyt, D. V., and K. H. Schatten, Group sunspot numbers: A new solar<br />
This paper demonstrates that nitrate <strong>events</strong> in polar ice core activity reconstruction, Sol. Phys., 179, 189-219, 1998a.<br />
have <strong>the</strong> potential to provide a means of studying <strong>the</strong> occur- Hoyt, D. V., and K. H. Schatten, Group sunspot numbers: A new solar<br />
rence of solar proton <strong>events</strong> and solar activity far into <strong>the</strong> past. activity reconstruction, Sol. Phys., 181, 491-512, 1998b.<br />
Lean, J., A. Skumanich, and O. White, Estimating <strong>the</strong> Sun's radiative<br />
This will provide <strong>the</strong> ability to investigate long-term changes in<br />
output during <strong>the</strong> Maunder minimum, Geophys. Res. Lett., 19, 1591-<br />
<strong>the</strong> temporal characteristics of <strong>the</strong> dynamo processes that gen- 1594, 1992.<br />
erate <strong>the</strong> variable solar magnetic fields and to investigate any Legrand, M., and P. Mayewski, Glaciochemistry of polar ice cores: A<br />
links that may exist between solar activity and climate change review, Rev. Geophys., 35, 219-243, 1997.<br />
during recent geological time. With <strong>the</strong> impulsive nitrate mea- Letfus, V., <strong>Solar</strong> activity in <strong>the</strong> sixteenth and seventeenth centuries (a<br />
surements of SPE we have, <strong>for</strong> <strong>the</strong> first time, <strong>the</strong> ability to<br />
revision), Sol. Phys., 145, 377-388, 1993.<br />
Letfus, V., Daily relative sunspot numbers 1749-1848: Reconstruction<br />
monitor <strong>the</strong> solar activity that has driven <strong>the</strong> whole helio- of missing observations, Sol. Phys., 184, 201-211, 1999.<br />
spheric system <strong>for</strong> many thousands of years into <strong>the</strong> past. Lockwood, M., R. Stamper, and M. N. Wild, A doubling of <strong>the</strong> Sun's<br />
coronal magnetic field during <strong>the</strong> past 100 years, Nature, 399, 437-<br />
439, 1999.<br />
McCracken, K. G., G. A.M. Dreschhoff, E. J. Zeller, D. F. Smart, and<br />
M. A. Shea, <strong>Solar</strong> <strong>cosmic</strong> <strong>ray</strong> <strong>events</strong> <strong>for</strong> <strong>the</strong> <strong>period</strong> <strong>1561</strong>-1994, 1,<br />
Acknowledgments. The work of G.A.M.D. was partially funded by<br />
National Science Foundation grant NFS/DPP 8715543. We wish to<br />
extend our thanks to <strong>the</strong> Office of Polar Programs of <strong>the</strong> National<br />
Science Foundation <strong>for</strong> <strong>the</strong>ir contribution to logistic facilities to<br />
G.A.M.D. in Greenland and Antarctica, and to <strong>the</strong> National Ice Core<br />
Laboratory <strong>for</strong> support received. K.G.M. thanks <strong>the</strong> Institute <strong>for</strong> Physical<br />
and Space Technologies of <strong>the</strong> University of Maryland <strong>for</strong> assistance<br />
in <strong>the</strong> completion of this paper.<br />
Janet G. Luhmann thanks Charles P. Sonett and Linwood B. Callis<br />
<strong>for</strong> <strong>the</strong>ir assistance in evaluating this paper.<br />
References<br />
Carrington, R. C., Description of a singular appearance seen in <strong>the</strong><br />
Sun on September 1, 1859, Mon. Not. R. Astron. Soc., 20, 13-15,<br />
1860.<br />
Cliver, E. W., J. Feynman, and H. B. Garrett, Flare-associated solar<br />
wind disturbances with short (
MCCRACKEN ET AL.: SOLAR COSMIC RAY GLEISSBERG PERIODICITY 21,609<br />
and global cloud coverage: A missing link in solar-climate relationships,<br />
J. Atmos. Sol. Terr. Phys., 59, 1225-1232, 1997.<br />
Waldmeier, M., The sunspot activity in <strong>the</strong> years 1610-1960, Zurich<br />
Schul<strong>the</strong>ss Co., Zurich, Switzerland, 1961.<br />
Weiss, N. O., Chaotic modulation of <strong>the</strong> solar cycle, Philos. Trans. R.<br />
Soc. London, 348, 445-447, 1994.<br />
Zeller, E. J., and G. A.M. Dreschhoff, Anomalous nitrate concentrations<br />
in polar ice cores: Do <strong>the</strong>y result from solar particle injections<br />
into <strong>the</strong> polar atmosphere, Geophys. Res. Lett., 22, 2521-2524, 1995.<br />
G. A.M. Dreschhoff, Department of Physics and Astronomy, University<br />
of Kansas, Lawrence, KS 66045. (giselad@ku.edu)<br />
K. G. McCracken, Institute <strong>for</strong> Physical Science and Technology,<br />
University of Maryland, College Park, MD 20742-2431, USA.<br />
(jellore@hinet.net.au)<br />
M. A. Shea and D. F. Smart, Air Force Research Laboratory, Space<br />
Vehicles Directorate, 29 Randolph Road, Hanscom AFB, Bed<strong>for</strong>d,<br />
MA 01731-3010. (sssrc@msn.com; sssrc@msn.com)<br />
(Received June 20, 2000; revised January 23, 2001;<br />
accepted February 6, 2001.)
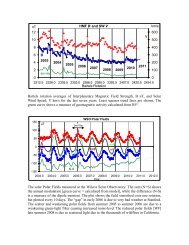
![When the Heliospheric Current Sheet [Figure 1] - Leif and Vera ...](https://img.yumpu.com/51383897/1/190x245/when-the-heliospheric-current-sheet-figure-1-leif-and-vera-.jpg?quality=85)
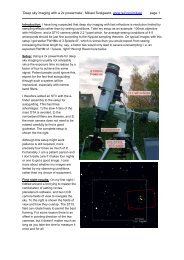

![The sum of two COSine waves is equal to [twice] the product of two ...](https://img.yumpu.com/32653111/1/190x245/the-sum-of-two-cosine-waves-is-equal-to-twice-the-product-of-two-.jpg?quality=85)