Souad AJILI - CEREG - Université Paris-Dauphine
Souad AJILI - CEREG - Université Paris-Dauphine
Souad AJILI - CEREG - Université Paris-Dauphine

Create successful ePaper yourself
Turn your PDF publications into a flip-book with our unique Google optimized e-Paper software.
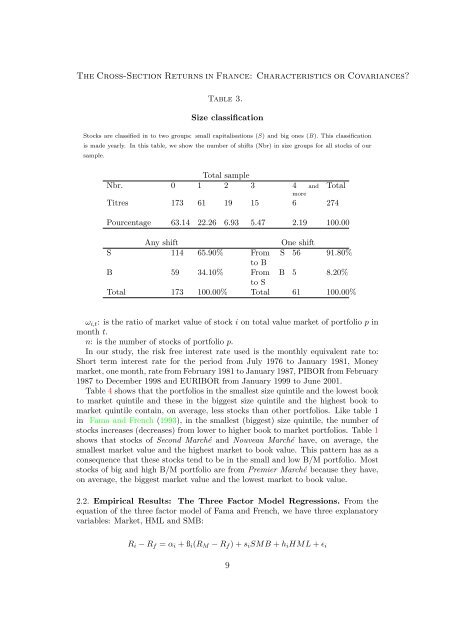
The Cross-Section Returns in France: Characteristics or Covariances<br />
Table 3.<br />
Size classification<br />
Stocks are classified in to two groups: small capitalisations (S) and big ones (B). This classification<br />
is made yearly. In this table, we show the number of shifts (Nbr) in size groups for all stocks of our<br />
sample.<br />
Total sample<br />
Nbr. 0 1 2 3 4 and Total<br />
more<br />
Titres 173 61 19 15 6 274<br />
Pourcentage 63.14 22.26 6.93 5.47 2.19 100.00<br />
Any shift<br />
One shift<br />
S 114 65.90% From S 56 91.80%<br />
to B<br />
B 59 34.10% From B 5 8.20%<br />
to S<br />
Total 173 100.00% Total 61 100.00%<br />
ω i,t : is the ratio of market value of stock i on total value market of portfolio p in<br />
month t.<br />
n: is the number of stocks of portfolio p.<br />
In our study, the risk free interest rate used is the monthly equivalent rate to:<br />
Short term interest rate for the period from July 1976 to January 1981, Money<br />
market, one month, rate from February 1981 to January 1987, PIBOR from February<br />
1987 to December 1998 and EURIBOR from January 1999 to June 2001.<br />
Table 4 shows that the portfolios in the smallest size quintile and the lowest book<br />
to market quintile and these in the biggest size quintile and the highest book to<br />
market quintile contain, on average, less stocks than other portfolios. Like table 1<br />
in Fama and French (1993), in the smallest (biggest) size quintile, the number of<br />
stocks increases (decreases) from lower to higher book to market portfolios. Table 1<br />
shows that stocks of Second Marché and Nouveau Marché have, on average, the<br />
smallest market value and the highest market to book value. This pattern has as a<br />
consequence that these stocks tend to be in the small and low B/M portfolio. Most<br />
stocks of big and high B/M portfolio are from Premier Marché because they have,<br />
on average, the biggest market value and the lowest market to book value.<br />
2.2. Empirical Results: The Three Factor Model Regressions. From the<br />
equation of the three factor model of Fama and French, we have three explanatory<br />
variables: Market, HML and SMB:<br />
R i − R f = α i + ß i (R M − R f ) + s i SMB + h i HML + ɛ i<br />
9


![& 6 ] ^ F ]^ - CEREG - Université Paris-Dauphine](https://img.yumpu.com/33326502/1/184x260/-6-f-cereg-universitac-paris-dauphine.jpg?quality=85)