Relative Quantification - CRN2M
Relative Quantification - CRN2M
Relative Quantification - CRN2M

Create successful ePaper yourself
Turn your PDF publications into a flip-book with our unique Google optimized e-Paper software.
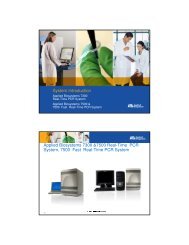
<strong>Relative</strong> <strong>Quantification</strong><br />
Applied Biosystems 7300 Real-Time PCR System<br />
Applied Biosystems 7500 & 7500 Fast Real-Time<br />
PCR System<br />
<strong>Relative</strong> <strong>Quantification</strong><br />
No standard curve if slopes are equal and close to 3.32<br />
<br />
Calculation of results by comparison of Ct values<br />
– „Comparative Ct method“<br />
<br />
Definition of:<br />
– Endogenous Control<br />
– Calibrator<br />
2<br />
¢¡¤£ £ ¥§¦©¨ ¨
Validation Experiment using Comparative Ct Method<br />
35<br />
30 Target gene: s = - 3.35<br />
Ct<br />
25<br />
20<br />
15<br />
EC: s = - 3.39<br />
10<br />
0 2 4 6 8 10<br />
Log (amount of cDNA)<br />
• Ct remains constant!<br />
• Optimal slope is – 3.3 to –3.4<br />
3<br />
¢¡¤£ £ ¥§¦©¨ ¨ <br />
What if the Slopes are not Equal <br />
Ct<br />
35<br />
30<br />
25<br />
20<br />
15<br />
Endogenous<br />
control<br />
s= -3.31<br />
Target gene<br />
s = -4.03<br />
Change your target assay !<br />
10<br />
0 2 4 6 8 10<br />
Log (amount of cDNA)<br />
4<br />
¢¡¤£ £ ¥§¦©¨ ¨
Impact of Efficiency on Results<br />
<br />
<br />
<br />
Fact: the more similar the efficiency of two assays is, and<br />
the closer to 1, the more accurate results will be<br />
The scope of your study determines what difference you<br />
can/want to accept (screening vs. small fold change<br />
detection)<br />
Do not forget about the other factors which may influence<br />
your result!<br />
7<br />
¢¡¤£ £ ¥§¦©¨ ¨ <br />
Selection of <strong>Quantification</strong> Method<br />
<br />
Standard curve method<br />
– Must be used if difference in (properly measured!!!) PCR<br />
efficiencies can not be accepted (e.g. long amplicons)<br />
– Will introduce an error; the better the standard curve is<br />
done, the smaller the error will be<br />
– Efficiency on standards must be identical to samples<br />
8<br />
¢¡¤£ £ ¥§¦©¨ ¨
Selection of <strong>Quantification</strong> Method<br />
<br />
Comparative Ct method<br />
– Easy to use, even for large gene numbers<br />
– Good design process will result in very high assay<br />
efficiencies<br />
– Added amount of sample must not cause inhibition<br />
• The goal must be to optimize extraction, RT and PCR<br />
conditions to avoid inhibition<br />
9<br />
¢¡¤£ £ ¥§¦©¨ ¨ <br />
Endogenous Control (EC)<br />
<br />
<br />
<br />
The perfect EC reflects the amount of cDNA per well<br />
EC has a constant expression level in all samples<br />
which are used in that study<br />
The EC normalizes for<br />
– RNA input measurement errors<br />
– RT efficiency variations<br />
10<br />
¢¡¤£ £ ¥§¦©¨ ¨
Endogenous Control<br />
<br />
<br />
<br />
Often ”house-keeping genes” are used but they don’t<br />
necessarily need to be suitable EC’s<br />
There is no universal EC<br />
Validate RT before looking into EC’s<br />
11<br />
¢¡¤£ £ ¥§¦©¨ ¨ <br />
Endogenous Control Selection<br />
Approach I:<br />
– Selection of candidates (TaqMan® assays)<br />
– Select ”study-representative” samples<br />
– Run RT with equal amounts of RNA in parallel, load<br />
equal amounts of cDNA<br />
– Choose gene with little / no variation<br />
• Variation seen with this gene determines the limit<br />
of fold change detection, e.g. 2 Cts variation equal<br />
a factor of 4 range/error<br />
• Tip: Try other candidates if no gene delivers<br />
acceptable results<br />
12<br />
¢¡¤£ £ ¥§¦©¨ ¨
TaqMan® Human Endogenous Control Plate Results<br />
YES<br />
YES<br />
NO<br />
NO<br />
13<br />
¢¡¤£ £ ¥§¦©¨ ¨ <br />
∆C T (cycles)<br />
14<br />
TaqMan® Human Endogenous Control Plate<br />
Results<br />
2.00<br />
1.00<br />
0.00<br />
-1.00<br />
-2.00<br />
-3.00<br />
-4.00<br />
-5.00<br />
0.12<br />
0.06<br />
-0.19<br />
IPC<br />
18S<br />
huPO<br />
huβA<br />
huCYC<br />
-0.57<br />
-0.39<br />
-0.18<br />
-2.58<br />
-2.89<br />
-1.09<br />
-1.75<br />
-2.82<br />
-0.77<br />
-2.77<br />
-2.94<br />
-0.04<br />
0.97<br />
0.75<br />
-0.98<br />
-2.44<br />
-1.35<br />
-2.03<br />
-2.35<br />
-2.14<br />
-1.35<br />
huGAPDH<br />
huPGK<br />
¢¡¤£ £ ¥§¦©¨ ¨ <br />
huβ2m<br />
huGUS<br />
huHPRT<br />
huTBP<br />
-2.65<br />
-4.05<br />
-1.64<br />
-2.16<br />
-1.21<br />
-0.03<br />
-4.67<br />
-1.94<br />
-0.66<br />
0.81<br />
0.08<br />
-0.79<br />
huTfR<br />
Choose endogenous control with minimal variation
Endogenous Control Selection<br />
<br />
Approach IIa<br />
Run several candidates throughout the entire study and<br />
choose one for normalisation at the end:<br />
• Often done e.g. on TaqMan® arrays<br />
<br />
Approach IIb<br />
Run several endogenous controls throughout the study and<br />
average results at the end:<br />
• Has been published (Qbase, Normfinder, Real Time<br />
StatMiner sw)<br />
• May introduce errors<br />
15<br />
¢¡¤£ £ ¥§¦©¨ ¨ <br />
Replicates and Controls<br />
<br />
<br />
<br />
Number of PCR replicates required is given by the<br />
precision you demand<br />
– No replicates no statistics possible<br />
– no useful results<br />
– Required to detect ”low”-fold differences<br />
– Required to get low expression correctly quantified<br />
Run no template controls (NTC‘s) for each assay<br />
used on the plate<br />
RT minus controls for the detection of genomic<br />
DNA contamination<br />
16<br />
¢¡¤£ £ ¥§¦©¨ ¨
Biological Variation<br />
<br />
What factors may have an impact on the situation found in<br />
the sample<br />
– Gender<br />
– Age of the individual<br />
– Whether sample was taken during the day or in the night<br />
– Single cell type or mixture of cells (whole tissue)<br />
– ...<br />
– Biological variation within a „normal“ or<br />
affected/disease/treated group<br />
17<br />
¢¡¤£ £ ¥§¦©¨ ¨ <br />
During the Study<br />
<br />
Load equal amount of RNA (converted to cDNA) into all<br />
wells<br />
– Endogenous control should be almost equally expressed in<br />
all samples<br />
– All samples will have almost identical Ct values for the<br />
endogenous control = quality control<br />
18<br />
¢¡¤£ £ ¥§¦©¨ ¨
Repetitions of an Experiment<br />
19<br />
<br />
<br />
Experimental precision<br />
– Identical replicates: mix sample with TaqMan®<br />
Universal PCR Master Mix and load 50µl mix/well =<br />
monitor precision of instrument<br />
– Experimental replicates: load 45µl TaqMan® Universal<br />
Master Mix and add 5µl sample = monitor true<br />
experimental precision<br />
Consider: replicates of other steps ”from cell<br />
to Ct”<br />
– E.g. two samplings from the same sample<br />
– Parallel extractions<br />
– Reveal variation of entire process<br />
¢¡¤£ £ ¥§¦©¨ ¨ <br />
TRIPLICATES<br />
<br />
<br />
Triplicates are mandatory for any statistics<br />
Minimum for the Grubbs algorithm<br />
20<br />
¢¡¤£ £ ¥§¦©¨ ¨
Calibrator Concept: an Example Using four<br />
Samples<br />
<br />
<br />
<br />
The calibrator is one of the sample of the study.<br />
The calibrator is usually the normal physiological state of<br />
the study : i.e<br />
– Untreated cells<br />
– Normal glycemia<br />
– Non tumoral tissue<br />
If working on animals, multiple samples can be<br />
considered as calibrator<br />
21<br />
¢¡¤£ £ ¥§¦©¨ ¨ <br />
Calibrator Concept: an Example Using four Samples<br />
Calibrator<br />
t=0 t=12 t=24 t=48<br />
time<br />
total RNA<br />
total RNA<br />
total RNA<br />
total RNA<br />
cDNA<br />
cDNA<br />
cDNA<br />
cDNA<br />
22<br />
¢¡¤£ £ ¥§¦©¨ ¨
Comparison of Target Gene and Endogenous<br />
Control<br />
∆Rn<br />
∆Ct = 24 – 14 = 10<br />
Ct =14 Ct = 24<br />
Cycles<br />
23<br />
Endogenous control<br />
Target gene<br />
¢¡¤£ £ ¥§¦©¨ ¨ <br />
What if we Added the Double Amount of cDNA<br />
∆Rn<br />
∆Ct = 23 – 13 = 10<br />
Ct =14 Ct = 24<br />
Ct = 13 Ct = 23<br />
Cycles<br />
24<br />
Endogenous control<br />
Target gene<br />
¢¡¤£ £ ¥§¦©¨ ¨
Comparative Ct Method: an Example Using the Four<br />
Samples<br />
∆Rn<br />
t=0<br />
∆Rn<br />
t=12 h<br />
Ct=15<br />
Ct=35<br />
Cycles<br />
Ct=15<br />
Ct=30<br />
Cycles<br />
∆Rn<br />
t=24 h ∆Rn<br />
t=48 h<br />
Ct=9 Ct=24 Cycles<br />
Ct=14<br />
Endogenous control<br />
Target gene<br />
25<br />
¢¡¤£ £ ¥§¦©¨ ¨ <br />
Ct=34<br />
Cycles<br />
Comparative Ct Method Calculation Steps<br />
step 1: Normalization to endogenous control<br />
Ct Target gene – Ct Endogenous control = ∆Ct<br />
Do both for calibrator and samples<br />
step 2: Normalization to calibrator sample<br />
∆Ct Sample – ∆Ct Calibrator = ∆∆Ct<br />
step 3: use the formula<br />
2<br />
-∆∆Ct<br />
26<br />
¢¡¤£ £ ¥§¦©¨ ¨
<strong>Relative</strong> <strong>Quantification</strong> Result of the Four Samples<br />
<br />
x-fold Expression<br />
<br />
<br />
<br />
<br />
1<br />
32 32<br />
1<br />
"!&%('*)<br />
"!+'-,.)<br />
"!/,¢0$)<br />
"!$#<br />
27<br />
Calibrator<br />
t=0<br />
Samples<br />
¢¡¤£ £ ¥§¦©¨ ¨ <br />
Exercise 1<br />
Brain<br />
Liver<br />
18S rRNA Ct 14<br />
IL-10 Ct 32<br />
18S rRNA Ct 16<br />
IL-10 Ct 28<br />
Which cDNA is higher concentrated,<br />
and how many times higher<br />
Brain, 4 times higher (2 2 )<br />
28<br />
¢¡¤£ £ ¥§¦©¨ ¨
Exercise 2<br />
Brain<br />
(Calibrator)<br />
Liver<br />
18S rRNA Ct 14<br />
IL-10 Ct 32<br />
18S rRNA Ct 16<br />
IL-10 Ct 28<br />
How does the expression of IL-10 differ<br />
in Liver and Brain<br />
∆Ct Brain = 18<br />
∆Ct Liver = 12 12 -18 = -6 2 6 = 64<br />
IL-10 is 64-times higher expressed in Liver!<br />
30<br />
¢¡¤£ £ ¥§¦©¨ ¨ <br />
Exercises: <strong>Relative</strong> <strong>Quantification</strong><br />
ABI PRISM ® 7300/7500 SDS<br />
System
Legal Statements<br />
<br />
<br />
<br />
<br />
<br />
<br />
<br />
For Research Use Only. Not for use in diagnostic procedures.<br />
NOTICE TO PURCHASER:<br />
PLEASE REFER TO THE USER'S GUIDE OR PACKAGE INSERT OF THE PRODUCTS NAMED HEREIN FOR LIMITED LABEL LICENSE<br />
OR DISCLAIMER INFORMATION.<br />
Applera, Applied Biosystems, AB (Design), and ABI PRISM are registered trademarks of Applera Corporation or its subsidiaries in the US<br />
and/or certain other countries.<br />
TaqMan is a registered trademark of Roche Molecular Systems, Inc.<br />
All other trademarks are the sole property of their respective owners.<br />
© 2008 Applied Biosystems. All rights reserved.<br />
59<br />
¢¡¤£ £ ¥§¦©¨ ¨