stat_review_test2_fall07.tst - TestGen
stat_review_test2_fall07.tst - TestGen
stat_review_test2_fall07.tst - TestGen

You also want an ePaper? Increase the reach of your titles
YUMPU automatically turns print PDFs into web optimized ePapers that Google loves.
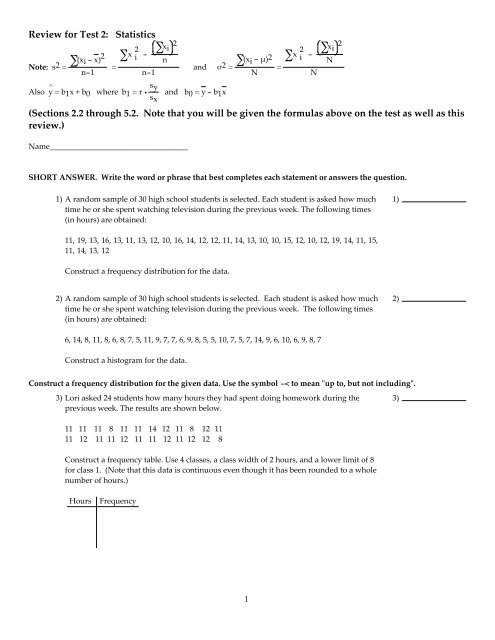
Review for Test 2: Statistics<br />
∑(xi - x) 2<br />
Note: s2 =<br />
n-1<br />
x 2 ∑xi<br />
2<br />
∑ i -<br />
n<br />
=<br />
n-1<br />
Also y^ = b1x + b0 where b1 = r · s y<br />
sx<br />
∑(xi - μ)2 ∑ x 2 i -<br />
and σ2 =<br />
=<br />
N<br />
N<br />
and b 0 = y - b1x<br />
∑xi<br />
2<br />
N<br />
(Sections 2.2 through 5.2. Note that you will be given the formulas above on the test as well as this<br />
<strong>review</strong>.)<br />
Name___________________________________<br />
SHORT ANSWER. Write the word or phrase that best completes each <strong>stat</strong>ement or answers the question.<br />
1) A random sample of 30 high school students is selected. Each student is asked how much<br />
time he or she spent watching television during the previous week. The following times<br />
(in hours) are obtained:<br />
1)<br />
11, 19, 13, 16, 13, 11, 13, 12, 10, 16, 14, 12, 12, 11, 14, 13, 10, 10, 15, 12, 10, 12, 19, 14, 11, 15,<br />
11, 14, 13, 12<br />
Construct a frequency distribution for the data.<br />
2) A random sample of 30 high school students is selected. Each student is asked how much<br />
time he or she spent watching television during the previous week. The following times<br />
(in hours) are obtained:<br />
2)<br />
6, 14, 8, 11, 8, 6, 8, 7, 5, 11, 9, 7, 7, 6, 9, 8, 5, 5, 10, 7, 5, 7, 14, 9, 6, 10, 6, 9, 8, 7<br />
Construct a histogram for the data.<br />
Construct a frequency distribution for the given data. Use the symbol -< to mean ʺup to, but not includingʺ.<br />
3) Lori asked 24 students how many hours they had spent doing homework during the<br />
previous week. The results are shown below.<br />
3)<br />
11 11 11 8 11 11 14 12 11 8 12 11<br />
11 12 11 11 12 11 11 12 11 12 12 8<br />
Construct a frequency table. Use 4 classes, a class width of 2 hours, and a lower limit of 8<br />
for class 1. (Note that this data is continuous even though it has been rounded to a whole<br />
number of hours.)<br />
Hours Frequency<br />
1
Provide the requested table entry.<br />
4) The data in the following table reflect the amount of time 40 students in a section of<br />
Statistics 101 spend on homework each day. Determine the value that should be entered in<br />
the Relative Frequency column for the class 75-89. (Note that 0-
Provide an appropriate response.<br />
6) Anna set up a grouped-data table with the following classes:<br />
6)<br />
Number of sick days taken<br />
0-3<br />
3-6<br />
6-9<br />
9-12<br />
Frequency<br />
What is wrong with these classes Describe two ways the classes could have been correctly<br />
depicted.<br />
Solve the problem.<br />
7) The number of home runs that Mark McGwire hit in the first 13 years of his major league<br />
baseball career are listed below. (Source: Major League Handbook)<br />
7)<br />
3 49 32 33 39 22 42 9 9 39 52 58 70<br />
Make a stem-and-leaf plot for this data.<br />
8) The Highway Patrol, using radar, checked the speeds (in mph) of 30 passing motorists at a<br />
checkpoint. The results are listed below. Construct a dot plot for the data.<br />
8)<br />
44 38 41 50 36 36 43 42 49 48<br />
35 40 37 41 43 50 45 54 39 38<br />
50 41 47 36 35 40 42 43 48 33<br />
MULTIPLE CHOICE. Choose the one alternative that best completes the <strong>stat</strong>ement or answers the question.<br />
Solve the problem.<br />
9) Describe the shape of the distribution.<br />
9)<br />
A) skewed to the right B) uniform<br />
C) symmetric D) skewed to the left<br />
3
Use the histograms shown to answer the question.<br />
10)<br />
10)<br />
Is either histogram symmetric<br />
A) Neither is symmetric.<br />
B) The first is symmetric, but the second is not symmetric.<br />
C) Both are symmetric.<br />
D) The second is symmetric, but the first is not symmetric.<br />
A graphical display of a data set is given. State whether the distribution is (roughly) symmetric, right skewed, or left<br />
skewed.<br />
11) The ages of a group of patients being treated at one hospital for osteoporosis are summarized in<br />
the frequency histogram below.<br />
11)<br />
A) Right skewed B) Symmetric C) Left skewed<br />
4
Explain what is misleading about the graphic.<br />
12)<br />
12)<br />
A) The horizontal scale does not begin at zero.<br />
B) The graphic only includes information for one year.<br />
C) The graphic may give the impression that drivers over age 65 had no DUIʹs in 2001.<br />
D) The graphic is not misleading.<br />
13)<br />
13)<br />
A) The horizontal label is incomplete.<br />
B) The trend is depicted in the wrong direction.<br />
C) The vertical scale does not begin at zero.<br />
D) The graphic is not misleading.<br />
5
SHORT ANSWER. Write the word or phrase that best completes each <strong>stat</strong>ement or answers the question.<br />
Provide an appropriate response.<br />
14) A television manufacturer sold three times as many televisions in 1995 as it did in 1985. To<br />
illustrate this fact, the manufacturer draws a pictogram as shown below. The television on<br />
the right is three times as tall and three times as wide as the television on the left.<br />
14)<br />
Why is this pictogram misleading What visual impression is portrayed by the pictogram<br />
MULTIPLE CHOICE. Choose the one alternative that best completes the <strong>stat</strong>ement or answers the question.<br />
15) A descriptive measure of a population is a<br />
A) Qualitative response B) Statistic<br />
C) Variable D) Parameter<br />
15)<br />
SHORT ANSWER. Write the word or phrase that best completes each <strong>stat</strong>ement or answers the question.<br />
Solve the problem.<br />
16) The amounts of money won by the top ten finishers in a famous car race are listed below.<br />
16)<br />
$1,172,246 $163,659 $440,584 $350,634 $290,596<br />
$186,731 $145,809 $143,209 $139,096 $125,106<br />
Find the mean and median winnings. Round to the nearest dollar. Which measure - the<br />
mean or the median- best represents the data Explain your reasoning.<br />
6
MULTIPLE CHOICE. Choose the one alternative that best completes the <strong>stat</strong>ement or answers the question.<br />
17) The following data represent the bachelor degrees of CEOʹs at area small businesses. Determine<br />
the mode degree.<br />
17)<br />
Degree Number<br />
Accounting 22<br />
Business 41<br />
Liberal Arts 5<br />
Marketing 29<br />
Other 11<br />
A) marketing B) accounting C) business D) no mode<br />
18)<br />
18)<br />
For the distribution drawn here, identify the mean, median, and mode.<br />
A) A = mode, B = mean, C = median B) A = mode, B = median, C = mean<br />
C) A = median, B = mode, C = mean D) A = mean, B = mode, C = median<br />
SHORT ANSWER. Write the word or phrase that best completes each <strong>stat</strong>ement or answers the question.<br />
Obtain the population standard deviation, σ, for the given data. Assume that the data represent population data. Round<br />
your final answer to one more decimal place than that used for the observations. (Do this without using the <strong>stat</strong>istical<br />
package in the calculator.)<br />
19) The normal annual precipitation (in inches) is given below for 8 different U.S. cities.<br />
19)<br />
9.0 7.0 6.3 13.0<br />
19.4 6.8 10.2 17.6<br />
Provide an appropriate response.<br />
20) A group of medical researchers is interested in knowing the mean cholesterol level for all<br />
men in the U.S. aged between 70 and 80. They pick a sample of 5,000 men and measure<br />
their cholesterol levels. They then calculate the mean and standard deviation of these<br />
cholesterol levels. Do the mean and standard deviation obtained in this way represent<br />
parameters or <strong>stat</strong>istics Why What symbols could you use to denote the mean and<br />
standard deviation of the 5,000 cholesterol levels<br />
20)<br />
7
Solve the problem.<br />
21) In a random sample, 10 students were asked to compute the distance they travel one way<br />
to school to the nearest tenth of a mile. The data is listed below. Compute, by hand, the<br />
range, sample standard deviation and sample variance of the data.<br />
21)<br />
1.1 5.2 3.6 5.0 4.8 1.8 2.2 5.2 1.5 0.8<br />
Use the empirical rule to solve the problem.<br />
22) The systolic blood pressure of 18-year-old women is normally distributed with a mean of<br />
120 mmHg and a standard deviation of 12 mmHg. Approximately, what percentage of<br />
18-year-old women have a systolic blood pressure that lies within 3 standard deviations<br />
to either side of the mean<br />
22)<br />
Solve the problem.<br />
23) A study was designed to investigate the effects of two variables - (1) a studentʹs level of<br />
mathematical anxiety and (2) teaching method - on a studentʹs achievement in a<br />
mathematics course. Students who had a low level of mathematical anxiety were taught<br />
using the traditional expository method. These students obtained a mean score of 420 and<br />
a standard deviation of 40 on a standardized test. Find and interpret the z-score of a<br />
student who scored 460 on the standardized test.<br />
23)<br />
MULTIPLE CHOICE. Choose the one alternative that best completes the <strong>stat</strong>ement or answers the question.<br />
24) The percentage of measurements that are above the 39th percentile is<br />
A) 39% B) 61%<br />
C) 71% D) cannot determine<br />
24)<br />
25) The weights (in pounds) of 30 preschool children are listed below. Find Q1. (Do not use the<br />
<strong>stat</strong>istical package in the calculator.)<br />
25)<br />
25 25 26 26.5 27 27 27.5 28 28 28.5<br />
29 29 30 30 30.5 31 31 32 32.5 32.5<br />
33 33 34 34.5 35 35 37 37 38 38<br />
A) 27 B) 28 C) 38 D) 25<br />
SHORT ANSWER. Write the word or phrase that best completes each <strong>stat</strong>ement or answers the question.<br />
26) The weights (in pounds) of 30 preschool children are listed below. Find the interquartile<br />
range of the 30 weights listed below. (Do not use the <strong>stat</strong>istical package in the calculator.)<br />
26)<br />
25 25 26 26.5 27 27 27.5 28 28 28.5<br />
29 29 30 30 30.5 31 31 32 32.5 32.5<br />
33 33 34 34.5 35 35 37 37 38 38<br />
8
27) The following is a sample of 19 test scores from a geography class:<br />
52, 62, 66, 68, 72, 74, 74, 76, 76, 76, 78, 78, 82, 84, 84, 86, 88, 92, 96.<br />
27)<br />
Find the five-number summary. (Do this by hand. and show the steps.)<br />
28) The cholesterol levels (in milligrams per deciliter) of 30 adults are listed below. Draw a<br />
modified boxplot that represents the data. (You can use a calculator and sketch the graph<br />
below. Be sure that your scale is accurate.) Are there any outliers<br />
28)<br />
154 156 165 165 170 171 172 180 184 185<br />
189 189 190 192 195 198 198 200 200 200<br />
205 205 211 215 220 220 225 238 255 265<br />
29) To study the physical fitness of a sample of 28 people, the data below were collected<br />
representing the number of sit-ups that a person could do in one minute.<br />
29)<br />
10 12 12 15 15 15 18<br />
20 22 25 25 26 29 30<br />
32 33 40 40 40 45 46<br />
47 48 48 50 52 53 56<br />
Determine the lower and upper fences. Are there any outliers according to this criterion<br />
(You may use a calculator to help. )<br />
Solve the problem.<br />
30) In an area of the Midwest, records were kept on the relationship between the rainfall (in<br />
inches) and the yield of wheat (bushels per acre). Construct a scatter diagram for the data.<br />
Determine whether there is a positive linear correlation, negative linear correlation, or no<br />
linear correlation.<br />
30)<br />
Rain fall (in inches), x<br />
Yield (bushels per acre), y<br />
10.5<br />
50.5<br />
8.8<br />
46.2<br />
13.4<br />
58.8<br />
12.5<br />
59.0<br />
18.8<br />
82.4<br />
10.3<br />
49.2<br />
7.0<br />
31.9<br />
15.6<br />
76.0<br />
16.0<br />
78.8<br />
31) Construct a scatter diagram for the given data. Determine whether there is a positive<br />
linear correlation, negative linear correlation, or no linear correlation.<br />
31)<br />
x<br />
y<br />
-5<br />
11<br />
-3<br />
-6<br />
4<br />
8<br />
1<br />
-3<br />
-1<br />
-2<br />
-2<br />
1<br />
0<br />
5<br />
2<br />
-5<br />
3<br />
6<br />
-4<br />
7<br />
MULTIPLE CHOICE. Choose the one alternative that best completes the <strong>stat</strong>ement or answers the question.<br />
Use the scatter diagrams shown, labelled a through f to solve the problem.<br />
9
32)<br />
a<br />
b<br />
32)<br />
12<br />
y<br />
12<br />
y<br />
10<br />
10<br />
8<br />
8<br />
6<br />
6<br />
4<br />
4<br />
2<br />
2<br />
1 2 3 4 5 6<br />
x<br />
1 2 3 4 5 6<br />
x<br />
c<br />
d<br />
12<br />
y<br />
12<br />
y<br />
10<br />
10<br />
8<br />
8<br />
6<br />
6<br />
4<br />
4<br />
2<br />
2<br />
1 2 3 4 5 6<br />
x<br />
1 2 3 4 5 6 7<br />
x<br />
e<br />
f<br />
12<br />
y<br />
12<br />
y<br />
10<br />
10<br />
8<br />
8<br />
6<br />
6<br />
4<br />
4<br />
2<br />
2<br />
1 2 3 4 5 6 7<br />
x<br />
1 2 3 4 5 6<br />
x<br />
In which scatter diagram is r = -1<br />
A) f B) b C) d D) a<br />
SHORT ANSWER. Write the word or phrase that best completes each <strong>stat</strong>ement or answers the question.<br />
Solve the problem.<br />
33) The data below are the ages and systolic blood pressures (measured in millimeters of<br />
mercury) of 9 randomly selected adults. Calculate the correlation coefficient, r. (You can<br />
use a calculator.)<br />
33)<br />
Age, x<br />
Pressure, y<br />
33<br />
114<br />
36<br />
118<br />
40<br />
121<br />
43<br />
129<br />
46<br />
140<br />
48<br />
143<br />
52<br />
146<br />
56<br />
148<br />
60<br />
150<br />
10
34) The data below are the temperatures on randomly chosen days during a summer class and<br />
the number of absences on those days. Find the equation of the regression line for the<br />
given data. (You can use a calculator.)<br />
34)<br />
Temperature, x<br />
Number of absences, y<br />
72<br />
3<br />
85<br />
7<br />
91<br />
10<br />
90<br />
10<br />
88<br />
8<br />
98<br />
15<br />
75<br />
4<br />
100<br />
15<br />
80<br />
5<br />
MULTIPLE CHOICE. Choose the one alternative that best completes the <strong>stat</strong>ement or answers the question.<br />
35) Is there a relationship between the raises administrators at State University receive and their<br />
performance on the job<br />
35)<br />
A faculty group wants to determine whether job rating (x) is a useful linear predictor of raise (y).<br />
Consequently, the group considered the straight-line regression model<br />
y^ = β0 + β1x.<br />
Using the method of least squares, the faculty group obtained the following prediction equation:<br />
Interpret the estimated y-intercept of the line.<br />
y^ = 14,000 - 2,000x<br />
A) For an administrator who receives a rating of zero, we estimate his or her raise to be $14,000.<br />
B) For a 1-point increase in an administratorʹs rating, we estimate the administratorʹs raise to<br />
increase $14,000.<br />
C) The base administrator raise at State University is $14,000.<br />
D) There is no practical interpretation, since rating of 0 is nonsensical and outside the range of<br />
the sample data.<br />
11
36) Is there a relationship between the raises administrators at State University receive and their<br />
performance on the job<br />
36)<br />
A faculty group wants to determine whether job rating (x) is a useful linear predictor of raise (y).<br />
Consequently, the group considered the straight-line regression model<br />
y^ = β0 + β1x.<br />
Using the method of least squares, the faculty group obtained the following prediction equation:<br />
Interpret the estimated slope of the line.<br />
y^ = 14,000 - 2,000x<br />
A) For an administrator with a rating of 1.0, we estimate his/her raise to be $2,000.<br />
B) For a 1-point increase in an administratorʹs rating, we estimate the administratorʹs raise to<br />
decrease $2,000.<br />
C) For a $1 increase in an administratorʹs raise, we estimate the administratorʹs rating to<br />
decrease 2,000 points.<br />
D) For a 1-point increase in an administratorʹs rating, we estimate the administratorʹs raise to<br />
increase $2,000.<br />
SHORT ANSWER. Write the word or phrase that best completes each <strong>stat</strong>ement or answers the question.<br />
37) The data below are the final exam scores of 10 randomly selected <strong>stat</strong>istics students and<br />
the number of hours they studied for the exam. What is the best predicted value for y<br />
given x = 8 (You can use a calculator to find the regression equation.)<br />
37)<br />
Hours, x<br />
Scores, y<br />
3<br />
65<br />
5<br />
80<br />
2<br />
60<br />
8<br />
88<br />
2<br />
66<br />
4<br />
78<br />
4<br />
85<br />
5<br />
90<br />
6<br />
90<br />
3<br />
71<br />
38) The regression line for the given data is y^ = 0.449x - 30.27.<br />
38)<br />
Temperature, x<br />
Number of absences, y<br />
72<br />
3<br />
85<br />
7<br />
91<br />
10<br />
90<br />
10<br />
88<br />
8<br />
98<br />
15<br />
75<br />
4<br />
100<br />
15<br />
80<br />
5<br />
Determine the residual of a data point for which x = 90 and y = 10.<br />
39) Calculate the coefficient of determination, given that the linear correlation coefficient, r, is<br />
0.837. What does this tell you about the explained variation and the unexplained variation<br />
of the data about the regression line<br />
39)<br />
12
40) In a study of feeding behavior, zoologists recorded the number of grunts of a warthog<br />
feeding by a lake in the 15 minute period following the addition of food. The data showing<br />
the weekly number of grunts and and the age of the warthog (in days) are listed below:<br />
40)<br />
Number of Grunts Age (days)<br />
88 123<br />
66 139<br />
37 153<br />
42 158<br />
61 165<br />
38 172<br />
60 181<br />
15 187<br />
18 193<br />
Find and interpret the value of R2. (You may use a calculator to find R2.)<br />
MULTIPLE CHOICE. Choose the one alternative that best completes the <strong>stat</strong>ement or answers the question.<br />
41) Which of the following cannot be a probability<br />
A) 0.001 B)<br />
6<br />
3<br />
C) -55 D) 0<br />
41)<br />
42) Which of the following probabilities for the sample points A, B, and C could be true if A, B, and C<br />
are the only sample points in an experiment<br />
42)<br />
A) P(A) = -1/4, P(B) = 1/2, P(C) = 3/4 B) P(A) = 1/4, P(B) = 1/4, P(C) = 1/4<br />
C) P(A) = 0, P(B) = 1/14, P(C) = 13/14 D) P(A) = 1/8, P(B) = 1/7, P(C) = 1/10<br />
SHORT ANSWER. Write the word or phrase that best completes each <strong>stat</strong>ement or answers the question.<br />
Solve the problem.<br />
43) Identify the sample space of the probability experiment: determining the childrenʹs gender<br />
for a family of three children (Use B for boy and G for girl.)<br />
43)<br />
44) If sample points A, B, C, and D, are the only possible outcomes of an experiment, find the<br />
probability of D using the table below.<br />
44)<br />
Sample Point A B C D<br />
Probability 1/10 1/10 1/10<br />
.<br />
13
MULTIPLE CHOICE. Choose the one alternative that best completes the <strong>stat</strong>ement or answers the question.<br />
45)<br />
45) The table below represents a random sample of the number of deaths per 100 cases for a certain<br />
A) 1 35 ; 0.029 B) 35<br />
; 0.35<br />
100<br />
35<br />
C)<br />
65 ; 0.538 D) 7<br />
120 ; 0.058<br />
illness over time. If a person infected with this illness is randomly selected from all infected people,<br />
find the probability that the person lives 3-4 years after diagnosis.<br />
Years after Diagnosis Number deaths<br />
1-2 15<br />
3-4 35<br />
5-6 16<br />
7-8 9<br />
9-10 6<br />
11-12 4<br />
13-14 2<br />
15+ 13<br />
TRUE/FALSE. Write ʹTʹ if the <strong>stat</strong>ement is true and ʹFʹ if the <strong>stat</strong>ement is false.<br />
Solve the problem.<br />
46) The probability that event A will occur is<br />
Number of successful outcomes<br />
P(A) =<br />
Total number of all possible outcomes<br />
46)<br />
SHORT ANSWER. Write the word or phrase that best completes each <strong>stat</strong>ement or answers the question.<br />
47) A die is rolled. The set of equally likely outcomes is {1, 2, 3, 4, 5, 6}. Find the probability of<br />
getting a 2.<br />
47)<br />
Find the indicated probability.<br />
48) A committee of three people is to be formed. The three people will be selected from a list<br />
of five possible committee members. A simple random sample of three people is taken,<br />
without replacement, from the group of five people. If the five people are represented by<br />
the letters A, B, C, D, E, the possible outcomes are as follows.<br />
48)<br />
ABC<br />
ABD<br />
ABE<br />
ACD<br />
ACE<br />
ADE<br />
BCD<br />
BCE<br />
BDE<br />
CDE<br />
Determine the probability that C and D are both included in the sample.<br />
14
List the outcomes comprising the specified event.<br />
49) In a competition, two people will be selected from four finalists to receive the first and<br />
second prizes. The prize winners will be selected by drawing names from a hat. The<br />
names of the four finalists are Jim, George, Helen, and Maggie. The possible outcomes can<br />
be represented as follows.<br />
49)<br />
JG JH JM GJ GH GM<br />
HJ HG HM MJ MG MH<br />
Here, for example, JG represents the outcome that Jim receives the first prize and George<br />
receives the second prize. List the outcomes that comprise the following event.<br />
A = event that Helen gets a prize<br />
MULTIPLE CHOICE. Choose the one alternative that best completes the <strong>stat</strong>ement or answers the question.<br />
Solve the problem.<br />
50) In 1999 the stock market took big swings up and down. A survey of 993 adult investors asked how<br />
often they tracked their portfolio. The table shows the investor responses. What is the probability<br />
that an adult investor tracks his or her portfolio daily<br />
How frequently Response<br />
Daily 231<br />
Weekly 283<br />
Monthly 280<br />
Couple times a year 141<br />
Donʹt track 58<br />
A) 280<br />
993<br />
; 0.282 B)<br />
141<br />
993<br />
50)<br />
283<br />
231<br />
; 0.142 C) ; 0.285 D)<br />
993 993 ; 0.233<br />
SHORT ANSWER. Write the word or phrase that best completes each <strong>stat</strong>ement or answers the question.<br />
51) The distribution of Masterʹs degrees conferred by a university is listed in the table.<br />
(assume that a student majors in only one subject)<br />
51)<br />
Major Frequency<br />
Mathematics 216<br />
English 207<br />
Engineering 92<br />
Business 178<br />
Education 217<br />
What is the probability that a randomly selected student with a Masterʹs degree majored<br />
in Business, Education or Engineering Round your answer to three decimal places.<br />
MULTIPLE CHOICE. Choose the one alternative that best completes the <strong>stat</strong>ement or answers the question.<br />
52) One hundred people were asked, ʺDo you favor the death penaltyʺ Of the 33 that answered ʺyesʺ<br />
to the question, 14 were male. Of the 67 that answered ʺnoʺ to the question, six were male. If one<br />
person is selected at random, what is the probability that this person answered ʺyesʺ or was a<br />
male<br />
52)<br />
A) 0.53 B) 0.39 C) 0.13 D) 0.67<br />
15
53) A sample of 280 shoppers at a large suburban mall were asked two questions: (1) Did you see a<br />
television ad for the sale at department store X during the past 2 weeks (2) Did you shop at<br />
department store X during the past 2 weeks The responses to the questions are summarized in the<br />
table.<br />
53)<br />
Shopped at X Did Not Shop at X<br />
Saw ad 135 40<br />
Did not see ad 40 65<br />
What is the probability that a randomly selected shopper from the 280 questioned did not shop at<br />
department store X<br />
A) 0.625 B) 0.143 C) 0.375 D) 0.232<br />
SHORT ANSWER. Write the word or phrase that best completes each <strong>stat</strong>ement or answers the question.<br />
List the outcomes comprising the specified event.<br />
54) In a competition, two people will be selected from four finalists to receive the first and<br />
second prizes. The prize winners will be selected by drawing names from a hat. The<br />
names of the four finalists are Jim, George, Helen, and Maggie. The possible outcomes can<br />
be represented as follows.<br />
54)<br />
JG JH JM GJ GH GM<br />
HJ HG HM MJ MG MH<br />
Here, for example, JG represents the outcome that Jim receives the first prize and George<br />
receives the second prize. The events A and B are defined as follows.<br />
A = event that Helen gets first prize<br />
B = event that George gets a prize<br />
List the outcomes that comprise the event (A or B).<br />
16
MULTIPLE CHOICE. Choose the one alternative that best completes the <strong>stat</strong>ement or answers the question.<br />
Describe the specified event in words.<br />
55) When a quarter is tossed four times, 16 outcomes are possible.<br />
55)<br />
HHHH HHHT HHTH HHTT<br />
HTHH HTHT HTTH HTTT<br />
THHH THHT THTH THTT<br />
TTHH TTHT TTTH TTTT<br />
Here, for example, HTTH represents the outcome that the first toss is heads, the next two tosses<br />
are tails, and the fourth toss is heads. The events A and B are defined as follows.<br />
A = event exactly two tails are tossed<br />
B = event the first toss is heads<br />
Describe the event (A or B) in words.<br />
A) Event that exactly two tails are tossed and the first toss is heads<br />
B) Event that exactly two tails are tossed or the first toss is heads but not both<br />
C) Event that exactly two tails are tossed or the first toss is heads or both<br />
D) Event that the first toss is heads or the last two tosses are tails or both<br />
SHORT ANSWER. Write the word or phrase that best completes each <strong>stat</strong>ement or answers the question.<br />
Find the indicated probability by using the special addition rule.<br />
56) A percentage distribution is given below for the size of families in one U.S. city.<br />
56)<br />
Size Percentage<br />
2 46.4<br />
3 24.5<br />
4 14.0<br />
5 9.1<br />
6 4.0<br />
7+ 2.0<br />
A family is selected at random. Find the probability that the size of the family is at most 3.<br />
Round approximations to three decimal places.<br />
MULTIPLE CHOICE. Choose the one alternative that best completes the <strong>stat</strong>ement or answers the question.<br />
57) Given that P(A or B) = 1 2 , P(A) = 1 4 , and P(A and B) = 1 , find P(B).<br />
9<br />
57)<br />
A) 13<br />
36<br />
B) 31<br />
36<br />
C) 23<br />
36<br />
D) 5 24<br />
17
Solve the problem.<br />
58) The following Venn diagram is for the six sample points possible when rolling a fair die. Let A be<br />
the event rolling an even number and let B be the event rolling a number greater than 1.<br />
58)<br />
Which of the following events describes the event rolling a 1<br />
A) B B) Ac C) Bc D) A ∪ B<br />
59) In 5-card poker, played with a standard 52-card deck, 2,598,960 different hands are possible. If<br />
there are 624 different ways a ʺfour-of-a-kindʺ can be dealt, find the probability of not being dealt<br />
a ʺfour-of-a-kindʺ.<br />
A)<br />
624<br />
2,598,960<br />
B)<br />
1248<br />
2,598,960<br />
C)<br />
625<br />
2,598,960<br />
D) 2,598,336<br />
2,598,960<br />
59)<br />
18
Answer Key<br />
Testname: STAT_REVIEW_TEST2_FALL07<br />
1)<br />
Hours Number of<br />
of TV HS Students<br />
10 4<br />
11 5<br />
12 6<br />
13 5<br />
14 4<br />
15 2<br />
16 2<br />
19 2<br />
2) (Note that the bars are centered over the data values.)<br />
Television Watching During a Week<br />
3) (Note that 8-< 10 means all values from 8, including 8, up to 10 ,but not including 10. The same meaning is also used<br />
for the other intervals.)<br />
Hours Frequency<br />
8-
Answer Key<br />
Testname: STAT_REVIEW_TEST2_FALL07<br />
5) Number of Days off in Year for Police Detectives<br />
6) Answers will vary. Possible answer: In a grouped-data table, each observation must belong to one and only one class.<br />
In Annaʹs table, there is overlap of the classes - it is not clear, for example, to which class the value 3 belongs. The<br />
classes could have been depicted in either of the following ways:<br />
7)<br />
0 3 9 9<br />
1<br />
2 2<br />
3 2 3 9 9<br />
4 2 9<br />
5 2 8<br />
6<br />
7 0<br />
Number of sick days taken<br />
0-
Answer Key<br />
Testname: STAT_REVIEW_TEST2_FALL07<br />
8)<br />
9) A<br />
10) A<br />
11) C<br />
12) C<br />
13) C<br />
14) Answers will vary. Possible answer: The area of the television on the right is nine times (not three times) the area of<br />
the television on the left. The pictogram gives the visual impression that sales in 1995 were nine times the sales in<br />
15) D<br />
16) mean: $315,767; median: $175,195; the median<br />
17) C<br />
18) B<br />
19) 4.72 in.<br />
20) The mean and standard deviation represent <strong>stat</strong>istics since they are descriptive measures for a sample. They are<br />
denoted by x and s, respectively.<br />
21) range = 4.4, s = 1.8, s2 = 3.324<br />
22) 99.7%<br />
23) The z-score is z = x - μ<br />
σ .<br />
460 - 420<br />
For a score of 46, z = = 1.00.<br />
40<br />
This studentʹs score falls 1.00 standard deviations above the mean score of 420.<br />
24) B<br />
25) B<br />
26) IQR = Q3 - Q1 = 34 - 28 = 6<br />
27) 52, 72, 76, 84, 96<br />
21
Answer Key<br />
Testname: STAT_REVIEW_TEST2_FALL07<br />
28)<br />
29) lower fence = -22.25; upper fence = 87.75; outliers: none<br />
30)<br />
There appears to be a positive linear correlation between the variables.<br />
31)<br />
There appears to be no linear correlation.<br />
32) D<br />
33) 0.960<br />
34) y^ = 0.449x - 30.27<br />
35) A<br />
36) B<br />
37) 96<br />
38) -0.14<br />
22
Answer Key<br />
Testname: STAT_REVIEW_TEST2_FALL07<br />
39) The coefficient of determination, R2, = 0.701. That is, 70.1% of the variation is explained by the regression line for x<br />
values and 29.9% of the variation is unexplained.<br />
40) r2 = .627; Approximately 62.7% of the variation in the number of grunts is explained by age.<br />
41) C<br />
42) C<br />
43) (BBB), (BBG), (BGB), (GBB), (BGG), (GBG), (GGB), (GGG)<br />
44) 7/10<br />
45) B<br />
46) TRUE<br />
47) 1 6<br />
3<br />
48)<br />
10<br />
49) JH, GH, HJ, HG, HM, MH<br />
50) D<br />
51) 0.535<br />
52) B<br />
53) C<br />
54) JG, GJ, GH, GM, HJ, HG, HM, MG<br />
55) C<br />
56) 0.709<br />
57) A<br />
58) C<br />
59) D<br />
23