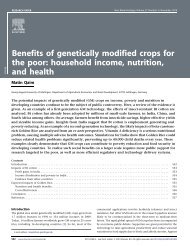
Martin Hedberg
Martin Hedberg
Martin Hedberg

You also want an ePaper? Increase the reach of your titles
YUMPU automatically turns print PDFs into web optimized ePapers that Google loves.
Climate Change<br />
<strong>Martin</strong> <strong>Hedberg</strong><br />
<strong>Martin</strong>.<strong>Hedberg</strong>@swc.se<br />
+46 70 601 04 05<br />
Swedish Weather & Climate Centre AB
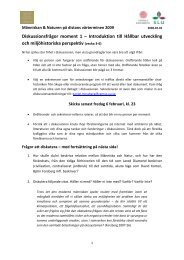
Climate<br />
14,5°C<br />
weather statistics
Average temperature<br />
+20<br />
21st century<br />
+15<br />
20th century<br />
+10<br />
Ice-age<br />
˚C
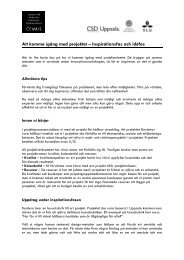
Climate change, how do you know it is happening
Global Temperature<br />
Medelvärdet 1951-1980<br />
Last uppdated: 2011-01-12<br />
http://data.giss.nasa.gov/gistemp/graphs/
Ocean heat content 0-700m<br />
Climate Indicators, NOAA<br />
Arndt, D. S., M. O. Baringer, and M. R. Johnson, Eds., 2010: State of the Climate in 2009. Bull. Amer. Meteor. Soc., 91 (7), S1-S224.<br />
http://www.ncdc.noaa.gov/bams-state-of-the-climate/2009-time-series/
Sea Level<br />
Climate Indicators, NOAA<br />
Arndt, D. S., M. O. Baringer, and M. R. Johnson, Eds., 2010: State of the Climate in 2009. Bull. Amer. Meteor. Soc., 91 (7), S1-S224.<br />
http://www.ncdc.noaa.gov/bams-state-of-the-climate/2009-time-series/
–3.3% per decade<br />
http://nsidc.org/arcticseaicenews
Stratospheric temperature<br />
Climate Indicators, NOAA<br />
Arndt, D. S., M. O. Baringer, and M. R. Johnson, Eds., 2010: State of the Climate in 2009. Bull. Amer. Meteor. Soc., 91 (7), S1-S224.<br />
http://www.ncdc.noaa.gov/bams-state-of-the-climate/2009-time-series/
What does ”0,75º warmer” mean<br />
±0º +0,5º<br />
−0,5º +3,0º
Global Temperature Anomalies, July 2010<br />
Global surface temperature anomalies for July 2010 compared to average temperatures for the same time<br />
of year from 1951 to 1980.<br />
It was more than 5 degrees Celsius warmer than climatology in the region of Eastern Europe.<br />
July 2010 was practically in a three-way tie for the warmest July on record, tied with July 1998 and July 2005.<br />
NASA Goddard Institute for Space Studies (GISS)<br />
http://earthobservatory.nasa.gov
5 million years ago:<br />
Sea level +15-25 m.<br />
120.000 years ago:<br />
Sea Level 4-6 meter<br />
Figure 2. Global temperature relative to peak Holocene temperature (Hansen and Sato, 2011).<br />
Present<br />
time<br />
2.2. Paleoclimate Temperature<br />
Hansen and Sato (2011) illustrate Earth's temperature on a broad range of time scales.<br />
Figure 2(a) shows estimated Figure 2. global Global mean temperature temperature relative 14 to during peak Holocene the Pliocene temperature and Pleistocene, (Hansen and Sato, 2011).<br />
approximately the past five million years. Figure 2(b) shows higher temporal resolution, so that<br />
the more recent glacial 2.2. to Paleoclimate interglacial climate Temperature oscillations are more apparent.<br />
Climate variations summarized Hansen and Sato in Figure (2011) 2 are illustrate huge. Earth's During temperature the last ice age, on a 20,000 broad range of time scales.<br />
years ago, global mean Figure temperature 2(a) shows was estimated about 5°C global lower mean than temperature today. But 14 regional during the changes Pliocene on and Pleistocene,<br />
land were larger. Most approximately of Canada the was past under five an million ice sheet. years. New Figure York 2(b) City shows was buried higher under temporal that resolution, so that
2° Multi-Met<br />
Sea Leve
Sea level change<br />
20 meters in 400 years<br />
Fleming et al. 1998, Fleming 2000, & Milne et al. 2005
Feedbacks
Feedbacks<br />
A<br />
B<br />
Positive (amplifying)<br />
Negative (dampening)<br />
Changes are amplified.<br />
Makes ”regime shifts” possible.<br />
Can be destructive.<br />
The system oscillates within limits.<br />
Creates stability.<br />
Overcorrecting can make the system crash.
Albedo feedback<br />
80%<br />
20%<br />
ice/snow<br />
water<br />
DN 22 mars, 2009. Foto: Nick Cobbing
From Ice-age to warm period<br />
More<br />
solar energy<br />
Warmer<br />
climate<br />
Melting of<br />
glaciers<br />
More solar<br />
energy is<br />
converted to<br />
heat<br />
Darker land<br />
and ocean
From Ice-age to warm period<br />
More<br />
solar energy<br />
Warmer<br />
climate<br />
Warmer<br />
oceans<br />
Increased<br />
greenhouse<br />
effect<br />
Release of<br />
CO2
Tipping point<br />
Tipping point: The threshold where a small further variation<br />
can cause considerable change in the system.<br />
Resiliens: a system's ability to absorb shocks and continue to<br />
operate in a similar way as before.
Four frightening Tipping Points<br />
Polar Ice Melting<br />
Methane Burp<br />
Widespread drought<br />
Shutdown of Ocean Currents
Amazon rainforest<br />
2005: 100-years drought<br />
2010: Next 100-years drought<br />
1,6 billion tons of carbon<br />
2,2 billion tons of carbon
Extreme weather is a product of Climate Change<br />
http://www.scientificamerican.com/article.cfmid=extreme-weather-caused-by-climate-change
Sommarvärme i Europa<br />
Normal Climate<br />
Future Climate<br />
Average temperatures june-august<br />
Zürich, Basel, Bern & Geneve<br />
1864-2003<br />
june-august 2003<br />
South Europe june-aug 2003:<br />
✓ 30.000 dead<br />
✓ Crop failure<br />
✓ Lack of electricity and Water<br />
✓ Large forest fires<br />
Schär et al. 2004, Nature 427, 332-336
Russia summer of 2010<br />
http://blogs.sacbee.com<br />
Source: AFP
Pakistan summer of 2010<br />
August 18, 2009 August 17, 2010<br />
Indus River<br />
earthobservatory.nasa.gov<br />
http://www.defence.pk/
Climate<br />
Phosphorus,<br />
Nitrogen<br />
Chemical waste<br />
Land use Water Ocean acidification<br />
Ozone Aerosols Biodiversity
Why don’t we react<br />
Our brain has, through thousands of<br />
generations, developed a skill to<br />
predict risk and avoid harmful or<br />
deadly situations.<br />
We react when we face: Fast moving objects and situations, Colour,<br />
Smell, Taste, Pattern, Fear, Greed, Happiness, Sex, Moral issues, ...<br />
But neither anthropogenic changes, nor their causes,<br />
Charles Darwin 1879<br />
trigger human instincts.<br />
We only understand them through our intellect.
The Climate System<br />
Atmosphere<br />
(air)<br />
Anthroposphere<br />
(mankind)<br />
Hydrosphere<br />
(water)<br />
Dynamic, continuously changing.<br />
Positive/negative feedback<br />
Non-linear<br />
Irreversible<br />
Biosphere<br />
(plants and animals)<br />
Crysphere<br />
(snow and ice)<br />
Geosphere<br />
(land)
Understanding the World<br />
Reductionism: If you understand the details, you<br />
also get the big picture. (Descartes, 1596-1650)<br />
Deterministic mechanics: The Earth is governed by<br />
precise and predictable laws. (Newton, 1643-1727).<br />
Complex systems: Systems containing life.<br />
These systems have the ability to learn, select, adapt and<br />
reorganize themselves. Natural law specify general conditions, but can<br />
not describe the developments.<br />
The systems can occur in several ways, as different "regimes".<br />
They are irreversible: they can not "go back".
Complex Adaptive System, CAS<br />
1. Diversity among components<br />
2. Interaction (flow of energy/nutrition/information)<br />
3. Selection processes and learning within the system<br />
Complicated,<br />
The Economy: Forest: Immune Game World: of Poker:<br />
Complex but system: Complex<br />
Adaptive not Complex<br />
Complex Adaptive Adaptive<br />
System<br />
System<br />
System
cold normal warm<br />
Weather If is you to can’t calculate tell us if it’s going to rain or not<br />
how every two weeks bean from, rolls. how can you say anything<br />
about the climate ten years ahead<br />
Climate is to see<br />
how they landed.
martin.hedberg@swc.se
Greenhouse gas<br />
A gas that can absorb and<br />
emit IR-radiation (heat).<br />
H2O<br />
CO2<br />
CH4<br />
N2O<br />
O3<br />
CFC’s
How deep can you<br />
see in a lake<br />
How transparent is<br />
the air regarding heat<br />
-It depends on the<br />
opacity,<br />
i.e. ”muddiness”.<br />
It depends on the<br />
opacity,<br />
i.e. greenhouse gases.
Colder and thinner<br />
with height.<br />
−60º<br />
−50º<br />
The higher up, the colder<br />
−40º<br />
−30º<br />
−20º<br />
−10º<br />
0º<br />
+10º
Energy to and from the Earth<br />
From the Sun: 1366 W/m 2<br />
Reflected: 406 W/m 2<br />
239,5 W/m 2<br />
Radiation 240 W/m<br />
X<br />
2<br />
−18ºC<br />
colder<br />
−18ºC<br />
960 W/m 2 H2O<br />
CO2<br />
CH4<br />
N2O<br />
O3<br />
Freons<br />
The difference heat up:<br />
✓ Ocean<br />
✓ Atmosphere<br />
✓ Land<br />
✓ Glaciers
Carbon dioxide in the atmosphere<br />
160 billion tons of forest<br />
+ 330 billion tons fossil carbon<br />
390 ppm<br />
280 ppm<br />
www.esrl.noaa.gov/gmd/ccgg/trends
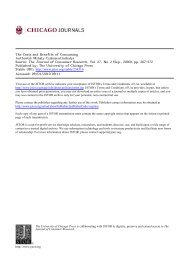
Roger Revelle and Hans E. Suess, 1957<br />
“Carbon Dioxide Exchange Between Atmosphere and Ocean and the Question of<br />
an Increase of Atmospheric CO2 during the Past Decades.” Tellus 1957.<br />
Svante Arrhenius, 1896<br />
“On the influence of carbonic acid in the air upon<br />
the temperature of the ground.”<br />
Joseph Fourier, 1824<br />
"Remarques Générales Sur Les Températures Du Globe Terrestre Et Des Espaces<br />
Planétaires." Annales de Chemie et de Physique 27: 136-67.
Politician knew. 1965<br />
Lyndon Johnson. Special message to Congress, 1965:<br />
”This generation has altered the composition<br />
of the atmosphere on a global scale<br />
through ... a steady increase in carbon dioxide<br />
from the burning of fossil fuels.”<br />
Naomi Oreskes 2010. http://www.youtube.com/watchv=2T4UF_Rmlio<br />
Lyndon Baines Johnson (1908– 1973)<br />
United States Vice President 1961-63,<br />
President 1963-69
Skeptical Science April 20, 2010
Aerosols<br />
Kina den 12 juni, 2008 (NASA)
extra<br />
100-1000 years<br />
Greenhouse gases<br />
Warming<br />
extra<br />
Weeks-Months<br />
Aerosols<br />
Cooling
Change of Radiative forcing<br />
IPCC 2007 WG1 AR4
OK, the warming comes from GHG,<br />
But where does the GHG come from
Volcanos<br />
Emissions from LARGE volcanos (ex Pinatubo 1991):<br />
✓Aerosols: 20 million tons of sulfur dioxide (SO2) reflected<br />
sunlight and decreased the global temperature by up to 0,6<br />
ºC for 1-3 years.<br />
✓CO2: Total amount was equal to 12 hrs of human emissions.<br />
Human emission of CO2 is 150 times bigger than all volcanos<br />
together.<br />
The sulfur dioxide from large volcanos, together with chlorine<br />
from CFC’s, also destroy stratospheric ozone.<br />
Pinatubo Volcano (90 km NW of Manila city, Philippines), June 15 1991<br />
http://earth.esa.int/applications/data_util/SARDOCS/spaceborne/Radar_Applications/Land_Applications/lahars_deposits_mount_pinatubo_philippines.htm<br />
http://volcanoes.usgs.gov/hazards/gas/index.php
Sunspots<br />
solarscience.msfc.nasa.gov
Global Temperature index<br />
Medelvärdet 1951-1980<br />
Last uppdated: 2011-01-12<br />
http://data.giss.nasa.gov/gistemp/graphs/
760 G ton C +4/year<br />
(∼600 G ton C)<br />
− 4/year<br />
+ 212 Gt C<br />
+ 8 Gt C<br />
- 216 Gt C<br />
Human activities
What increased the CO2<br />
160 billion tons<br />
of deforestation<br />
330 billion tons<br />
of fossil carbon
Ocean acidification<br />
Change of sea surface pH from 1700 untill1990.<br />
Jeremy Jacquot, June 12th, 2008<br />
www.scienceprogress.org
~ 20%<br />
Fate of Anthropogenic CO 2 Emissions (2000-2007)<br />
Atmosphere<br />
~ 46%<br />
(1.5 Pg Carbon /yr)<br />
Land<br />
~ 80% ~ 29%<br />
+<br />
4.2 Pg Carbon/yr<br />
2.6 Pg Carbon/yr<br />
(7.5 Pg Carbon /yr)<br />
Oceans<br />
~ 26%<br />
2.3 Pg Carbon/yr<br />
Down<br />
~ 5%<br />
Canadell et al. 2007, PNAS (updated)<br />
Robert W. Corell. The H. John Heinz Center for Science, Economics and the Environment<br />
John D. Sterman. MIT Sloan School of Management
” There is a lot more fossil fuel available<br />
on Earth than what will be possible to<br />
use, due to its impact on climate.”<br />
Bert Bolin, 1974
Emissions of fossil carbon 1850-2007<br />
9000<br />
8000<br />
7000<br />
☛<br />
75% chance to<br />
make the 2°-goal.<br />
☛<br />
☛<br />
http://www.copenhagendiagnosis.com/<br />
❚ Peak 2010 −3,7 %/år<br />
❚ Peak 2015 −5,3 %/år<br />
❚ Peak 2020 −9,0 %/år<br />
Million tons per year<br />
6000<br />
5000<br />
4000<br />
3000<br />
2000<br />
1000<br />
Total carbon emissions<br />
Gas fuel consumption<br />
Liquid fuel consumption<br />
Solid fuel consumption<br />
Cement production<br />
Gas flaring<br />
0<br />
1850 1900 1950 2000 2050<br />
År<br />
Carbon Dioxide Information Analysis Center 2009-10-22. http://cdiac.ornl.gov
Jordens befolkning<br />
Världen år 2050:<br />
Konstant ökning 12<br />
Hög 11<br />
Medel 9<br />
Låg 8 miljarder inv.<br />
Miljoner invånare (logaritmisk skala)<br />
År<br />
FN 2006 (http://esa.un.org/unpp/)<br />
swc.se
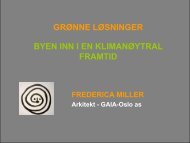
The alternative
Hack the climate<br />
1. Deflect sunlight back into space<br />
Fast, Cheap and Uncertain. Does not deal with<br />
the actual problem.<br />
2. Draw down CO2 from atmosphere<br />
Slow and expensive, but it can reduce the carbon.
Geo-engineering<br />
L19703<br />
ROBOCK ET AL.: BENEFITS, RISKS, AND C<br />
3 ROBOCK ET AL.: BENEFITS, RISKS, AND COSTS OF GEOENGINEERING L19703<br />
e 1. Proposed methods of stratospheric aerosol injection. A mountain top location would require less energy for<br />
g to stratosphere. Drawing by Brian West.<br />
aller ones These important topics are currently being<br />
tigated by us, and here we limit the discussion to just<br />
g the precursor gases into the stratosphere.<br />
Gunnbjorn Mountain, Greenland, is the highest point in the<br />
Arctic, reaching an altitude of 3700 m. In the tropics, there<br />
are multiple high altitude locations in the Andes.<br />
Table 1. Benefits and Risks of Stratospheric Geoengineering a<br />
Benefits<br />
Risks<br />
1. Cool planet 1. Drought in Africa and Asia<br />
2. Reduce or reverse<br />
2. Continued ocean acidification<br />
sea ice melting<br />
from CO 2<br />
3. Reduce or reverse land 3. Ozone depletion<br />
ice sheet melting<br />
4. No more blue skies<br />
4. Reduce or reverse<br />
5. Less solar power<br />
sea level rise<br />
6. Environmental impact<br />
5. Increase plant productivity of implementation<br />
6. Increase terrestrial CO 2 sink 7. Rapid warming if stopped<br />
8. Cannot stop effects quickly<br />
9. Human error<br />
10. Unexpected consequences<br />
11. Commercial control<br />
12. Military use of technology<br />
13. Conflicts with current treaties<br />
14. Whose hand on the thermostat<br />
15. Ruin terrestrial optical astronomy<br />
16. Moral hazard – the prospect<br />
of it working would reduce<br />
drive for mitigation<br />
17. Moral authority – do we have<br />
the right to do this<br />
a The right column is an update of Robock [2008a].<br />
Robock, A., A. Marquardt, B. Kravitz, and G. Stenchikov (2009), Benifits, risks, and costs of<br />
stratospheric geoengineering, Geophys. Res. Lett., 36, L19703, doi:10.1029/2009GL039209.<br />
et al., 2002, 2003; Wigley, 2006; Rasch et al., 2008a, 2008b;<br />
perma<br />
the op<br />
episod<br />
respon<br />
Never<br />
engin<br />
to cou<br />
produ<br />
3. R<br />
[8]<br />
must<br />
negat<br />
conce<br />
As dis<br />
direct<br />
Kravi<br />
acid d<br />
And<br />
based<br />
comp<br />
long l<br />
[9]<br />
by rec
Geo-engineering<br />
Scientists say: ”It could offer strategies of last resort<br />
if abrupt, catastrophic or otherwise unacceptable<br />
climate-change impacts become unavoidable.”<br />
✓ Large uncertainties about the outcome.<br />
✓ How to decide when to start<br />
✓ Once you started: Can you stop<br />
✓ Who makes the decisions<br />
✓ Physical/Political/Legal risks
Choices<br />
There is enough renewable energy for mankind. But we lack<br />
the infrastructure and global political/economical incentives()<br />
to reduce the mining of fossil carbon.<br />
1. To leave oil, gas and coal in the ground for other reasons<br />
than economical or technical seem unlikely.<br />
2. Geo-engineering is cheap and bad, or expensive and slow.<br />
And comes with large risks.<br />
3. Accept catastrophes and try to adapt is very uncomfortable.<br />
Consequences can not be reversed.
Uncertainty favours Inaction
Deal with Climate<br />
Peak Oil/Reduced<br />
mining of fossil carbon.<br />
Geopolitical<br />
consequences<br />
Adaptation to Climate<br />
changes<br />
Infrastructure for<br />
energy safety<br />
Production of food &<br />
water<br />
Social and financial<br />
crisis
<strong>Martin</strong> <strong>Hedberg</strong><br />
martin.hedberg@swc.se<br />
+ 46 70 601 04 05