Statistics Review For Test - Faculty & Staff, Georgia Perimeter College
Statistics Review For Test - Faculty & Staff, Georgia Perimeter College
Statistics Review For Test - Faculty & Staff, Georgia Perimeter College

You also want an ePaper? Increase the reach of your titles
YUMPU automatically turns print PDFs into web optimized ePapers that Google loves.
<strong>Statistics</strong> <strong>Review</strong> for <strong>Test</strong> 1<br />
(Sections 1.1 - 2.3)<br />
Name___________________________________<br />
SHORT ANSWER. Write the word or phrase that best completes each statement or answers the question.<br />
Solve the problem.<br />
1) What is statistics 1)<br />
MULTIPLE CHOICE. Choose the one alternative that best completes the statement or answers the question.<br />
2) Parking at a large university has become a very big problem. University administrators are<br />
interested in determining the average parking time (e.g. the time it takes a student to find a<br />
parking spot) of its students. An administrator inconspicuously followed 290 students and<br />
carefully recorded their parking times. Identify the population of interest to the university<br />
administration.<br />
A) the entire set of students that park at the university<br />
B) the students that park at the university between 9 and 10 AM on Wednesdays<br />
C) the entire set of faculty, staff, and students that park at the university<br />
D) the 290 students from whom the data were collected<br />
2)<br />
SHORT ANSWER. Write the word or phrase that best completes each statement or answers the question.<br />
3) Administrators at a large university want to know the average debt incurred by their<br />
graduates. Surveys were mailed to 260 graduating seniors asking them to report their<br />
total student loan debt. Identify the population, sample, and individuals in the study.<br />
3)<br />
MULTIPLE CHOICE. Choose the one alternative that best completes the statement or answers the question.<br />
4) Which branch of statistics deals with the organization and summarization of collected<br />
information<br />
A) Descriptive statistics B) Computational statistics<br />
C) Survey design D) Inferential statistics<br />
4)<br />
Provide an appropriate response.<br />
5) A meteorologist constructs a graph showing the total precipitation in Phoenix, Arizona in each of<br />
the months of 1998. Does this involve descriptive statistics or inferential statistics<br />
A) Inferential statistics B) Descriptive statistics<br />
5)<br />
Solve the problem.<br />
6) Classify the number of complaint letters received by the United States Postal Service in a given day<br />
as qualitative data or quantitative data.<br />
A) qualitative data B) quantitative data<br />
6)<br />
Identify the following variable as either qualitative or quantitative.<br />
7) Waiting time at a bus stop (in minutes).<br />
A) Qualitative B) Quantitative<br />
7)<br />
1
8) The color of your house.<br />
A) Quantitative B) Qualitative<br />
8)<br />
Solve the problem.<br />
9) Classify the following random variable according to whether it is discrete or continuous.<br />
The speed of a car on a Los Angeles freeway during rush hour traffic<br />
A) discrete B) continuous<br />
9)<br />
10) Classify the following random variable according to whether it is discrete or continuous.<br />
The number of goals scored in a soccer game<br />
A) continuous B) discrete<br />
10)<br />
Solve the problem.<br />
11) What method of data collection would you use to collect data for a study where a political pollster<br />
wishes to determine if his candidate is leading in the polls<br />
A) observational study B) designed experiment<br />
11)<br />
12) True or False: Designed experiments assist the researcher in isolating the causes of the<br />
relationships that exist between two variables.<br />
A) True B) False<br />
12)<br />
Solve the problem.<br />
13) The city council of a small town needs to determine if the townʹs residents will support the<br />
building of a new library. The council decides to conduct a survey of a sample of the townʹs<br />
residents. Which one of the following procedures would be most appropriate for obtaining a<br />
sample of the townʹs residents<br />
A) Survey a random sample of librarians who live in the town.<br />
B) Survey 300 individuals who are randomly selected from a list of all people living in the state<br />
in which the town is located.<br />
C) Survey a random sample of persons within each neighborhood of the town.<br />
D) Survey every 14th person who enters the old library on a given day.<br />
13)<br />
List all possible samples from the specified population.<br />
14) The members of a board of directors have the following roles: president (P), vice president (V),<br />
secretary (S), treasury (T), and fundraiser (F). Consider these board members to be a population of<br />
interest. List the 10 possible samples (without replacement) of size two from this population of five<br />
board members.<br />
A) S,T S,F T,P T,V T,S T,F F,P F,V F,S F,T<br />
B) P,V P,S P,T P,F V,P V,S V,T V,F S,P S,V<br />
C) P,V P,S P,T P,F V,S V,T V,F S,T S,F T,F<br />
D) P,P P,V P,S P,T P,F V,V V,S V,T V,F S,S<br />
14)<br />
2
SHORT ANSWER. Write the word or phrase that best completes each statement or answers the question.<br />
Use the random number table in Appendix A or the random number generator in a calculaor to obtain the required list<br />
of random numbers.<br />
15) A medical researcher is conducting clinical trials. Of the 60 people participating in the 15)<br />
trial, 20 will receive a placebo, 20 will receive the experimental drug, and 20 will constitute<br />
the control group. The 20 people who will receive the drug will be selected at random.<br />
Construct a list of 20 random numbers between 1 and 60 which can be used in obtaining<br />
the required simple random sample. (Start with the numbers in row 13 and columns 35<br />
and 36.)<br />
TRUE/FALSE. Write ʹTʹ if the statement is true and ʹFʹ if the statement is false.<br />
Provide an appropriate response.<br />
16) True or false In simple random sampling, each possible sample of a fixed size is equally likely to<br />
be the one obtained.<br />
16)<br />
SHORT ANSWER. Write the word or phrase that best completes each statement or answers the question.<br />
17) A college lecturer has devised a new method of teaching a particular mathematical<br />
concept and wishes to try out this teaching method on a representative sample of his<br />
students. There are 76 students in his class and he wishes to obtain a simple random<br />
sample of 25 of them. Describe a method he could use to obtain the sample.<br />
17)<br />
3
MULTIPLE CHOICE. Choose the one alternative that best completes the statement or answers the question.<br />
18) Select a random sample of five state capitals from the list below using the two digit list of random<br />
numbers provided. Begin with the uppermost left random number and proceed down each<br />
column. When a column is complete, use the numbers at the top of the next right column and<br />
proceed down that column.<br />
18)<br />
State Capitals<br />
A) Springfield, IL; Atlanta,GA; Providence, RI; Santa Fe, NM; Columbus OH.<br />
B) Boston, MA; Concord, NH; Dover DE; Santa Fe, NM; Richmond, VA.<br />
C) Springfield, IL; Des Moines, IA; Boston, MA; Santa Fe, NM; Columbus OH.<br />
D) Carson City NV; Boise ID; Atlanta, GA; Cheyenne, WY; Boston, MA.<br />
Solve the problem.<br />
19) A market researcher randomly selects 400 drivers under 65 years of age and 300 drivers over 65<br />
years of age. What sampling technique was used<br />
A) systematic<br />
B) convenience<br />
C) stratified<br />
D) random<br />
E) cluster<br />
19)<br />
4
20) A researcher for an airline interviews all of the passengers on five randomly selected flights. What<br />
sampling technique is used<br />
A) systematic<br />
B) cluster<br />
C) convenience<br />
D) random<br />
E) stratified<br />
20)<br />
21) Every fifth teenager entering a concert is checked for possession of drugs. What sampling<br />
technique is used<br />
A) stratified<br />
B) cluster<br />
C) random<br />
D) convenience<br />
E) systematic<br />
21)<br />
22) A lobbyist for a major airspace firm assigns a number to each legislator and then uses a computer<br />
to randomly generate ten numbers. The lobbyist contacts the legislators corresponding to these<br />
numbers. What sampling technique was used<br />
A) stratified<br />
B) systematic<br />
C) convenience<br />
D) random<br />
E) cluster<br />
22)<br />
SHORT ANSWER. Write the word or phrase that best completes each statement or answers the question.<br />
Provide an appropriate response.<br />
23) A tax auditor has a pile of 191 tax returns of which he would like to select 17 for a special<br />
audit. Describe a method for selecting the sample which involves systematic random<br />
sampling.<br />
23)<br />
Solve the problem.<br />
24) A local newspaper ran a survey by asking, ʺDo you support the deployment of a weapon<br />
that could kill millions of innocent peopleʺ Determine whether the survey design or the<br />
sampling method is biased.<br />
24)<br />
MULTIPLE CHOICE. Choose the one alternative that best completes the statement or answers the question.<br />
Identify the study as an observational study or a designed experiment.<br />
25) In a clinical trial, 780 participants suffering from high blood pressure were randomly assigned to<br />
one of three groups. Over a one-month period, the first group received the experimental drug, the<br />
second group received a placebo, and the third group received no treatment. The diastolic blood<br />
pressure of each participant was measured at the beginning and at the end of the period and the<br />
change in blood pressure was recorded. The average change in blood pressure was calculated for<br />
each of the three groups and the three averages were compared.<br />
A) Designed experiment B) Observational study<br />
25)<br />
5
26) An educational researcher used school records to determine that, in one school district, 84% of<br />
children living in two-parent homes graduated high school while 75% of children living in<br />
single-parent homes graduated high school.<br />
A) Designed experiment B) Observational study<br />
26)<br />
Solve the problem.<br />
27) The object upon which the response variable is measured is called ________ .<br />
A) the factor B) an experimental unit<br />
C) a treatment D) the predictor variable<br />
27)<br />
A designed experiment is described. Identify the specified element of the experiment.<br />
28) In a clinical trial, 780 participants suffering from high blood pressure were randomly assigned to<br />
one of three groups. Over a one-month period, the first group received a low dosage of an<br />
experimental drug, the second group received a high dosage of the drug, and the third group<br />
received a placebo. The diastolic blood pressure of each participant was measured at the beginning<br />
and at the end of the period and the change in blood pressure was recorded. Identify the response<br />
variable.<br />
A) The treatment received (placebo, low dosage, high dosage)<br />
B) The dosage of the drug<br />
C) The participants in the experiment<br />
D) Change in diastolic blood pressure<br />
28)<br />
29) An education researcher was interested in examining the effect of the teaching method and the<br />
effect of the particular teacher on studentsʹ scores on a reading test. In a study, there are four<br />
different teachers (Juliana, Felix, Sonia, and Helen) and three different teaching methods (method<br />
A, method B, and method C). The number of students participating in the study is 258. Students<br />
are randomly assigned to a teaching method and teacher. Identify the response variable.<br />
A) Teacher B) Score on reading test<br />
C) Teaching method D) Method A, method B, method C<br />
29)<br />
30) A medical journal published the results of an experiment on depression. The experiment<br />
investigated the effects of a controversial new therapy for depression. Researchers measured the<br />
depression levels of 80 adult women who suffer moderate conditions of the disorder. After the<br />
therapy, the researchers again measured the womenʹs depression levels. The differences between<br />
the the pre- and post-therapy depression levels were reported. What is the response variable in<br />
this experiment<br />
A) the differences between the the pre- and post-therapy depression levels<br />
B) the disorder (depression or no depression)<br />
C) the 80 adult women who suffer from depression<br />
D) the therapy<br />
30)<br />
6
SHORT ANSWER. Write the word or phrase that best completes each statement or answers the question.<br />
Solve the problem.<br />
31) The preschool children at Elmwood Elementary School were asked to name their favorite<br />
color. The results are listed below.<br />
31)<br />
yellow yellow red purple blue<br />
blue blue yellow blue red<br />
blue red purple purple purple<br />
red blue purple blue green<br />
Construct a frequency distribution and a relative frequency distribution.<br />
MULTIPLE CHOICE. Choose the one alternative that best completes the statement or answers the question.<br />
32)<br />
32)<br />
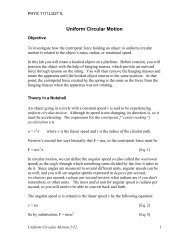
The bar graph below shows the political party affiliation of 1,000 registered U.S. voters. What<br />
percentage of the 1,000 registered U.S. voters belonged to one of the traditional two parties<br />
(Democratic and Republican)<br />
A) 40% B) 35% C) 75% D) 25%<br />
7
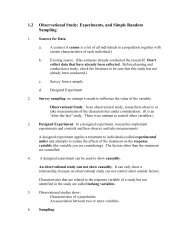
The following double-bar graph illustrates the revenue for a company for the four quarters of the year for two different<br />
years. Use the graph to answer the question.<br />
33) In what quarter was the revenue the greatest for 2000<br />
A) first quarter B) third quarter C) second quarter D) fourth quarter<br />
33)<br />
SHORT ANSWER. Write the word or phrase that best completes each statement or answers the question.<br />
Solve the problem.<br />
34) Scott Tarnowski owns a pet grooming shop. His prices for grooming dogs are based on the<br />
size of the dog. His records from last year are summarized below.<br />
34)<br />
Class<br />
Frequency<br />
Large 345<br />
Medium 830<br />
Small 645<br />
Portray the data in a pie chart using the class percentages.<br />
35) A random sample of 30 high school students is selected. Each student is asked how much<br />
time he or she spent watching television during the previous week. The following times<br />
(in hours) are obtained:<br />
35)<br />
11, 19, 13, 16, 13, 11, 13, 12, 10, 16, 14, 12, 12, 11, 14, 13, 10, 10, 15, 12, 10, 12, 19, 14, 11, 15,<br />
11, 14, 13, 12<br />
Construct a frequency distribution for the data.<br />
8
36) A random sample of 30 high school students is selected. Each student is asked how much<br />
time he or she spent watching television during the previous week. The following times<br />
(in hours) are obtained:<br />
36)<br />
6, 14, 8, 11, 8, 6, 8, 7, 5, 11, 9, 7, 7, 6, 9, 8, 5, 5, 10, 7, 5, 7, 14, 9, 6, 10, 6, 9, 8, 7<br />
Construct a histogram for this data. You may use a calculator to help. Be sure to label the<br />
axes.<br />
Construct a frequency distribution for the given data. Use the symbol -< to mean ʺup to, but not includingʺ.<br />
37) Lori asked 24 students how many hours they had spent doing homework during the 37)<br />
previous week. The results are shown below.<br />
11 11 11 8 11 11 14 12 11 8 12 11<br />
11 12 11 11 12 11 11 12 11 12 12 8<br />
Construct a frequency table. Use 4 classes, a class width of 2 hours, and a lower limit of 8<br />
for class 1. (Note that this data is continuous even though it has been rounded to a whole<br />
number of hours.)<br />
Hours Frequency<br />
Provide the requested table entry.<br />
38) The data in the following table reflect the amount of time 40 students in a section of<br />
<strong>Statistics</strong> 101 spend on homework each day. Determine the value that should be entered in<br />
the Relative Frequency column for the class 75-89.<br />
38)<br />
Homework Time<br />
(minutes)<br />
Number of<br />
Students<br />
0-< 15 2<br />
15-< 30 4<br />
30-< 45 10<br />
45-< 60 16<br />
60-< 75 6<br />
75-< 90 2<br />
Relative<br />
Frequency<br />
9
Construct the specified histogram.<br />
39) The frequency table below shows the number of days off in a given year for 30 police<br />
detectives. (Note that 0-
42) The Highway Patrol, using radar, checked the speeds (in mph) of 30 passing motorists at a<br />
checkpoint. The results are listed below. Construct a dot plot for the data.<br />
42)<br />
44 38 41 50 36 36 43 42 49 48<br />
35 40 37 41 43 50 45 54 39 38<br />
50 41 47 36 35 40 42 43 48 33<br />
MULTIPLE CHOICE. Choose the one alternative that best completes the statement or answers the question.<br />
Solve the problem.<br />
43) Describe the shape of the distribution.<br />
43)<br />
A) uniform B) symmetric<br />
C) skewed to the left D) skewed to the right<br />
Use the histograms shown to answer the question.<br />
44)<br />
44)<br />
Is either histogram symmetric<br />
A) The second is symmetric, but the first is not symmetric.<br />
B) Both are symmetric.<br />
C) Neither is symmetric.<br />
D) The first is symmetric, but the second is not symmetric.<br />
11
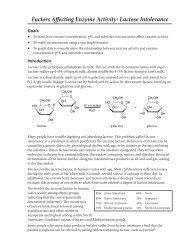
A graphical display of a data set is given. State whether the distribution is (roughly) symmetric, right skewed, or left<br />
skewed.<br />
45) The ages of a group of patients being treated at one hospital for osteoporosis are summarized in 45)<br />
the frequency histogram below.<br />
A) Left skewed B) Symmetric C) Right skewed<br />
Explain what is misleading about the graphic.<br />
46)<br />
46)<br />
A) The graphic only includes information for one year.<br />
B) The horizontal scale does not begin at zero.<br />
C) The graphic may give the impression that drivers over age 65 had no DUIʹs in 2001.<br />
D) The graphic is not misleading.<br />
12
47)<br />
47)<br />
A) The horizontal label is incomplete.<br />
B) The vertical scale does not begin at zero.<br />
C) The trend is depicted in the wrong direction.<br />
D) The graphic is not misleading.<br />
SHORT ANSWER. Write the word or phrase that best completes each statement or answers the question.<br />
Provide an appropriate response.<br />
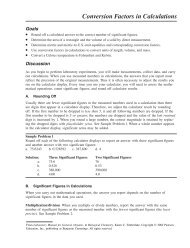
48) A television manufacturer sold three times as many televisions in 1995 as it did in 1985. To<br />
illustrate this fact, the manufacturer draws a pictogram as shown below. The television on<br />
the right is three times as tall and three times as wide as the television on the left.<br />
48)<br />
Why is this pictogram misleading What visual impression is portrayed by the pictogram<br />
13
Answer Key<br />
<strong>Test</strong>name: REVIEW FOR STAT TEST1 SUN09<br />
1) <strong>Statistics</strong> is the science of data that involves collecting, summarizing, organizing, analyzing information in order to<br />
draw conclusions.<br />
2) A<br />
3) The population of interest is the student loan debt incurred by all graduates of the university. The sample is student<br />
loan debt of the 260 graduating seniors that were collected by the university administrators. The individuals are each<br />
graduating senior whose student loan debt was recorded.<br />
4) A<br />
5) B<br />
6) B<br />
7) B<br />
8) B<br />
9) B<br />
10) B<br />
11) A<br />
12) A<br />
13) C<br />
14) C<br />
15) 50, 29, 30, 40, 53, 33, 45, 39, 20, 13, 3, 41, 18, 8, 5, 60, 4, 22, 26, 15<br />
16) TRUE<br />
17) Answers will vary. Possible answer: List the studentsʹ names alphabetically and assign them numbers 1 to 76<br />
according to this list. Use a random number table to construct a list of 25 random numbers between 1 and 76 and<br />
select the students corresponding to those numbers.<br />
18) A<br />
19) C<br />
20) B<br />
21) E<br />
22) D<br />
23) Answers will vary. Possible answer: The tax auditor could number the returns 1 through 191. He could then use a<br />
random number table to select a number at random between 1 and 11. Starting with that number, he could list every<br />
11th number until he has 17 numbers. He could then select the tax returns corresponding to the numbers listed.<br />
24) The wording of the question is biased, as it tends to encourage negative responses.<br />
25) A<br />
26) B<br />
27) B<br />
28) D<br />
29) B<br />
30) A<br />
31)<br />
Color Frequency Relative Frequency<br />
yellow 3 0.15<br />
red 4 0.20<br />
purple 5 0.25<br />
blue 7 0.35<br />
green 1 0.05<br />
32) C<br />
33) D<br />
14
Answer Key<br />
<strong>Test</strong>name: REVIEW FOR STAT TEST1 SUN09<br />
34)<br />
35)<br />
Hours Number of<br />
of TV HS Students<br />
10 4<br />
11 5<br />
12 6<br />
13 5<br />
14 4<br />
15 2<br />
16 2<br />
19 2<br />
36) (Note that the bars are centered over the data values.)<br />
Television Watching During a Week<br />
37) (Note that 8-< 10 means all values from 8, including 8, up to 10 ,but not including 10. The same meaning is also used<br />
for the other intervals.)<br />
Hours Frequency<br />
8-
Answer Key<br />
<strong>Test</strong>name: REVIEW FOR STAT TEST1 SUN09<br />
39) Number of Days off in Year for Police Detectives<br />
40) Answers will vary. Possible answer: In a grouped-data table, each observation must belong to one and only one class.<br />
In Annaʹs table, there is overlap of the classes - it is not clear, for example, to which class the value 3 belongs. The<br />
classes could have been depicted in either of the following ways:<br />
41)<br />
0 3 9 9<br />
1<br />
2 2<br />
3 2 3 9 9<br />
4 2 9<br />
5 2 8<br />
6<br />
7 0<br />
Number of sick days taken<br />
0-
Answer Key<br />
<strong>Test</strong>name: REVIEW FOR STAT TEST1 SUN09<br />
42)<br />
43) D<br />
44) C<br />
45) A<br />
46) C<br />
47) B<br />
48) Answers will vary. Possible answer: The area of the television on the right is nine times (not three times) the area of<br />
the television on the left. The pictogram gives the visual impression that sales in 1995 were nine times the sales in<br />
1985.<br />
17