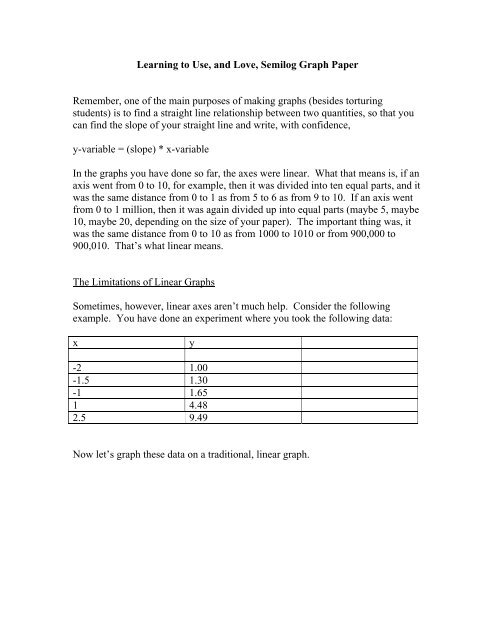
Learning to Use, and Love, Semilog Graph Paper
Learning to Use, and Love, Semilog Graph Paper
Learning to Use, and Love, Semilog Graph Paper

You also want an ePaper? Increase the reach of your titles
YUMPU automatically turns print PDFs into web optimized ePapers that Google loves.
<strong>Learning</strong> <strong>to</strong> <strong>Use</strong>, <strong>and</strong> <strong>Love</strong>, <strong>Semilog</strong> <strong>Graph</strong> <strong>Paper</strong><br />
Remember, one of the main purposes of making graphs (besides <strong>to</strong>rturing<br />
students) is <strong>to</strong> find a straight line relationship between two quantities, so that you<br />
can find the slope of your straight line <strong>and</strong> write, with confidence,<br />
y-variable = (slope) * x-variable<br />
In the graphs you have done so far, the axes were linear. What that means is, if an<br />
axis went from 0 <strong>to</strong> 10, for example, then it was divided in<strong>to</strong> ten equal parts, <strong>and</strong> it<br />
was the same distance from 0 <strong>to</strong> 1 as from 5 <strong>to</strong> 6 as from 9 <strong>to</strong> 10. If an axis went<br />
from 0 <strong>to</strong> 1 million, then it was again divided up in<strong>to</strong> equal parts (maybe 5, maybe<br />
10, maybe 20, depending on the size of your paper). The important thing was, it<br />
was the same distance from 0 <strong>to</strong> 10 as from 1000 <strong>to</strong> 1010 or from 900,000 <strong>to</strong><br />
900,010. That’s what linear means.<br />
The Limitations of Linear <strong>Graph</strong>s<br />
Sometimes, however, linear axes aren’t much help. Consider the following<br />
example. You have done an experiment where you <strong>to</strong>ok the following data:<br />
x<br />
y<br />
-2 1.00<br />
-1.5 1.30<br />
-1 1.65<br />
1 4.48<br />
2.5 9.49<br />
Now let’s graph these data on a traditional, linear graph.
10<br />
9<br />
8<br />
7<br />
6<br />
5<br />
4<br />
3<br />
2<br />
1<br />
0<br />
-4 -3 -2 -1 0 1 2 3<br />
Wow, that’s really not helpful. I wouldn’t want <strong>to</strong> guess at what kind of formula<br />
that represents, but it’s sure not a straight line.<br />
Now let’s try something. Take the base 10 logarithm of each of the y values <strong>and</strong><br />
fill them in <strong>to</strong> the third column of the table.<br />
Then let’s make another plot, this time with log y on the vertical axis <strong>and</strong> x on the<br />
horizontal axis.<br />
1.6<br />
1.4<br />
1.2<br />
1<br />
0.8<br />
0.6<br />
0.4<br />
0.2<br />
0<br />
-4 -2 -0.2 0 2 4 6<br />
-0.4
Bingo! A straight line! If we were so inclined, we could take that straight line <strong>and</strong><br />
find its slope.<br />
Slope = (log y 2 – log y 1 )/(x 2 – x 1 )<br />
And then you could write, with confidence,<br />
log y = (slope) * x<br />
as the formula for your graph.<br />
This is not a difficult thing. But back in the days when dinosaurs ruled the earth,<br />
there were no calcula<strong>to</strong>rs. Logarithms had <strong>to</strong> be looked up in tables, a process just<br />
fraught with opportunities for error, not <strong>to</strong> mention fatigue. So someone got the<br />
bright idea, why don’t we figure out the logarithms ahead of time <strong>and</strong> mark their<br />
distances on the paper <strong>to</strong> start with That way, we can plot the logs without<br />
having <strong>to</strong> take those tedious logarithms all over again each time.<br />
Thus was born semi-log graph paper. See an example of it below.
The horizontal axis is linear, as it was before. The vertical axis is now marked off<br />
in UNEQUAL parts: they start off big <strong>and</strong> get smaller. (This is why it’s called<br />
“semilog” paper, because one of the two axes is linear <strong>and</strong> the other one is log.<br />
<strong>Graph</strong> paper that has both axes marked in logs is called “log-log” paper.)<br />
Look at the vertical axis. If we say that the origin is 1, then the next major mark is<br />
2, the next 3, <strong>and</strong> so on. Notice that the distance from 1 <strong>to</strong> 2 is not the same as<br />
from 2 <strong>to</strong> 3. The axis is not linear. The distance from 1 <strong>to</strong> 2 represents the log of<br />
2. The distance from 1 <strong>to</strong> 3 represents the log of 3, <strong>and</strong> so on like that. With this<br />
paper, if the y value of your data point is 4, you don’t have <strong>to</strong> go find a logarithm,<br />
you just mark your data point even with the 4 line, <strong>and</strong> its distance from the origin<br />
will be proportional <strong>to</strong> the log of 4.<br />
So, in order <strong>to</strong> graph that second data point listed above, you mark off your x-axis.<br />
Then go <strong>to</strong> –1 on the x-axis, <strong>and</strong> then look at the y-axis. The number is 1.65, so
you obviously need a point between 1 <strong>and</strong> 2. If you look at the little lines between<br />
1 <strong>and</strong> 2, you will see that there are 9 of them, not evenly spaced there either. The<br />
first one represents 1.1, the second 1.2, the third 1.3, <strong>and</strong> on like that. Find 1.65<br />
<strong>and</strong> mark the point there.<br />
Now do the same for the rest of the data points. When you are done, we’ll look at<br />
all the graphs <strong>and</strong> compare them.<br />
Believe me, before there were calcula<strong>to</strong>rs, this was one of the major time- <strong>and</strong><br />
labor-savers in scientific work.<br />
A Small But Important Point<br />
Where’s the zero on the y-axis Simple, there is none. Why not Because the log<br />
of zero is UNDEFINED (dig up that little fact from your memory banks).<br />
How Do We Get Equations From This I Thought That Was the Point<br />
Now we take the slope, same as usual, except that these distances represent logs,<br />
so the formula goes like this:<br />
Slope = (log y 2 – log y 1 )/(x 2 – x 1 )<br />
And we can say, with confidence, that log y = (slope) * x.<br />
Now, if that is true, that means that y = 10 (slope)x . Whoopee.<br />
If you have taken math for any length of time, you know that we would much<br />
rather have formulas that take the form y = e x . The function e x is so simple <strong>to</strong><br />
work with that we would rather use it if we can. That means we have <strong>to</strong> get<br />
natural (not base 10) logs in there somehow.<br />
So what we do is, we find the slope as follows:<br />
Slope = (ln y 2 – ln y 1 )/(x 2 – x 1 ) Call the slope a.<br />
And then we can write, with confidence, y = e ax , which is a nice, easy formula.<br />
Yes, you do have <strong>to</strong> find two natural logs there, but in the old days it was much<br />
preferable <strong>to</strong> find two logs for each graph than <strong>to</strong> find one for every data point.
What if My <strong>Graph</strong> Doesn’t Go Through the Origin<br />
Anytime you make a semilog graph, look at your graph <strong>and</strong> find the point on the<br />
line where x = 0. If your y value equals 1, you’re home free, <strong>and</strong> y = e ax . If it<br />
doesn’t, then let’s see how <strong>to</strong> fit that in<strong>to</strong> the equation.<br />
Suppose that at x = 0, y = A (that’s your y-intercept, for those who remember their<br />
algebra). That means that ln y = ln A when x = 0.<br />
What this boils down <strong>to</strong> is that you can then write<br />
y = A e ax<br />
Note for Those Who Want <strong>to</strong> Know Why<br />
(And if You Don’t, You Can Skip This Part, BUT Remember the Formula)<br />
ln y = ln A + (slope)*x<br />
(recall y = mx + b from your math class)<br />
the slope = a, so ln y = ln A + ax<br />
(ln A +ax)<br />
so y = e remember<br />
y = (e ln A )(e ax )<br />
your algebra!<br />
but remember e ln A = A, so<br />
y = A e ax<br />
I Have a Better Idea; or, Why Deal With Base 10 Logs At All<br />
Wouldn’t it just be easier <strong>to</strong> make log paper based on natural logs rather than base<br />
10 logs Sure, but that’s not how it’s made. When you rule the world, you can<br />
change all the graph paper <strong>to</strong> natural logs.<br />
The Axes are Flexible, Too!<br />
Another nice thing about this paper is that we can define the log axis as we need<br />
<strong>to</strong>. Suppose, for example, that the data points went like this:
x<br />
y<br />
-2 1000<br />
-1.5 1300<br />
-1 1650<br />
1 4480<br />
2.5 9490<br />
Here the y values range between 1000 <strong>and</strong> 10,000. So what we can do is say that<br />
the origin is 1,000; the next major mark is 2,000; the next is 3,000; <strong>and</strong> so on up <strong>to</strong><br />
the <strong>to</strong>p, which is 10,000. You can do that. Trust me. You can choose any range<br />
you like, as long as the bot<strong>to</strong>m value is some multiple of 10 <strong>and</strong> the <strong>to</strong>p one is 10<br />
times that.<br />
So try it. Take another piece of semilog paper, mark the y-axis <strong>to</strong> go from 1000 <strong>to</strong><br />
10,000, <strong>and</strong> graph these data. How does your new graph compare with the other<br />
semilog graph you drew<br />
But What If My Data Extend Over More Than One Range<br />
Or, The Magic of Multiple Cycles<br />
Now, look again at your graph. Your y values were all between 1 <strong>and</strong> 10.<br />
Suppose your data range from less than 1 <strong>to</strong> greater than 1000 Let’s look at<br />
another set of data:<br />
x<br />
y<br />
0 8325<br />
1 4159<br />
2 2081<br />
3 1038<br />
4 522<br />
5 260<br />
6 131<br />
7 65<br />
8 32<br />
9 17<br />
10 8
Now, our data go from less than 10 all the way up <strong>to</strong> a little less than 10,000.<br />
What do you do<br />
The piece of semilog paper we just used isn’t suitable. We can choose whether the<br />
paper goes from 1 <strong>to</strong> 10, or 10,000 <strong>to</strong> 100,000, or .001 <strong>to</strong> .01, or whatever – but we<br />
can’t make it go from 1 <strong>to</strong> 10,000. Not on this piece of paper.<br />
You could go back <strong>to</strong> putting it on linear paper, <strong>and</strong> I invite the skeptics among<br />
you <strong>to</strong> try it. But when the data are all spread out like that, it’s pretty difficult <strong>to</strong><br />
do accurate graphing on linear paper.<br />
So what we do here is, we see how many CYCLES our data encompass. What<br />
does that mean It has <strong>to</strong> do with powers of ten.<br />
Our data go roughly from 1 <strong>to</strong> 10,000. Here are the cycles:<br />
1 <strong>to</strong> 10 (our lowest number is between 1 <strong>and</strong> 10)<br />
10 <strong>to</strong> 100<br />
100 <strong>to</strong> 1000<br />
1000 <strong>to</strong> 10,000 (our highest number is between 1000 <strong>and</strong> 10,000)<br />
That will be sufficient for our data. That’s FOUR cycles (count them). The piece<br />
of semilog paper we used before had only ONE cycle, but we need FOUR for<br />
these data.<br />
So we just take four pieces of semilog paper <strong>and</strong> we put them all <strong>to</strong>gether, <strong>and</strong><br />
then shrink them so they all fit on one st<strong>and</strong>ard piece of paper. See the example<br />
below of FOUR-CYCLE semilog paper. You can have as many cycles as you<br />
like, as long as it’s still legible.
And here’s how we mark the y-axis. The origin is 1, the next major mark is 10,<br />
the next is 100, the next is 1000, <strong>and</strong> the next is 10,000. The marks between 1 <strong>and</strong><br />
10 are 2, 3, 4, <strong>and</strong> so on; between 100 <strong>and</strong> 1000 are 200, 300, 400, <strong>and</strong> so on. You<br />
get the idea.<br />
Now take the piece of 4-cycle semilog paper <strong>and</strong> graph these data. When you are<br />
finished, we’ll look at all the graphs <strong>and</strong> compare them.<br />
Congratulations! You are now an expert on how <strong>to</strong> use semilog paper. On the<br />
final exam, you will have an opportunity <strong>to</strong> show off your exceptional knowledge<br />
<strong>and</strong> skill.