Sources of Water Quality Problems in the Red Cedar River Basin
Sources of Water Quality Problems in the Red Cedar River Basin Sources of Water Quality Problems in the Red Cedar River Basin
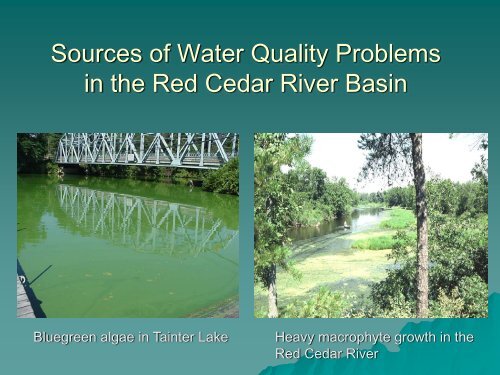
Sources of Water Quality Problems in the Red Cedar River Basin Bluegreen algae in Tainter Lake Heavy macrophyte growth in the Red Cedar River
- Page 2 and 3: Sources Lakes and streams are gener
- Page 4 and 5: The main source of phosphorus in a
- Page 6 and 7: Only soluble phosphorus grows algae
- Page 8 and 9: Rural residential sources: - Runoff
- Page 10 and 11: Urban Runoff - Impervious areas (pa
- Page 12 and 13: Pollutant transport models are used
- Page 14 and 15: LAND USE Urban 2% Pasture 19% PHOSP
- Page 16 and 17: Measures of Lake Quality Chlorophy
<strong>Sources</strong> <strong>of</strong> <strong>Water</strong> <strong>Quality</strong> <strong>Problems</strong><br />
<strong>in</strong> <strong>the</strong> <strong>Red</strong> <strong>Cedar</strong> <strong>River</strong> Bas<strong>in</strong><br />
Bluegreen algae <strong>in</strong> Ta<strong>in</strong>ter Lake<br />
Heavy macrophyte growth <strong>in</strong> <strong>the</strong><br />
<strong>Red</strong> <strong>Cedar</strong> <strong>River</strong>
<strong>Sources</strong><br />
Lakes and streams are<br />
generally a reflection<br />
<strong>of</strong> <strong>the</strong>ir watershed. If<br />
<strong>the</strong>re are few sources<br />
<strong>of</strong> pollutants, <strong>the</strong> lake<br />
or stream is usually<br />
clean and healthy. If<br />
<strong>the</strong>re are many and<br />
large sources, <strong>the</strong>y are<br />
typically polluted and<br />
unhealthy.
Phosphorus is <strong>the</strong> key nutrient affect<strong>in</strong>g algae and plant<br />
growth <strong>in</strong> freshwater systems. It is <strong>the</strong> limit<strong>in</strong>g nutrient and<br />
most readily controlled. One pound <strong>of</strong> phosphorus can grow<br />
up to 500 pounds <strong>of</strong> algae.
The ma<strong>in</strong> source <strong>of</strong> phosphorus <strong>in</strong> a watershed is<br />
usually run<strong>of</strong>f from land surfaces. Where silt & clay<br />
erode <strong>in</strong>to waterbodies, phosphorus moves with it.<br />
Some phosphorus <strong>in</strong> run<strong>of</strong>f water is not attached to soil<br />
particles and is called soluble phosphorus.
Phosphorus frequently b<strong>in</strong>ds to f<strong>in</strong>e soil particles<br />
keep<strong>in</strong>g it out <strong>of</strong> groundwater. This b<strong>in</strong>d<strong>in</strong>g capacity <strong>of</strong><br />
soil is not unlimited and can be overwhelmed, such as<br />
underneath an old septic system. Also, some geologic<br />
rock formations will deliver groundwater high <strong>in</strong> soluble<br />
phosphorus but this tends to be a m<strong>in</strong>or source <strong>in</strong> most<br />
watersheds.
Only soluble phosphorus grows algae and plants.<br />
However, once <strong>in</strong> a waterbody, chemical processes<br />
can release phosphorus from eroded soil particles <strong>in</strong><br />
<strong>the</strong> sediments <strong>in</strong>to <strong>the</strong> overly<strong>in</strong>g water.
Potential sources <strong>of</strong> phosphorus <strong>in</strong> <strong>the</strong> <strong>Red</strong> <strong>Cedar</strong> bas<strong>in</strong><br />
are extensive. <strong>Red</strong>uc<strong>in</strong>g phosphorus release from all<br />
anthropogenic (human caused) sources is needed to<br />
achieve water quality goals. It is also important to<br />
identify <strong>the</strong> most significant sources. These vary from<br />
one watershed to <strong>the</strong> next and studies are needed to<br />
identify <strong>the</strong>m.<br />
Rural residential property<br />
Agricultural land<br />
Urban land<br />
Background sources
Rural residential<br />
sources:<br />
– Run<strong>of</strong>f dur<strong>in</strong>g<br />
construction<br />
– Run<strong>of</strong>f follow<strong>in</strong>g<br />
construction<br />
– Fail<strong>in</strong>g septic<br />
systems<br />
– Lawn fertilizers
Agricultural sources:<br />
– Barnyard run<strong>of</strong>f<br />
– Feedlot run<strong>of</strong>f<br />
– Cropland run<strong>of</strong>f<br />
– Streambank erosion
Urban Run<strong>of</strong>f<br />
– Impervious areas<br />
(park<strong>in</strong>g lots,<br />
roads, ro<strong>of</strong>s, etc.)<br />
– Run<strong>of</strong>f from urban<br />
turf areas<br />
– Construction sites
Background sources<br />
– Natural landscapes<br />
(woods, barren fields,<br />
wetlands, etc.)<br />
– Groundwater<br />
– Atmospheric deposition<br />
(precipitation)
Pollutant transport models are used to estimate<br />
<strong>the</strong> orig<strong>in</strong> <strong>of</strong> phosphorus to <strong>the</strong> Gulf <strong>of</strong> Mexico.<br />
http://toxics.usgs.gov/hypoxia/hypoxic_zone.html
WDNR is study<strong>in</strong>g<br />
several watersheds <strong>in</strong> <strong>the</strong><br />
state <strong>in</strong> order to develop<br />
plans to reduce impacts<br />
due to excessive<br />
phosphorus loads.
LAND USE<br />
Urban<br />
2%<br />
Pasture<br />
19%<br />
PHOSPHORUS ORIGIN<br />
Forest<br />
51%<br />
Cropland<br />
28%<br />
Urban<br />
2%<br />
Barnyard<br />
7%<br />
Po<strong>in</strong>t<br />
7%<br />
Cropland<br />
57%<br />
Backgrd<br />
27%<br />
Pollutant model<strong>in</strong>g <strong>of</strong> <strong>the</strong> watershed above Ta<strong>in</strong>ter Lake shows that<br />
all land uses do not contribute phosphorus to <strong>the</strong> watershed equally.<br />
In <strong>the</strong>se figures, po<strong>in</strong>t sources <strong>in</strong>clude municipal and <strong>in</strong>dustrial<br />
wastewater treatment plant discharges. “Urban” is phosphorus <strong>in</strong><br />
stormwater from urbanized areas. (July 1999 SWRRB Report –<br />
Click here to see complete report)<br />
“Background” was estimated by simulat<strong>in</strong>g <strong>the</strong> conversion <strong>of</strong> all<br />
cropland and urban areas to grassland and elim<strong>in</strong>at<strong>in</strong>g all barnyards<br />
and po<strong>in</strong>t sources. As such, it is an estimate <strong>of</strong> <strong>the</strong> uncontrollable<br />
load outside <strong>the</strong> <strong>in</strong>fluence <strong>of</strong> land use decisions.
Phosphorus <strong>of</strong>ten moves<br />
with eroded soil so model<strong>in</strong>g<br />
<strong>the</strong> loss and movement <strong>of</strong><br />
soil helps us determ<strong>in</strong>e<br />
phosphorus sources. The<br />
darker shaded areas have<br />
higher soil loss. (1999<br />
SWRRB Report)
Measures <strong>of</strong> Lake <strong>Quality</strong><br />
Chlorophyll a (algal biomass)<br />
Algal bloom frequency<br />
Algal tox<strong>in</strong>s<br />
Rooted aquatic plant density<br />
<strong>Water</strong> clarity<br />
Dissolved oxygen<br />
pH<br />
For more <strong>in</strong>formation see<br />
http://wateron<strong>the</strong>web.org/under/waterquality/<br />
http://www.noble.org/AG/Wildlife/SecchiDisk/Index.htm<br />
http://www.uwsp.edu/cnr/uwexlakes/laketides/vol32-2/Text-only.htm#8<br />
http://dnr.wi.gov/lakes/bluegreenalgae/
Models can simulate how Ta<strong>in</strong>ter Lake responds to<br />
phosphorus load<strong>in</strong>g. This graph shows <strong>the</strong> effect <strong>of</strong><br />
phosphorus reductions on <strong>the</strong> amount <strong>of</strong> chlorophyll A, a<br />
measure <strong>of</strong> algal biomass (June 1992 Lake Model<strong>in</strong>g<br />
report – Click here to see complete report ).


