ecg signal processing with fir digital filter by ... - Euroasiapub.org
ecg signal processing with fir digital filter by ... - Euroasiapub.org
ecg signal processing with fir digital filter by ... - Euroasiapub.org

Create successful ePaper yourself
Turn your PDF publications into a flip-book with our unique Google optimized e-Paper software.
IJREAS Volume 2, Issue 8 (August 2012) ISSN: 2249-3905<br />
ECG SIGNAL PROCESSING WITH FIR DIGITAL FILTER BY<br />
WINDOW TECHNIQUES<br />
Mohandas Choudhary*<br />
Ravindra Pratap Narwaria*<br />
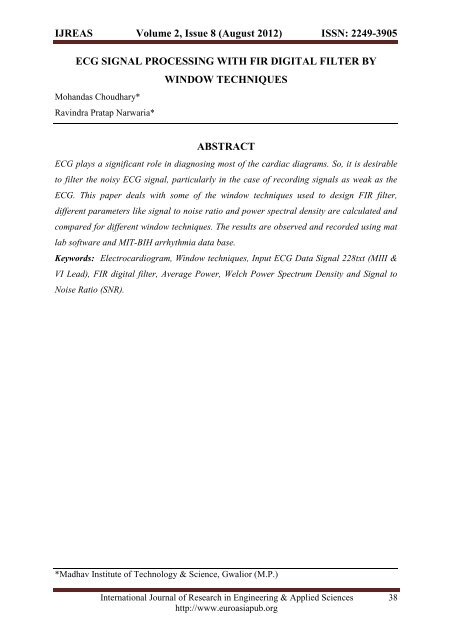
ABSTRACT<br />
ECG plays a significant role in diagnosing most of the cardiac diagrams. So, it is desirable<br />
to <strong>filter</strong> the noisy ECG <strong>signal</strong>, particularly in the case of recording <strong>signal</strong>s as weak as the<br />
ECG. This paper deals <strong>with</strong> some of the window techniques used to design FIR <strong>filter</strong>,<br />
different parameters like <strong>signal</strong> to noise ratio and power spectral density are calculated and<br />
compared for different window techniques. The results are observed and recorded using mat<br />
lab software and MIT-BIH arrhythmia data base.<br />
Keywords: Electrocardiogram, Window techniques, Input ECG Data Signal 228txt (MIII &<br />
VI Lead), FIR <strong>digital</strong> <strong>filter</strong>, Average Power, Welch Power Spectrum Density and Signal to<br />
Noise Ratio (SNR).<br />
*Madhav Institute of Technology & Science, Gwalior (M.P.)<br />
International Journal of Research in Engineering & Applied Sciences 38<br />
http://www.euroasiapub.<strong>org</strong>
IJREAS Volume 2, Issue 8 (August 2012) ISSN: 2249-3905<br />
1. INTRODUCTION<br />
One of the ways to diagnose heart diseases is to use electrocardiogram (ECG) <strong>signal</strong>s. The<br />
function of the heart is to contract rhythmically and pump blood to the lungs for oxygenation<br />
and then pump this oxygenated blood into the general circulation. This perfect rhythm is<br />
continuously maintained and <strong>signal</strong>ed <strong>by</strong> the spread of electrical <strong>signal</strong>s generated <strong>by</strong> the<br />
heart pacemaker, the Sinoatrial (SA) node. Detecting such electrical activity of the heart can<br />
help identify many heart disorders. This is the main concept behind using an<br />
Electrocardiogram, tracing the electrical activity of the heart. ECG <strong>signal</strong>s are formed of P<br />
wave, QRS complex, and T wave. The changes in these parameters indicate an illness of the<br />
heart that may occur <strong>by</strong> any reason. The P wave reflects the activation of the right and left<br />
atria. The QRS complex shows depolarization of the right and left ventricles. The T wave,<br />
that is after QRS complex reflects ventricular activation [4]. The repolarization of atria is not<br />
recorded on the reading of ECG, Waveform of ECG <strong>signal</strong> shown in Fig.1. ECG <strong>signal</strong> is<br />
one of the most important vital signs monitored from cardiac patients. The ECG <strong>signal</strong><br />
corrupted due to different types of artifacts and interferences such as Power line interference,<br />
Electrode contact noise, Muscle contraction, Base line drift, Instrumentation noise generated<br />
<strong>by</strong> electronic devices and Electrosurgical noise. For the meaningful and accurate detection,<br />
steps have to be taken to <strong>filter</strong> out or discard all these noise sources. The work on design and<br />
implementation of Digital <strong>filter</strong> on the ECG <strong>signal</strong> is in progress in the different part of the<br />
world. Different researchers have worked on the reduction of noise in the ECG <strong>signal</strong>.<br />
Baseline wanders and power line interference reduction is the <strong>fir</strong>st step in all<br />
electrocardiography <strong>signal</strong> <strong>processing</strong>. Mahesh Chavan, R.A. Agrawal, paper deals <strong>with</strong><br />
design and development of <strong>digital</strong> FIR equiripple <strong>filter</strong>. Complete design is performed <strong>with</strong><br />
FDA tool in the mat lab. For accessing real time ECG the Advantech add-on card has been<br />
used [3]. Ferdjallah M., Barr R.E. has given Frequency-domain <strong>digital</strong> <strong>filter</strong>ing techniques<br />
for the removal of power line noise [8]. Choy TT, Leung P M. have used 50 Hz notch <strong>filter</strong>s<br />
for the real time application on the ECG <strong>signal</strong> it is found that <strong>filter</strong> was capable of <strong>filter</strong>ing<br />
noise <strong>by</strong> 40dB <strong>with</strong> bandwidth of 4Hz and causes the attenuation in the QRS complex[14]<br />
International Journal of Research in Engineering & Applied Sciences 39<br />
http://www.euroasiapub.<strong>org</strong>
IJREAS Volume 2, Issue 8 (August 2012) ISSN: 2249-3905<br />
In Pan et al. proposed method Empirical<br />
Mode Decomposition was used for accurate<br />
removal of the baseline wander in ECG. The<br />
meaning of Base Line Drift noise is<br />
continuous drifting of ECG <strong>signal</strong> from base<br />
line. A suitable <strong>digital</strong> <strong>filter</strong> can be used to<br />
suppress the high-frequency embedded<br />
noise. The equiripple FIR low-pass <strong>filter</strong> <strong>by</strong><br />
superimposing of the optimal method, the<br />
Butterworth IIR low-pass <strong>filter</strong>, the 8-point<br />
moving-average <strong>filter</strong>, and the FIR <strong>filter</strong><br />
designed <strong>by</strong> using a Kaiser window [7]. The<br />
drift of the base line <strong>with</strong> respiration can be represented <strong>by</strong> a sinusoidal component at the<br />
frequency of respiration added to the ECG <strong>signal</strong>. The amplitude and the frequency of the<br />
sinusoidal component should be variables [12]. Some researchers have used analog <strong>filter</strong>s for<br />
removal of the power line interference. S.Pooranchandra, N.kumarave[15], have used the<br />
wavelet coefficient threshold based hyper shrinkage function to remove power line<br />
frequency. Santpal Singh Dhillon and Saswat Chakrabarti[16], have used a simplified lattice<br />
based adaptive IIR Notch <strong>filter</strong> to remove power line interference. Hejjel L, used the analog<br />
<strong>digital</strong> notch <strong>filter</strong> for the reduction of the power line interference in the ECG <strong>signal</strong> for the<br />
heart rate variability analysis. The investigation addressed the analysis of the effects of AC<br />
interference and its <strong>filter</strong>ing on the precision and accuracy of heart rate detection. This paper<br />
is concerned <strong>with</strong> finite impulse response <strong>filter</strong>ing <strong>with</strong> noisy input and output<br />
measurements. A new least-squares (LS) based algorithm is proposed to estimate the FIR<br />
<strong>filter</strong> coefficients [13]. K.D. Chinchkhede, present the implementation of FIR <strong>filter</strong> <strong>with</strong><br />
various window techniques [1], <strong>with</strong> reference of this paper we analysis of other window<br />
impulse function <strong>by</strong> using FDA tool and <strong>filter</strong> noisy ECG data <strong>signal</strong>.<br />
2. DIGITAL FIR FILTER<br />
A <strong>digital</strong> <strong>filter</strong> is a system that performs mathematical operations on a sampled, discrete time<br />
to reduce or enhance certain aspects of that <strong>signal</strong>. FIR <strong>filter</strong>s are <strong>digital</strong> <strong>filter</strong>s <strong>with</strong> finite<br />
impulse response. In particular to convert an "ideal" impulse response of infinite duration,<br />
such as a sin function to a finite impulse response <strong>filter</strong> design, that is called the window<br />
method. FIR <strong>filter</strong>s are also known as non-recursive <strong>digital</strong> <strong>filter</strong> as they do not have the<br />
International Journal of Research in Engineering & Applied Sciences 40<br />
http://www.euroasiapub.<strong>org</strong>
IJREAS Volume 2, Issue 8 (August 2012) ISSN: 2249-3905<br />
feedback (a recursive part of a <strong>filter</strong>), even though recursive algorithms can be used for FIR<br />
<strong>filter</strong> realization.<br />
(a) Algorithm<br />
Where h(n) impulse response of the ideal <strong>filter</strong> and ω(n) denotes the window.<br />
(b) Che<strong>by</strong>shevs Window Function<br />
The Che<strong>by</strong>shev window minimizes the Che<strong>by</strong>shev norm of the side lobes for a main- lobe<br />
width 2ω c. The optimal Dolph-Che<strong>by</strong>shev window transform can be written in close form as<br />
The zero- phase Dolph – Che<strong>by</strong>shev window, ω(n), is then computed as the inverse DFT of<br />
. The α parameter control the side lobe level via the given formula<br />
Thus, α = 2 gives side lobes which are 40db below the main lobe peak. Since the side lobes<br />
of the Che<strong>by</strong>shev window transform are equal height, they are often called “ripple in the<br />
stop-band”(the window transform as a low pass <strong>filter</strong> frequency response).<br />
International Journal of Research in Engineering & Applied Sciences 41<br />
http://www.euroasiapub.<strong>org</strong>
IJREAS Volume 2, Issue 8 (August 2012) ISSN: 2249-3905<br />
(c) Nuttall window Function<br />
Where N represents the width in samples of a discrete-time symmetrical window function<br />
and n is an integer <strong>with</strong> values .<br />
(d) Tukey Window Function<br />
Where N represents the width in samples of a discrete-time symmetrical window function<br />
and n is an integer <strong>with</strong> values .<br />
3. METHODOLOGY<br />
In this paper reduce noise from ECG data <strong>signal</strong>. Input ECG Data <strong>signal</strong> 228txt(MIII & VI)<br />
collected from MIT-BIH. Data <strong>signal</strong> 228txt has the 3600 data samples. The <strong>fir</strong>st group is<br />
intended to serve as a representative sample of the variety of waveforms and artifact that an<br />
arrhythmia detector might encounter in routine clinical use. The band pass-<strong>filter</strong>ed <strong>signal</strong>s<br />
were digitized at 360 Hz per <strong>signal</strong> relative to real time using hardware constructed at the<br />
MIT Biomedical Engineering Center and at the BIH Biomedical Engineering Laboratory.<br />
The sampling frequency was chosen to facilitate implementations of 60 Hz (mains<br />
frequency) <strong>digital</strong> notch <strong>filter</strong>s in arrhythmia detectors. Since the recorders were batterypowered,<br />
most of the 60 Hz noise present in the database arose during playback. Sampling<br />
frequency of the data <strong>signal</strong> is 360 and amplitude ±1 mv. Filter of noisy ECG <strong>signal</strong> set up in<br />
two step, in <strong>fir</strong>st step input data <strong>signal</strong> removing from the baseline drift after then 10 db awgn<br />
noise introduce in input data <strong>signal</strong>. In second step <strong>with</strong> the help of FDA tool in matlab<br />
software design FIR <strong>filter</strong> based on Che<strong>by</strong>shevs, Nuttal and Tukey window techniques. Filter<br />
parameter order 452 and cutoff frequency is 60 Hz. Design <strong>filter</strong> of these window techniques<br />
apply on input noisy ECG data <strong>signal</strong>. Select parameters order 452 and cutoff frequency<br />
60Hz in FDA tool. Impulse response of the <strong>filter</strong> using <strong>by</strong> FDA shown in fig.<br />
International Journal of Research in Engineering & Applied Sciences 42<br />
http://www.euroasiapub.<strong>org</strong>
IJREAS Volume 2, Issue 8 (August 2012) ISSN: 2249-3905<br />
Figure 3. Impuse Response of Chevyshevs Filter using FDA tool<br />
Figure 4. Poles and Zero using Nuttal Window FIR Filter<br />
Figure 5. Original Input ECG Data Signal and <strong>with</strong> baseline remove of 228txt MIII Lead<br />
International Journal of Research in Engineering & Applied Sciences 43<br />
http://www.euroasiapub.<strong>org</strong>
IJREAS Volume 2, Issue 8 (August 2012) ISSN: 2249-3905<br />
Figure 6. Noisy Data <strong>signal</strong> and Filtered ECG Data Signal using window techniques of MIII<br />
Lead Data<br />
Original data <strong>signal</strong> <strong>with</strong> AWGN noise and the <strong>filter</strong> data <strong>signal</strong> spectrum analysis at 60 Hz<br />
frequency shown <strong>by</strong> the Welch power spectrum diagram in fig. 5. Signal to Noise power<br />
ratio after <strong>with</strong> various window shown in table 1. Signal to noise ratio of the <strong>filter</strong>ed <strong>signal</strong><br />
calculated <strong>by</strong><br />
Where µ is mean and σ standard deviation of noisy <strong>signal</strong>.<br />
Figure 7. Welch Power Spectral Density of ECG Data Signal Before and After Filtering<br />
International Journal of Research in Engineering & Applied Sciences 44<br />
http://www.euroasiapub.<strong>org</strong>
IJREAS Volume 2, Issue 8 (August 2012) ISSN: 2249-3905<br />
Table 1. SNR for various windows of 228txt (MIII)<br />
Before<br />
After Filtering<br />
Filtering Che<strong>by</strong>shevs Nuttal Tukey<br />
-21.5714 -15.3822 -15.3822 -15.3874<br />
Table 2. Average Power for various windows<br />
Before<br />
After Filtering<br />
Filtering Che<strong>by</strong>shevs Nuttal Tukey<br />
-13.1875 -11.1182 -11.1182 -11.1069<br />
4. CONCLUSION<br />
Figure 6. shows that noise has been reduced when ECG <strong>signal</strong> is <strong>filter</strong>ed using FIR <strong>filter</strong>.<br />
Results have been concluded for these windows Che<strong>by</strong>shevs, Nuttal and Tukey. Table1,<br />
shows the comparison of SNR for data 228txt(MIII Lead) and table2 show the comparasion<br />
of Average Power for data from the table are find that average power for Tukey window is<br />
more than the Che<strong>by</strong>shevs and Nuttal window.<br />
REFERENCES<br />
[1] K.D. Chinchkhede “On the implementation of FIR Filter <strong>with</strong> various window for<br />
enhancement of ECG <strong>signal</strong>”, IJEST Vol.3 No.3 March 2011.<br />
[2] http://www.physionet.<strong>org</strong>/cgi-bin/atm/ATM “MIT-BIH Arrhythmia Database”.6y<br />
[3] Mahesh Chavan, R.A. Agrawal,M.D. Uplane,“FIR Equiripple <strong>digital</strong> <strong>filter</strong> for reduction<br />
of power line interference in the ECG Signal”,ISPRA 2008.<br />
[4] Sornmo,L.,Laguna,P. “Bioelectrical Signal Processing in Cardiac and Neurological<br />
Application”,Elsevier,Amsterdam 2005.<br />
[5] R.M. Rangayyan, “biomedical Signal Analysis: A Case-study Approach”, New York,<br />
NY: Wiley, ch.3, 2002.<br />
[6] E.Farahabadi, “Noise Removal from Electrocardiogram <strong>signal</strong> Employing an artificial<br />
Neural Network in Wavelet Domain”, IEEE 2009.<br />
[7] Ying-Wen Bai, “The Combination of Kaiser Window and Moving Average for the Low-<br />
Pass Filtering of the Remote ECG Signal”, IEEE 2004.<br />
[8] Ferdjallah M,Barr RE., “Frequency domain <strong>digital</strong> <strong>filter</strong>ing techniques for the removal of<br />
power line noise <strong>with</strong> application to the electrocardiogram”, comput Biomed Res.1990.<br />
International Journal of Research in Engineering & Applied Sciences 45<br />
http://www.euroasiapub.<strong>org</strong>
IJREAS Volume 2, Issue 8 (August 2012) ISSN: 2249-3905<br />
[9] Yong Lian and Poh Choo Ho, “ECG Noise Reduction using multiplier free FIR <strong>digital</strong><br />
<strong>filter</strong>”, IEEE 2004.<br />
[10] Syed Zahurul Islam, Syed Zahidul Islam, Razali Jidin, “Performance Study of Adaptive<br />
Filtering Algorithms for Noise Cancellation of ECG Signal”, IEEE 2009.<br />
[11] Jamshaid K.,Akram O., Sabir F., “Application of Adaptive and Non Adaptive Filter in<br />
ECG Signal Processing”.<br />
[12] Youcef Ferdi, Improved Lowpass Differentiator for Physiological Signal<br />
Processing”,CSNDSP 2010.<br />
[13] Wei Xing Zheng,”A Least- Squares based algorithm for FIR <strong>filter</strong>ing <strong>with</strong> noisy data”,<br />
IEEE 2003.<br />
[14] Choy TT, Leung PM., “Real time microprocessor-based 50 Hz notch <strong>filter</strong> for ECG”,<br />
JBiomed Eng. 1988May;10(3):285-8.<br />
[15] S.Pooranchandra, N.Kumaravel, “A novel method for elimination of power line<br />
frequency in ECG <strong>signal</strong> using hyper shrinkage function”, Digital Signal Processing,<br />
Volume18, Issue 2, March 2008.<br />
[16] Santpal Singh Dhillon, Saswat Chakrabarti, “Power Line Interference removal From<br />
Electrocardiogram Using A Simplified Lattice Based Adaptive IIR Notch Filter”,<br />
Proceedings of the 23rd Annual EMBS International conference, October 25- 28, Istanbul,<br />
Turkey, 2001.<br />
International Journal of Research in Engineering & Applied Sciences 46<br />
http://www.euroasiapub.<strong>org</strong>