P - Technische Universiteit Eindhoven
P - Technische Universiteit Eindhoven P - Technische Universiteit Eindhoven
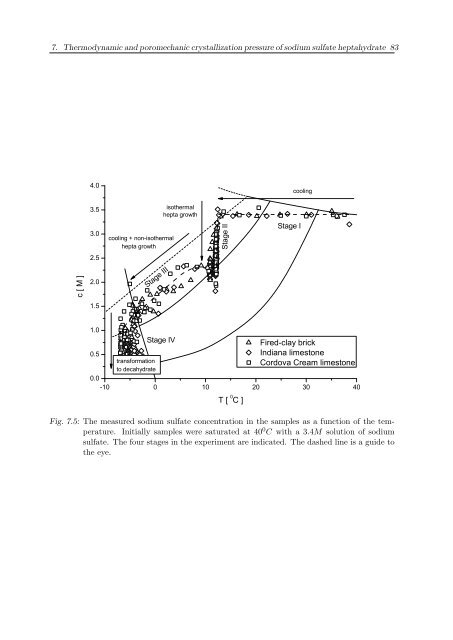
7. Thermodynamic and poromechanic crystallization pressure of sodium sulfate heptahydrate 83 4.0 cooling c [ M ] 3.5 3.0 2.5 2.0 cooling + non-isothermal hepta growth Stage III isothermal hepta growth Stage II Stage I 1.5 1.0 0.5 Stage IV T [ 0 C ] Fired-clay brick Indiana limestone Cordova Cream limestone transformation to decahydrate 0.0 -10 0 10 20 30 40 Fig. 7.5: The measured sodium sulfate concentration in the samples as a function of the temperature. Initially samples were saturated at 40 0 C with a 3.4M solution of sodium sulfate. The four stages in the experiment are indicated. The dashed line is a guide to the eye.
7. Thermodynamic and poromechanic crystallization pressure of sodium sulfate heptahydrate 84 Expansion [ m ] 14 12 10 8 6 4 Stage I cooling Stage II isothermal crystallization Stage III non-isothermal crystallization Stage IV transformation to decahydrate expansion [ m ] temperature [ x10 0 C ] 4 2 0 -2 S c & T [ x10 0 C ] 2 crystal volume S c decahydrate heptahydrate a. Expansion [ m ] 250 200 150 100 50 0 -4 0 10000 20000 30000 40000 50000 60000 fired-clay brick Stage I cooling Stage II isothermal crystallization Stage III non- isothermal crystallization Time [ s ] Stage IV transformation to decahydrate expansion [ m ] temperature[ x10 O C ] crystal volume S c decahydrate heptahydrate 4 2 0 S c & T [ x10 0 C ] b. 0 -2 0 10000 20000 30000 40000 50000 60000 Cordova Cream limestone Time [ s ]
- Page 34 and 35: 3. Crystallization under wetting/no
- Page 36 and 37: 3. Crystallization under wetting/no
- Page 38 and 39: 3. Crystallization under wetting/no
- Page 40 and 41: 3. Crystallization under wetting/no
- Page 42 and 43: 3. Crystallization under wetting/no
- Page 44 and 45: 4. NUCLEATION ON MINERAL SUBSTRATES
- Page 46 and 47: 4. Nucleation on mineral substrates
- Page 48 and 49: 4. Nucleation on mineral substrates
- Page 50 and 51: 4. Nucleation on mineral substrates
- Page 52 and 53: 5. SODIUM SULFATE HEPTAHYDRATE FORM
- Page 54 and 55: 5. Sodium sulfate heptahydrate form
- Page 56 and 57: 5. Sodium sulfate heptahydrate form
- Page 58 and 59: 5. Sodium sulfate heptahydrate form
- Page 60 and 61: 5. Sodium sulfate heptahydrate form
- Page 62 and 63: 6. CRYSTALLIZATION OF SODIUM SULFAT
- Page 64 and 65: 6. Crystallization of sodium sulfat
- Page 66 and 67: 6. Crystallization of sodium sulfat
- Page 68 and 69: 6. Crystallization of sodium sulfat
- Page 70 and 71: 6. Crystallization of sodium sulfat
- Page 72 and 73: M 6. Crystallization of sodium sulf
- Page 74 and 75: 7. THERMODYNAMIC AND POROMECHANIC C
- Page 76 and 77: 7. Thermodynamic and poromechanic c
- Page 78 and 79: 7. Thermodynamic and poromechanic c
- Page 80 and 81: 7. Thermodynamic and poromechanic c
- Page 82 and 83: 7. Thermodynamic and poromechanic c
- Page 86 and 87: 7. Thermodynamic and poromechanic c
- Page 88 and 89: 7. Thermodynamic and poromechanic c
- Page 90 and 91: 7. Thermodynamic and poromechanic c
- Page 92 and 93: 8. NMR COMBINED WITH ACCELERATED WE
- Page 94 and 95: 8. NMR combined with accelerated we
- Page 96 and 97: ∆ 8. NMR combined with accelerate
- Page 98 and 99: 8. NMR combined with accelerated we
- Page 100 and 101: 8. NMR combined with accelerated we
- Page 102 and 103: 8. NMR combined with accelerated we
- Page 104 and 105: 8. NMR combined with accelerated we
- Page 106 and 107: 9. CONCLUSIONS AND OUTLOOK This cha
- Page 108 and 109: 9. Conclusions and Outlook 107 Soft
- Page 110 and 111: APPENDIX: CALCULATION OF SALT CRYST
- Page 112 and 113: Appendix: Calculation of salt cryst
- Page 114 and 115: Bibliography 113 [15] L.M. Luquer,
- Page 116 and 117: Bibliography 115 [47] D. Rosenblatt
- Page 118 and 119: Bibliography 117 [78] H.P. Huinink,
- Page 120 and 121: LIST OF PUBLICATIONS Published: •
- Page 122 and 123: ACKNOWLEDGMENT This thesis would no
- Page 124: CURRICULUM VITAE Tamerlan Saidov wa
7. Thermodynamic and poromechanic crystallization pressure of sodium sulfate heptahydrate 83<br />
4.0<br />
cooling<br />
c [ M ]<br />
3.5<br />
3.0<br />
2.5<br />
2.0<br />
cooling + non-isothermal<br />
hepta growth<br />
Stage III<br />
isothermal<br />
hepta growth<br />
Stage II<br />
Stage I<br />
1.5<br />
1.0<br />
0.5<br />
Stage IV<br />
T [ 0 C ]<br />
Fired-clay brick<br />
Indiana limestone<br />
Cordova Cream limestone<br />
transformation<br />
to decahydrate<br />
0.0<br />
-10 0 10 20 30 40<br />
Fig. 7.5: The measured sodium sulfate concentration in the samples as a function of the temperature.<br />
Initially samples were saturated at 40 0 C with a 3.4M solution of sodium<br />
sulfate. The four stages in the experiment are indicated. The dashed line is a guide to<br />
the eye.


