ADMISSION TEST FOR PROGRAMME 2008-10
ADMISSION TEST FOR PROGRAMME 2008-10
ADMISSION TEST FOR PROGRAMME 2008-10
Create successful ePaper yourself
Turn your PDF publications into a flip-book with our unique Google optimized e-Paper software.
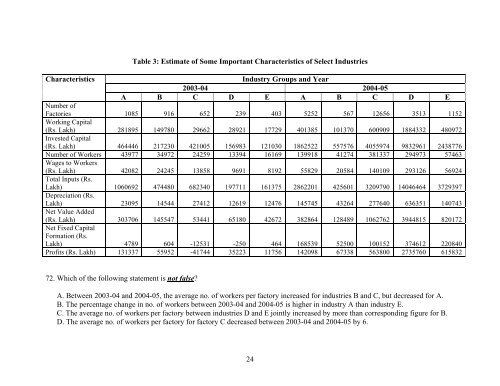
Table 3: Estimate of Some Important Characteristics of Select Industries<br />
Characteristics<br />
Industry Groups and Year<br />
2003-04 2004-05<br />
A B C D E A B C D E<br />
Number of<br />
Factories<br />
Working Capital<br />
<strong>10</strong>85 916 652 239 403 5252 567 12656 3513 1152<br />
(Rs. Lakh)<br />
Invested Capital<br />
281895 149780 29662 28921 17729 401385 <strong>10</strong>1370 600909 1884332 480972<br />
(Rs. Lakh) 464446 217230 42<strong>10</strong>05 156983 12<strong>10</strong>30 1862522 557576 4055974 9832961 2438776<br />
Number of Workers<br />
Wages to Workers<br />
43977 34972 24259 13394 16169 139918 41274 381337 294973 57463<br />
(Rs. Lakh)<br />
Total Inputs (Rs.<br />
42082 24245 13858 9691 8192 55829 20584 140<strong>10</strong>9 293126 56924<br />
Lakh)<br />
Depreciation (Rs.<br />
<strong>10</strong>60692 474480 682340 197711 161375 2862201 425601 3209790 14046464 3729397<br />
Lakh)<br />
Net Value Added<br />
23095 14544 27412 12619 12476 145745 43264 277640 636351 140743<br />
(Rs. Lakh)<br />
Net Fixed Capital<br />
Formation (Rs.<br />
303706 145547 53441 65180 42672 382864 128489 <strong>10</strong>62762 3944815 820172<br />
Lakh) 4789 604 -12531 -250 464 168539 52500 <strong>10</strong>0152 374612 220840<br />
Profits (Rs. Lakh) 131337 55952 -41744 35223 11756 142098 67338 563800 2735760 615832<br />
72. Which of the following statement is not false?<br />
A. Between 2003-04 and 2004-05, the average no. of workers per factory increased for industries B and C, but decreased for A.<br />
B. The percentage change in no. of workers between 2003-04 and 2004-05 is higher in industry A than industry E.<br />
C. The average no. of workers per factory between industries D and E jointly increased by more than corresponding figure for B.<br />
D. The average no. of workers per factory for factory C decreased between 2003-04 and 2004-05 by 6.<br />
24


