EAP - The Pacific Infrastructure Challenge - World Bank (2006).pdf
EAP - The Pacific Infrastructure Challenge - World Bank (2006).pdf
EAP - The Pacific Infrastructure Challenge - World Bank (2006).pdf
You also want an ePaper? Increase the reach of your titles
YUMPU automatically turns print PDFs into web optimized ePapers that Google loves.
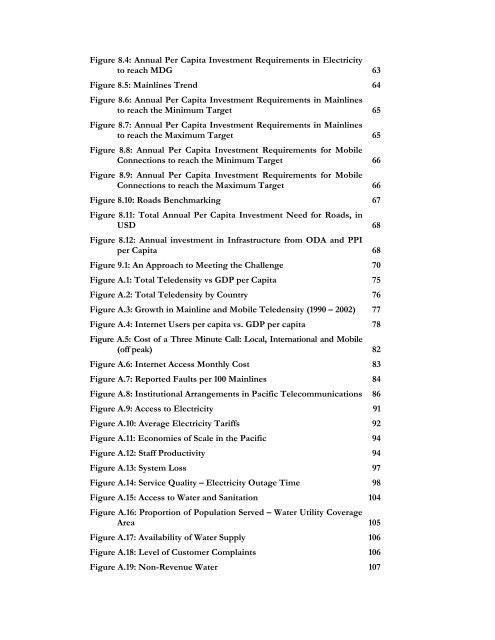
Figure 8.4: Annual Per Capita Investment Requirements in Electricity<br />
to reach MDG 63<br />
Figure 8.5: Mainlines Trend 64<br />
Figure 8.6: Annual Per Capita Investment Requirements in Mainlines<br />
to reach the Minimum Target 65<br />
Figure 8.7: Annual Per Capita Investment Requirements in Mainlines<br />
to reach the Maximum Target 65<br />
Figure 8.8: Annual Per Capita Investment Requirements for Mobile<br />
Connections to reach the Minimum Target 66<br />
Figure 8.9: Annual Per Capita Investment Requirements for Mobile<br />
Connections to reach the Maximum Target 66<br />
Figure 8.10: Roads Benchmarking 67<br />
Figure 8.11: Total Annual Per Capita Investment Need for Roads, in<br />
USD 68<br />
Figure 8.12: Annual investment in <strong>Infrastructure</strong> from ODA and PPI<br />
per Capita 68<br />
Figure 9.1: An Approach to Meeting the <strong>Challenge</strong> 70<br />
Figure A.1: Total Teledensity vs GDP per Capita 75<br />
Figure A.2: Total Teledensity by Country 76<br />
Figure A.3: Growth in Mainline and Mobile Teledensity (1990 – 2002) 77<br />
Figure A.4: Internet Users per capita vs. GDP per capita 78<br />
Figure A.5: Cost of a Three Minute Call: Local, International and Mobile<br />
(off peak) 82<br />
Figure A.6: Internet Access Monthly Cost 83<br />
Figure A.7: Reported Faults per 100 Mainlines 84<br />
Figure A.8: Institutional Arrangements in <strong>Pacific</strong> Telecommunications 86<br />
Figure A.9: Access to Electricity 91<br />
Figure A.10: Average Electricity Tariffs 92<br />
Figure A.11: Economies of Scale in the <strong>Pacific</strong> 94<br />
Figure A.12: Staff Productivity 94<br />
Figure A.13: System Loss 97<br />
Figure A.14: Service Quality – Electricity Outage Time 98<br />
Figure A.15: Access to Water and Sanitation 104<br />
Figure A.16: Proportion of Population Served – Water Utility Coverage<br />
Area 105<br />
Figure A.17: Availability of Water Supply 106<br />
Figure A.18: Level of Customer Complaints 106<br />
Figure A.19: Non-Revenue Water 107


