

EAP - The Pacific Infrastructure Challenge - World Bank (2006).pdf
EAP - The Pacific Infrastructure Challenge - World Bank (2006).pdf
EAP - The Pacific Infrastructure Challenge - World Bank (2006).pdf

Create successful ePaper yourself
Turn your PDF publications into a flip-book with our unique Google optimized e-Paper software.
6 Why the Difference in Performance<br />
<strong>The</strong> preceding section showed that levels of infrastructure access, quality and efficiency<br />
vary between countries of a similar size and income level within the <strong>Pacific</strong> region itself,<br />
and relative to the comparator countries.<br />
<strong>The</strong>re a re a number of possible reasons for the difference in performance. It is critically<br />
important to diagnose the problem correctly. It may be tempting to ascribe problems to<br />
the physical, social, and cultural features of the <strong>Pacific</strong> countries which are outside<br />
government control. However, an incorrect diagnosis would lead to poor policies.<br />
In this section we consider the different defining characteristics, such as population size,<br />
remoteness, or topography. Some of these characteristics make it more difficult to achieve<br />
good infrastructure performance, such as small scale, limited human resources or<br />
dependence on aid. We ask if these characteristics explain poor performance.<br />
We then look at the institutional and management arrangements which influence<br />
infrastructure performance. Strong institutions can help small dispersed communities to<br />
improve performance despite any natural disadvantages. We ask to what extent weak<br />
institutions explain poor outcomes.<br />
6.1 <strong>The</strong> <strong>Pacific</strong> Context<br />
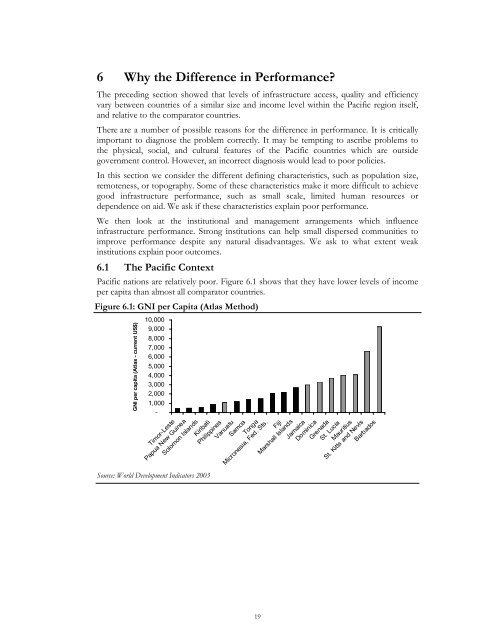
<strong>Pacific</strong> nations are relatively poor. Figure 6.1 shows that they have lower levels of income<br />
per capita than almost all comparator countries.<br />
Figure 6.1: GNI per Capita (Atlas Method)<br />
GNI per capita (Atlas - current US$)<br />
10,000<br />
9,000<br />
8,000<br />
7,000<br />
6,000<br />
5,000<br />
4,000<br />
3,000<br />
2,000<br />
1,000<br />
-<br />
Source: <strong>World</strong> Development Indicators 2003<br />
Timor-Leste<br />
Papua NewGuinea<br />
Solomon Islands<br />
Kiribati<br />
Philippines<br />
Vanuatu<br />
Samoa<br />
Tonga<br />
Micronesia, Fed. Sts.<br />
Fiji<br />
Marshall Islands<br />
Jamaica<br />
Dominica<br />
Grenada<br />
St. Lucia<br />
Mauritius<br />
St. Kitts and Nevis<br />
Barbados<br />
19


