

EAP - The Pacific Infrastructure Challenge - World Bank (2006).pdf
EAP - The Pacific Infrastructure Challenge - World Bank (2006).pdf
EAP - The Pacific Infrastructure Challenge - World Bank (2006).pdf

Create successful ePaper yourself
Turn your PDF publications into a flip-book with our unique Google optimized e-Paper software.
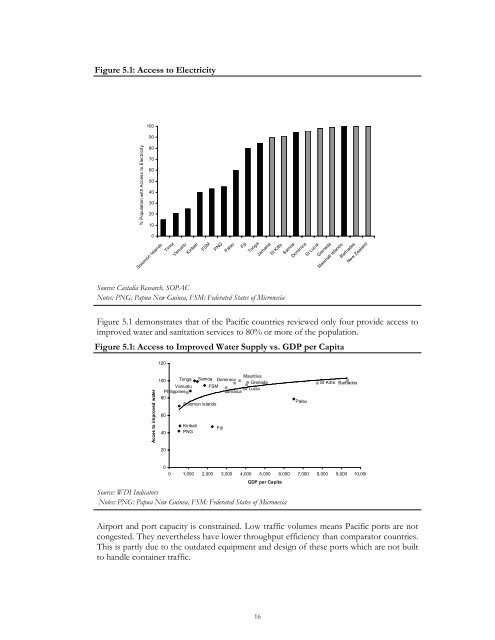
Figure 5.1: Access to Electricity<br />
100<br />
90<br />
% Population with Access to Electricity<br />
80<br />
70<br />
60<br />
50<br />
40<br />
30<br />
20<br />
10<br />
0<br />
Solomon Islands<br />
Timor<br />
Vanuatu<br />
Kiribati<br />
FSM<br />
PNG<br />
Palau<br />
Fiji<br />
Tonga<br />
Jamaica<br />
St Kitts<br />
Samoa<br />
Dominica<br />
St Lucia<br />
Grenada<br />
Marshall Islands<br />
Barbados<br />
New Zealand<br />
Source: Castalia Research, SOPAC<br />
Notes: PNG: Papua New Guinea, FSM: Federated States of Micronesia<br />
Figure 5.1 demonstrates that of the <strong>Pacific</strong> countries reviewed only four provide access to<br />
improved water and sanitation services to 80% or more of the population.<br />
Figure 5.1: Access to Improved Water Supply vs. GDP per Capita<br />
120<br />
Acces to improved water<br />
Mauritius<br />
100 Tonga Samoa Dominica<br />
Grenada<br />
Vanuatu FSM<br />
St Lucia<br />
Philippines<br />
Jamaica<br />
80<br />
Solomon Islands<br />
60<br />
Kiribati<br />
Fiji<br />
40 PNG<br />
Palau<br />
St Kitts<br />
Barbados<br />
20<br />
0<br />
0 1,000 2,000 3,000 4,000 5,000 6,000 7,000 8,000 9,000 10,000<br />
GDP per Capita<br />
Source: WDI Indicators<br />
Notes: PNG: Papua New Guinea, FSM: Federated States of Micronesia<br />
Airport and port capacity is constrained. Low traffic volumes means <strong>Pacific</strong> ports are not<br />
congested. <strong>The</strong>y nevertheless have lower throughput efficiency than comparator countries.<br />
This is partly due to the outdated equipment and design of these ports which are not built<br />
to handle container traffic.<br />
16


