FY 2020 Capital Improvement Program - DC Water
FY 2020 Capital Improvement Program - DC Water
FY 2020 Capital Improvement Program - DC Water

Create successful ePaper yourself
Turn your PDF publications into a flip-book with our unique Google optimized e-Paper software.
district of columbia water and sewer authority<br />
capital improvement<br />
program<br />
approved fy 2011 – <strong>2020</strong><br />
section II<br />
CAPITAL IMPROVEMENT<br />
PROJECTS OVERVIEW
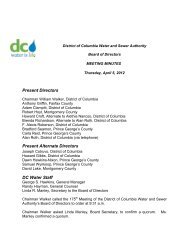
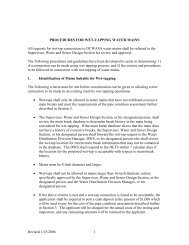
<strong>FY</strong> 2011 - <strong>FY</strong> <strong>2020</strong> <strong>Capital</strong> <strong>Improvement</strong> <strong>Program</strong><br />
($ in 000's)<br />
Washington<br />
Aqueduct,<br />
$107,144<br />
2.8%<br />
<strong>Capital</strong> Equipment<br />
$98,662<br />
2.6%<br />
<strong>Water</strong><br />
$596,282<br />
15.6%<br />
Stormwater<br />
$16,284<br />
0.4%<br />
Blue Plains<br />
Wastewater<br />
Treatment<br />
$1,363,882<br />
35.6%<br />
Combined Sewer<br />
Overflow / Long<br />
Term Control Plan<br />
$1,184,694<br />
31.0%<br />
Sanitary Sewer<br />
$457,223<br />
12.0%<br />
Total $3.8 Billion (Cash Disbursements)<br />
II - 2
<strong>FY</strong> 2011 – <strong>FY</strong> <strong>2020</strong><br />
CAPITAL IMPROVEMENT PROGRAM OVERVIEW<br />
District of Columbia <strong>Water</strong> and Sewer Authority’s (“<strong>DC</strong> <strong>Water</strong>”) ten-year capital improvement program (CIP) totals $3.8 billion (on a<br />
cash disbursements basis), approximately the same amount as the last two years, while the lifetime budget has increased modestly<br />
in this proposal by $78.9 million to a total of $8 billion. The Congressional capital authority request is $606.1 million. As discussed in<br />
more detail later throughout this document, the total disbursements have remained relatively constant; there has been a shift in<br />
disbursements among the Service Areas. The Wastewater Treatment Area disbursements decreased by $36.4 million over the ten<br />
year period primarily as a result of favorable construction bids for the Enhanced Nitrogen Removal Facilities Project (ENRF),<br />
(specifically Project E9), offset by an increase in the New Digestion Facilities (Project XA) related to the final dewatering aspect of<br />
this project. This decrease along with some nominal decreases in the <strong>Water</strong>, Stormwater, <strong>Capital</strong> Equipment and Washington<br />
Aqueduct areas were offset by increases in the Sanitary Sewer and CSO/Clean Rivers Project (aka CSO/LTCP) areas. These latter<br />
increases are mainly the result of the replacement of <strong>FY</strong> 2010 actual with <strong>FY</strong> <strong>2020</strong> projected disbursements. As mentioned in the<br />
Letter of Transmittal, there is approximately $1 billion in projects which have been identified as prudent asset re-investments for <strong>DC</strong><br />
<strong>Water</strong>, but have been deferred outside of the current 10-year planning period. Some of these projects may be introduced in the out<br />
years during future planning periods.<br />
The following sections summarize major projects and changes in each service area, with additional details for each project included<br />
in each service area section. Please note that all dollar amounts are presented on a project lifetime basis, except where noted<br />
otherwise.<br />
WASTEWATER TREATMENT<br />
Although the lifetime budget for the Wastewater Treatment Service Area remains relatively the same at $2.7 billion, there were some<br />
notable changes in both the Solids Processing Projects as well as the Enhanced Nitrogen Removal Facilities. With regards to the<br />
former, as indicated above, the New Digestion Facilities experienced an increase in the Lifetime Budget of $34.1 million related to the<br />
final dewatering portion of this project. Also, as referenced above, we experienced some favorable bids for two construction contracts<br />
for Project E9 (Nitrogen Removal Facilities) allowing for a decrease in the Lifetime Budget of $54 million.<br />
Also, this area continues to reflect the implementation of the Biosolids Management Plan including the costs of construction of the<br />
Combined Heating and Power Plant (CHP) and Digesters with estimated completion in <strong>FY</strong> 2014. The benefits of this plan include<br />
producing a Class A biosolids product which can be more widely disposed of at reduced costs; reduction in the carbon footprint of the<br />
existing lime stabilization process; and, the on-site net production of an estimated 10MW of power that can be utilized at Blue Plains.<br />
II - 3
An interim method of financing this project has been used in the Financial Plan to mitigate the impact on customers’ rates and to<br />
better match the financing costs with the benefits that will be received over the life of these facilities.<br />
Other long-term upgrade projects now under construction include:<br />
• Nitrification-Denitrification Facilities Upgrade - to upgrade the process and/or replace equipment that is at the end of its useful<br />
life.<br />
• Raw Wastewater Pump Station 1 - Upgrade to the Raw Wastewater Pump Station to replace equipment that is at the end of<br />
its useful life, and improve reliability.<br />
• Process Control System – will provide automated monitoring and control for the nitrification-denitrification process that will<br />
improve treatment, control and optimize chemical and power costs, and increase reliability of the facilities.<br />
• Biological Sludge Thickening Facilities- will upgrade the existing dissolved air floatation thickening units to restore integrity to<br />
this system and reduce sludge processing and chemical costs through improved efficiency.<br />
• Dual Purpose Rehabilitation (Project BG) – The project rehabilitates the sedimentation basins that were constructed<br />
approximately 20 years ago to provide sedimentation of flows from either the secondary reactors or the nitrification reactors or<br />
various combinations. The design, which is currently underway, will revise the operating conditions to dedicate four (4)<br />
basins to service the secondary treatment process and dedicate four (4) basins to service the enhanced nitrogen removal<br />
process. The design and construction will be combined with Project BI, Secondary Treatment Facilities Upgrade, ENR-N.<br />
COMBINED SEWER OVERLFOW<br />
The lifetime budget for the Combined Sewer Service Overflow (CSO) Service Area is $2.6 billion, which includes the twenty-year <strong>DC</strong><br />
Clean Rivers Project (CSO Long Term Control Plan). The current ten-year budget has an increase of approximately $60 million over<br />
last year’s budget due to additional projects added to the CSO program. The benefits of this plan are significant. When fully<br />
implemented, combined sewer overflows will be reduced by a projected 96 percent (98 percent on the Anacostia River), resulting in<br />
improved water quality. To date, overflows have already been reduced by nearly 40 percent due to various minimum control<br />
activities.<br />
During Fiscal Year 2011 one of the largest contracts since the Authority was created was awarded under the <strong>DC</strong> Clean Rivers<br />
Project for construction of the Blue Plains Tunnel. This first major contract will support the reduction of sewer overflows as well as the<br />
enhanced nitrogen removal processes required by the recent permit limitations for the Blue Plains Wastewater Treatment plant. The<br />
contract is underway and the program is currently within budget. As has been noted over the past few years there are additional risks<br />
and contingencies associated with the 20-year <strong>DC</strong> Clean Rivers Project that exist and need to be evaluated over time. Given the long<br />
time frame of this project and the uncertainties associated with tunneling projects, we are continually monitoring the costs and risks<br />
with the expectation of updating the budget projections when certain milestones have been reached.<br />
II - 4
STORMWATER<br />
The lifetime budget for the Stormwater Service Area is $59 million, a decrease of $3 million from last year primarily due to the<br />
cancellation of certain projects in this area. Over the past few years, extensive dialogue among stormwater task force members<br />
resulted in a better definition of roles, responsibilities and funding sources for the activities required to enhance <strong>DC</strong> stormwater<br />
management. The <strong>DC</strong> Department of the Environment (DDOE) entered into agreements with various offices to provide services in<br />
support of the District’s MS4 permit in accordance with funding availability from the Enterprise Fund. <strong>DC</strong> <strong>Water</strong> provides for the<br />
maintenance and replacement of certain public facilities that convey stormwater runoff to the Anacostia and Potomac Rivers, Rock<br />
Creek, and other receiving streams within certain areas of the District of Columbia, specifically the areas of the District served by<br />
combined sewers. Various other agencies have responsibility for a variety of other stormwater activities. Discussion of other<br />
matters, such as the turnover of stormwater pumping facility maintenance and planned capital replacement of infrastructure in areas<br />
managed by the District under the MS4 permit continues. DDOE maintains the central responsibility for managing stormwater<br />
activities under the MS4 permit and has worked to coordinate with all agencies, the activities and funding mechanisms necessary to<br />
ensure full compliance.<br />
While <strong>DC</strong> <strong>Water</strong> has the Clean Rivers Project to address these issues within the combined sewer areas, <strong>DC</strong> <strong>Water</strong>’s staff continues<br />
to participate in the MS4 task force and to monitor the impact of other MS4 NPDES requirements on <strong>DC</strong> <strong>Water</strong> and its ratepayers.<br />
Significant progress has been made throughout the District. Since 2001, <strong>DC</strong> <strong>Water</strong> collected the MS4 stormwater fees on behalf of<br />
the District, and acted as the Stormwater Administrator until the creation of DDOE and the transfer of duties in early 2007. <strong>DC</strong> <strong>Water</strong><br />
continues to collect those fees on behalf of the District and transfer them to DDOE quarterly. In <strong>FY</strong> 2009, we worked closely with<br />
DDOE to share our impervious surface area database. Along with <strong>DC</strong> <strong>Water</strong>, DDOE believes that this new rate structure can help to<br />
equitably allocate costs of services provided to the cost causers and influence future behavior through education.<br />
SANITARY SEWER<br />
A majority of the sewers in the <strong>DC</strong> <strong>Water</strong> system were constructed more than one hundred years ago and are still in operation.<br />
Aging infrastructure is a national issue and can impact the condition and performance of the system. <strong>DC</strong> <strong>Water</strong> is responsible for<br />
wastewater collection and transmission in the District of Columbia, including operation and maintenance of the sanitary sewer<br />
system. <strong>DC</strong> <strong>Water</strong>’s sanitary sewer system includes approximately 600 miles of large interceptor sewers and smaller gravity<br />
collection sewers. <strong>DC</strong> <strong>Water</strong> is also responsible for sewer lateral connections from the sewer mains to the property lines of<br />
residential, government, and commercial properties. In addition, <strong>DC</strong> <strong>Water</strong> is responsible for the 50 mile long Potomac Interceptor<br />
System under an agreement with the participating jurisdictions. This provides conveyance of wastewater from areas in Virginia and<br />
Maryland to Blue Plains. The existing sanitary sewer system in the District of Columbia dates back to 1810, and includes a variety of<br />
II - 5
materials such as brick and concrete, vitrified clay, reinforced concrete, ductile iron, plastic, steel, brick, cast iron, cast in place<br />
concrete, and even fiberglass.<br />
During <strong>FY</strong> 2009, <strong>DC</strong> <strong>Water</strong> completed a Sewer System Assessment and the <strong>Water</strong> Facility Plan (“Study”). This document culminated<br />
a five year effort involving sewer inspection and condition assessment, development of a sewer GIS and database, hydraulic<br />
monitoring and modeling to assess system capacity and the development of prioritized activities for system improvement. This Study<br />
identified a significant increase in funding needed for specific sewer infrastructure improvements. As recommended by the Study,<br />
the current CIP includes funds for an ongoing, annual sewer inspection program, which may identify the need for additional work.<br />
Key Findings of the 2009 Sewer Facilities Plan:<br />
Generally speaking, major sewer pipe infrastructure can meet current and future population needs; however, continued<br />
investment in upgrades to major infrastructure elements is needed.<br />
88% of the sewers inspected had some defects, 60% of which could be addressed using localized repair and the remaining<br />
require, mainly, lining.<br />
94% of the manholes inspected were found to have one or more defects<br />
The number and severity of pipe defects indicates an expected increase in problems in pipes greater than 75 years old.<br />
Older pipes can be in good condition (and younger ones can be in poor condition), but at the 75 year mark, <strong>DC</strong> <strong>Water</strong> can<br />
assume that more extensive and frequent inspection is needed.<br />
There are approximately 210 miles of sewers in stream valleys and about 12.3 miles of these sewers were found to need<br />
some type of repair.<br />
There are about 316,000 linear feet of sewers with some portion under buildings; of those inspected, a preliminary list has<br />
been developed, and approximately 7,000 linear feet of sewers have been found to have multiple and/or significant defects,<br />
warranting rehabilitation or replacement.<br />
Key Recommendation of 2009 Sewer Facilities Plan- continue a two-pronged, parallel approach to the CIP program:<br />
Implement identified projects resulting from ongoing system condition and needs assessment, and an increase in the<br />
continued annual sewer pipe renewal program.<br />
Based on a 20-year planning outlook, this will require a $1.2 billion increase (2008 dollars) in capital spending to address<br />
currently identified projects ($536 million) and a sewer pipe renewal program ($664 million).<br />
The lifetime budget in this area has increased by $20 million from last years estimate and the proposed 10-year CIP has also been<br />
increased by just over $22 million as a result of the adding of <strong>FY</strong> <strong>2020</strong> and the dropping of <strong>FY</strong> 2010. Both of these amounts are<br />
expected to continue to increase in future years to reflect the ramping-up of this program through <strong>FY</strong> 2015 as recommended in the<br />
II - 6
facility plan. There is approximately $232 million related to above referenced - - and already identified - - projects in the lifetime<br />
budget for this service area. The remaining amounts (about $300 million) will be included in future requests as they are analyzed and<br />
prioritized with all other funding needed for all service areas.<br />
Also, there are approximately $180 million in sanitary collection sewer projects identified in the 10-year <strong>Capital</strong> <strong>Improvement</strong> Plan<br />
that transmit some flow from our wholesale customers. These are projects in planning or design exclusive of projects already under<br />
construction. D.C. <strong>Water</strong> has implemented a new hydrodynamic model to determine our wholesale customer’s share of these<br />
projects. Accordingly, we have reached a preliminary agreement that their share of these projects totals approximately $60 million;<br />
pending this agreement this portion was previously identified in the CIP as assigned to the District of Columbia ratepayers as a<br />
placeholder. The suburban share of these projects is consistent with the 1985 Inter Municipal Agreement (IMA) as well as the proposed<br />
new 2012 IMA.<br />
WATER<br />
The lifetime budget for the <strong>Water</strong> Service Area (including Meter Replacement / AMR installation) is $1.5 billion, an increase of $52.4<br />
million from last year’s CIP, even though the spending within the 10-year CIP timeframe show a slight decrease. This is primarily<br />
driven by the continuing ramping-up through <strong>FY</strong> 2015 of the <strong>Water</strong> Facility Plan that was completed in <strong>FY</strong> 2009 to achieve the<br />
replacement of one percent of the small diameter water main infrastructure per year.<br />
Major water projects include construction of new storage facilities; water main replacements, rehabilitations and extensions; fire<br />
hydrant replacements; and valve replacements.<br />
Projects in the <strong>Water</strong> Service Area are designed to maintain an adequate and reliable potable water supply to customers, and fire<br />
protection. Categories of projects include the rehabilitation and replacement of water mains, storage facilities, and pumping stations.<br />
This area also includes water service line and meter replacement.<br />
WASHINGTON AQUEDUCT<br />
The Washington Aqueduct (Aqueduct), managed by the U.S. Army Corps of Engineers, provides water, in wholesale, to <strong>DC</strong> <strong>Water</strong><br />
and its partners in Northern Virginia, Arlington County and Falls Church. <strong>DC</strong> <strong>Water</strong> purchases a little less than 75 percent of the<br />
water produced by the Aqueduct’s two treatment facilities, the Dalecarlia and McMillan treatment plants, and thus is responsible for<br />
nearly 75 percent of the Aqueduct’s operating and capital costs. Under federal legislation and a memorandum of understanding<br />
enacted in 1997, <strong>DC</strong> <strong>Water</strong> and its Northern Virginia partners have a much greater role in oversight of the Aqueduct’s operations and<br />
its capital improvement program.<br />
II - 7
The proposed lifetime budget for <strong>DC</strong> <strong>Water</strong>’s share of Washington Aqueduct projects remains at $203.1 million. The budget reflects<br />
the prioritized need for infrastructure improvements over the next ten years.<br />
CAPITAL EQUIPMENT<br />
<strong>DC</strong> <strong>Water</strong>’s <strong>Capital</strong> Equipment budget totals approximately $98.3 million for the <strong>FY</strong> 2011 – <strong>FY</strong> <strong>2020</strong> plan, a decrease of<br />
approximately $5.6 million compared to the last ten-year plan. Approximately fifty-five percent of spending in the capital equipment<br />
area is on major information technology projects, including the document management system ($3.2 million) and the asset<br />
management system ($6.2 million). <strong>DC</strong> <strong>Water</strong> continues its commitment to scheduled replacement of its vehicle fleet with a ten year<br />
budget of $12.2 million, representing more than twelve percent of the ten-year plan. Finally, maintenance of large equipment totals<br />
$9.8 million or about ten percent of the ten-year plan. Other equipment including pumps, valves, meters and hydrants necessary for<br />
maintenance (including that of the District’s public fire system) totals $11.6 million.<br />
The revised <strong>FY</strong> 2012 budget at $15.3 million is $1.2 million more than the currently approved budget. This variance is primarily<br />
attributable to increases in budgets for Fleet Management and Maintenance Services.<br />
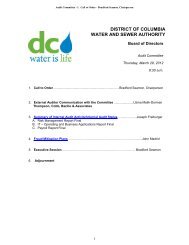
CIP DEVELOPMENT AND APPROVAL PROCESS<br />
<strong>DC</strong> <strong>Water</strong>’s capital budget review process begins each year in the spring, as part of both our capital and operating budget review<br />
process. This process includes a review of major accomplishments, priorities, status of major projects and emerging regulatory and<br />
related issues impacting the capital program. Projections of changes in project lifetime budgets are also included. The review<br />
process involves the <strong>DC</strong> <strong>Water</strong> departments with responsibility for managing the operations of <strong>DC</strong> <strong>Water</strong> Services, the capital<br />
projects as well as finance and budget staff and executive management. The CIP is integrated into <strong>DC</strong> <strong>Water</strong>’s ten-year financial<br />
plan; because of its size, it is the primary driver of <strong>DC</strong> <strong>Water</strong>’s projected rate increases over the current 10 year planning period.<br />
This review process lasts over several months and culminates with the presentation of the updated CIP to <strong>DC</strong> <strong>Water</strong>’s Board of<br />
Directors’ Environmental Quality & Sewerage Services, <strong>Water</strong> Quality and <strong>Water</strong> Services, Finance & Budget and <strong>DC</strong> Retail <strong>Water</strong><br />
and Sewer Rates Committees in October. The Committees complete their review from October through December. The operating<br />
budgets, capital improvement program, and ten-year financial plan are then forwarded to the full Board for its consideration in late<br />
winter; usually January. This year, the Board delayed final review and adoption of a new budget until February due to the<br />
extraordinary regional economic challenges and rigorous re-investment requirements necessary to maintain safe, reliable services.<br />
After adoption by the Board of Directors, <strong>DC</strong> <strong>Water</strong> is required to submit its annual operating and capital budgets to the Mayor and<br />
the District of Columbia Council for its review and comment; however, neither has power to change <strong>DC</strong> <strong>Water</strong>’s annual budgets.<br />
Final operating and capital budget numbers, along with the capital authority request will be forwarded to the District for inclusion in<br />
II - 8
the District of Columbia’s budget submission to Congress. <strong>DC</strong> <strong>Water</strong>’s request for capital authority is ultimately made to and<br />
approved by the U.S. Congress.<br />
DISBURSEMENTS AND PROJECT LIFETIME BUDGETS<br />
As in the past, we have presented the CIP on both a project lifetime basis and cash disbursement basis. During the CIP review<br />
process, we perform an extensive review of the total project, or “lifetime” budgets, which also reflect historical spending prior to the<br />
current ten-year period, projected spending beyond the current ten-year period and project contingencies. Project lifetime budgets<br />
are our primary area of focus in budget development and day-to-day monitoring. In addition to lifetime budgets, we also develop<br />
cash disbursements forecast. Actual cash disbursements are critical to forecasting the anticipated level of rate increases and the<br />
amount and timing of capital financings. While cash disbursements are a function of project lifetime budgets, they reflect a more<br />
realistic projection of actual “cash out the door” excluding contingencies and taking into account historical and projected completion<br />
rates.<br />
As in prior years, the budget document includes a comparison of this year’s vs. last year’s lifetime project budgets by program area<br />
for the Board’s review. Changes have been made to some of the project lifetime budgets approved from last year due to a change in<br />
project scope, engineering cost estimates, site changes and other related issues. In addition, some projects are either closed or<br />
dropped from the CIP. Projects for which all activities have been completed during a given fiscal year are listed as ‘Closed’ during<br />
that fiscal year; these same projects are, then, listed as ‘Dropped’ in the immediately following fiscal year.<br />
CAPITAL AUTHORITY<br />
As part of <strong>DC</strong> <strong>Water</strong>’s enabling legislation, Congressional appropriation authority is required before any capital design or construction<br />
contract can be entered into. The <strong>FY</strong> 2013 request totals $606.1 million, and reflects the following:<br />
• Remaining authority from prior years’ appropriations;<br />
• Projected commitments in <strong>FY</strong> 2012 and <strong>FY</strong> 2013;<br />
• Planned <strong>FY</strong> 2014 and <strong>FY</strong> 2015 commitments, to ensure adequate authority exists, in the event that any projects are<br />
accelerated.<br />
• Risk allowance associated with the start of construction for the Blue Plains Tunnel<br />
Due to the timing of the Congressional appropriations process, authority requests must be made well in advance of commitment<br />
execution. Including projected <strong>FY</strong> 2014 and <strong>FY</strong> 2015 commitments (a 24-month ‘look ahead’) allows us adequate flexibility to<br />
continue with contract commitments in the event that the U.S Congress delays budget approval and allows us to quickly accelerate<br />
or reprioritize projects into earlier years as approved by the Board. While this gives us flexibility to reprioritize projects, it should be<br />
II - 9
noted that such changes and execution of any contract still require General Manager’s approval, with major projects and contracts<br />
requiring Board approval.<br />
MAJOR ASSUMPTIONS<br />
Inflation: All project costs are typically inflated at three percent annually to the mid-point of construction.<br />
Contingency: <strong>DC</strong> <strong>Water</strong> capital projects include project contingencies ranging from five to fifteen percent, based on the size of the<br />
project.<br />
PROJECT PAGES<br />
This document contains individual sections for each of <strong>DC</strong> <strong>Water</strong>’s seven service areas. Each service area is made up of specific<br />
projects. Within each service area section in this document, there are individual project sheets for each current capital project in that<br />
section. The capital project sheets contain general information for each project. The following information is included:<br />
Service Area Title – currently, there are seven defined project service areas in <strong>DC</strong> <strong>Water</strong>’s CIP. The seven areas are:<br />
Wastewater Treatment, Combined Sewer Overflow / LTCP, Stormwater, Sanitary Sewer, <strong>Water</strong>, Washington Aqueduct and<br />
<strong>Capital</strong> Equipment. The service area categorization groups together similar projects based on facility location and type of<br />
work being done in the project. Congressional capital authority is requested at this level.<br />
<strong>Program</strong> Title – is a further categorization within the Service Area and groups projects by type of process. For example, in<br />
the Wastewater Treatment Service Area, there are four programs: Liquid Processing, Plantwide projects, Solids Processing<br />
and Total Nitrogen Removal.<br />
Activity Group/Project Title – The activity group is the level at which <strong>DC</strong> <strong>Water</strong> manages and monitors projects, including in<br />
the financial system and project management system. The project title reflects the descriptive name given to the project.<br />
Service Area Manager – lists which department or organization manages the project. The majority of the projects in <strong>DC</strong><br />
<strong>Water</strong>’s CIP are managed by an internal <strong>DC</strong> <strong>Water</strong> operating department. <strong>DC</strong> <strong>Water</strong>’s CIP also includes some projects which<br />
are managed by outside organizations. It is advantageous for <strong>DC</strong> <strong>Water</strong> to coordinate some of its capital work on the water<br />
and sewer infrastructure with the District’s Department of Transportation (DDOT). The funding required for <strong>DC</strong> <strong>Water</strong>’s work<br />
is included in the CIP, but those projects are managed by DDOT. Approximately 75 percent of the Washington Aqueduct’s<br />
capital program is funded by <strong>DC</strong> <strong>Water</strong>, but the U.S. Army Corps of Engineers actually manages those projects.<br />
II - 10
Priority – <strong>DC</strong> <strong>Water</strong> engages in and prioritizes capital projects based on specific criteria. A project comprises of one or more<br />
jobs which, in turn, have individual priorities. The Priority mentioned on the capital project-sheets (listed in different sections of<br />
this book) is the one that has the largest budgeted dollars associated with it. The following is a list of definitions of the<br />
priorities shown on the individual project sheets:<br />
1A. Court Ordered, Stipulated Agreements, Etc.<br />
These are the projects that are undertaken to comply with court orders, stipulated agreements, regulatory issues, and the<br />
National Pollutant Discharge Elimination Permit (NPDES).<br />
2A. Health Safety<br />
These are projects that are required to eliminate or mitigate impact on public health or safety. These projects are also<br />
required to ensure that there is no failure to comply with <strong>DC</strong> <strong>Water</strong>’s NPDES permit requirements.<br />
2B. Board Policy, <strong>DC</strong> <strong>Water</strong>'s commitment to outside agencies<br />
These are projects that are undertaken to comply with a policy that the Board may adopt as a result of its commitment<br />
to outside Agencies.<br />
2C. Potential Failure/Ability to continue meeting permit requirement<br />
These are projects that are undertaken to construct or rehabilitate Facilities or Equipment that is in danger of failing,<br />
and that such failure may potentially endanger <strong>DC</strong> <strong>Water</strong>’s ability to continue meeting permit requirements.<br />
2D. High Profile, Good Neighbor Policy<br />
These are projects that are undertaken to remediate concerns expressed by Citizens or Public Officials.<br />
3A. Good Engineering, High pay back, Mission / Function<br />
II - 11
This category includes projects that are needed for rehabilitation and upgrading of facilities and infrastructure required<br />
for <strong>DC</strong> <strong>Water</strong> to fulfill its mission and function, as well as projects needed to resolve operational issues and<br />
inefficiencies. This category also recognizes cost savings in operation and maintenance.<br />
3B. Good Engineering, Low, M&F over long term<br />
This category includes projects that are needed for rehabilitation and upgrading of facilities and infrastructure, but<br />
have a lower priority than projects in 3A above, yet help <strong>DC</strong> <strong>Water</strong> to fulfill its mission over the long term.<br />
Project Description – general description of the work to be done within the project.<br />
Impact on Operations – describes the anticipated impact on <strong>DC</strong> <strong>Water</strong>’s operations when the project is completed.<br />
Design / Construction / Project Completion Dates– anticipated dates are shown.<br />
Funding by User – lists the anticipated project funding, by source and is based on the current Intermunicipal Agreement<br />
(IMA) and anticipates EPA funding where grants have been previously approved or in anticipation of that approval.<br />
Life Budget – the full project budget is approved and reviewed each year by <strong>DC</strong> <strong>Water</strong>’s Board of Directors. Proposed<br />
increases or decreases to the total project life budget are shown, if applicable. Lifetime budgets for program management<br />
have been reduced, and project budgets increased, to reflect the allocation of costs for program management services at the<br />
conclusion of the prior fiscal year.<br />
Disbursements / Commitments Budgets – projected disbursements and commitments for various projects are shown by fiscal<br />
year in which they are anticipated. Commitments budgets are based on total project budgets, which reflect the fully loaded,<br />
anticipated costs of a project, including project contingencies. Contingencies are not included when calculating disbursement<br />
budgets.<br />
II - 12
CAPITALIZATION POLICY<br />
<strong>DC</strong> <strong>Water</strong>’s capitalization policy determines how expenditures will be recognized and accounted for. Because we also match the<br />
financing to the projected useful life of the item, it also determines how projects will be financed. The following guidelines are used to<br />
categorize items as capital, capital equipment or operating (maintenance):<br />
Maintenance related items – are routine, cost under $5,000, and do not extend the life of the item more than 3 years.<br />
<strong>Capital</strong> Equipment – has a life of at least 3 years, a cost exceeding $5,000 and is financed with short-term debt or cash.<br />
<strong>Capital</strong> Project – has a long life (average of 30 years), a minimum cost of $500,000, and is financed with 30 year bonds.<br />
II - 13
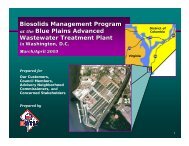
Historical and Projected <strong>Capital</strong> Spending<br />
<strong>FY</strong> 2003 - <strong>FY</strong> 2013<br />
($ in 000's)<br />
$700,000<br />
665,701<br />
$600,000<br />
531,741<br />
$500,000<br />
$400,000<br />
$300,000<br />
$200,000<br />
204,421<br />
238,268<br />
202,719<br />
191,283<br />
176,800<br />
303,387<br />
254,636 262,157<br />
297,378<br />
$100,000<br />
$0<br />
II - 14
<strong>FY</strong> 2011 - <strong>FY</strong> <strong>2020</strong> PROJECTED CAPITAL IMPROVEMENT PLAN (CIP) - DISBURSEMENTS BASIS ($ in 000's)<br />
Wastewater Treatment<br />
<strong>FY</strong> 2011<br />
Actuals<br />
<strong>FY</strong> 2012<br />
Revised<br />
<strong>FY</strong> 2013<br />
Approved<br />
<strong>FY</strong> 2014 <strong>FY</strong> 2015 <strong>FY</strong> 2016 <strong>FY</strong> 2017 <strong>FY</strong> 2018 <strong>FY</strong> 2019 <strong>FY</strong> <strong>2020</strong> Total<br />
<strong>FY</strong> '11 -'20<br />
Liquid Processing Projects $11,080 $23,263 $35,371 $18,756 $7,578 $5,010 $12,074 $8,300 $7,428 $992 $129,851<br />
Plantwide Projects 17,067 18,018 18,645 13,788 5,992 3,204 3,894 12,140 6,741 1,468 100,957<br />
Solids Processing Projects 48,822 119,294 194,973 71,080 15,734 6,467 2,851 355 1 - 459,576<br />
Enhanced Nitrogen Removal Facilities<br />
(formerly BTN - Total Nitrogen <strong>Program</strong> ) 48,910 115,269 129,660 105,690 81,495 89,399 77,104 21,430 2,652 1,890 673,498<br />
Sub-total 125,879 275,844 378,649 209,313 110,799 104,080 95,923 42,224 16,822 4,350 1,363,882<br />
Sanitary Sewer<br />
Sanitary Collection Sewers 1,674 2,140 6,174 11,611 8,873 3,924 5,690 7,268 7,766 7,725 62,844<br />
Sanitary On-Going Projects 7,171 16,081 15,694 6,795 7,075 7,659 7,865 8,138 8,590 9,229 94,298<br />
Sanitary Pumping Facilities 424 659 636 696 37 - - - - - 2,452<br />
Sanitary Sewer Projects <strong>Program</strong> Management 3,488 6,880 4,454 6,189 6,821 6,630 6,748 7,790 6,633 5,160 60,794<br />
Sanitary Interceptor/Trunk Force Sewers 11,737 14,162 18,422 31,488 41,529 26,354 20,983 32,732 21,431 17,997 236,834<br />
Sub-total 24,494 39,922 45,381 56,779 64,335 44,567 41,286 55,928 44,419 40,110 457,223<br />
Combined Sewer Overflow / Long Term Control Plan<br />
CSM CSO <strong>Program</strong> Management 1,089 1,590 1,533 2,272 1,840 1,555 1,593 2,181 2,645 2,105 18,402<br />
CSO Combined Sewer Projects:Nine Minimum Controls 35,368 6,971 2,021 309 12 4 - - - - 44,685<br />
CSO Combined Sewer Projects:Others - 7,533 8,611 17,071 16,186 18,109 12,030 9,550 9,644 12,476 111,210<br />
CLT D.C. Clean Rivers Project (aka Long-Term Control Plan)<br />
CY Anacostia Tunnel 39,744 114,366 138,668 91,726 143,635 132,510 122,307 36,237 53,200 83,986 956,379<br />
CZ Potomac Tunnel 1,086 1,270 961 309 1,533 5,132 5,233 8,412 11,639 12,028 47,603<br />
DZ Rock Creek Tunnel 584 286 227 71 - 232 771 800 1,417 2,026 6,414<br />
Sub-total 77,872 132,016 152,021 111,758 163,206 157,542 141,934 57,180 78,545 112,621 1,184,694<br />
Stormwater<br />
Stormwater Local Drainage - 17 104 69 65 83 92 95 98 93 715<br />
Stormwater On-Going <strong>Program</strong> 105 731 452 468 464 512 465 483 522 199 4,400<br />
Stormwater Pumping Facilities - -<br />
DDOT Stormwater <strong>Program</strong> - 2 8 9 19 18 18 10 10 - 93<br />
Stormwater Research and <strong>Program</strong> Management 836 499 250 238 193 163 162 222 270 214 3,047<br />
Stormwater Trunk/Force Sewers 1,219 1,527 3,462 1,762 60 - - - - - 8,029<br />
Sub-total 2,160 2,775 4,276 2,545 801 775 737 810 900 506 16,284<br />
<strong>Water</strong><br />
<strong>Water</strong> Distribution Systems 21,542 23,024 28,404 31,809 29,435 29,239 33,925 33,316 32,933 42,819 306,448<br />
<strong>Water</strong> On-Going Projects 8,811 8,239 6,681 5,994 6,188 6,364 7,508 6,548 7,159 6,851 70,343<br />
<strong>Water</strong> Pumping Facilities 1,778 5,327 6,273 7,921 3,375 1,373 3,168 7,062 - 84 36,361<br />
DDOT <strong>Water</strong> Projects 3,740 4,002 5,613 6,583 4,616 4,906 5,126 5,730 5,808 7,857 53,982<br />
<strong>Water</strong> Storage Facilities 1,275 2,083 4,221 7,860 5,748 6,946 4,264 4,122 3,192 1,997 41,710<br />
<strong>Water</strong> Projects <strong>Program</strong> Management 4,357 4,109 4,081 3,242 3,870 3,672 3,669 3,726 3,748 2,175 36,649<br />
<strong>Water</strong> Lead <strong>Program</strong> 2,611 4,801 2,372 2,077 2,246 2,414 2,528 2,627 - - 21,676<br />
Meter Replacement /AMR Installation 2,784 2,876 1,790 1,332 3,166 3,205 3,385 3,330 3,774 3,472 29,114<br />
Sub-total 46,898 54,461 59,436 66,820 58,643 58,121 63,572 66,461 56,614 65,255 596,282<br />
Washington Aqueduct 9,490 11,373 10,598 10,744 11,016 11,280 11,588 10,891 10,323 9,842 107,144<br />
<strong>Capital</strong> Equipment 10,585 15,349 15,341 12,384 9,173 7,278 7,348 7,648 6,778 6,778 98,662<br />
Total <strong>FY</strong> 2013 <strong>DC</strong> <strong>Water</strong> CIP $297,378 $531,741 $665,701 $470,343 $417,972 $383,644 $362,387 $241,142 $214,401 $239,462 $3,824,170<br />
II - 15
<strong>FY</strong> 2011 - <strong>FY</strong> <strong>2020</strong> <strong>Capital</strong> <strong>Improvement</strong> Plan<br />
Project Lifetime Budgets by <strong>Program</strong> Area ($ 000's)<br />
<strong>FY</strong> 2012<br />
Approved<br />
<strong>FY</strong> 2012<br />
Revised /<br />
<strong>FY</strong> 2013<br />
Approved<br />
Variance<br />
Wastewater Treatment<br />
Liquid Processing Projects 612,749 622,106 9,357<br />
Plantwide Projects 337,671 345,887 8,216<br />
Solids Processing Projects 688,806 719,537 30,731<br />
Enhanced Nitrogen Removal Facilities<br />
(formerly BTN - Total Nitrogen <strong>Program</strong> ) 1,024,855 988,778 (36,077)<br />
Sub-total 2,664,081 2,676,308 12,227<br />
Sanitary Sewer<br />
Sanitary Collection Sewers 133,906 133,906 0<br />
Sanitary On-Going Projects 142,067 159,677 17,610<br />
Sanitary Pumping Facilities 25,898 25,898 -<br />
Sanitary Sewer Projects <strong>Program</strong> Management 103,150 103,135 (15)<br />
Sanitary Interceptor/Trunk Force Sewers 430,144 432,583 2,439<br />
Sub-total 835,165 855,199 20,034<br />
Combined Sewer Overflow<br />
CSO <strong>Program</strong> Management 55,239 55,239 -<br />
Combined Sewer Projects: Nine Minimum Controls 215,387 213,888 (1,499)<br />
Combined Sewer Projects: Others 240,013 244,844 4,831<br />
Clean Rivers Project (aka Long-Term Control Plan)<br />
Anacostia Tunnel 1,672,282 1,672,282 -<br />
Potomac Tunnel 418,700 418,700 -<br />
Rock Creek Tunnel 70,342 70,342 -<br />
Sub-total 2,671,963 2,675,295 3,332<br />
Stormwater<br />
Stormwater Extensions/Local Drainage 17,999 17,999 0<br />
Stormwater On-Going <strong>Program</strong> 9,658 9,658 0<br />
Stormwater Pumping Facilities 0 0 -<br />
DDOT Stormwater <strong>Program</strong> 5,066 4,720 (346)<br />
Stormwater Projects <strong>Program</strong> Management 10,630 10,630 -<br />
Stormwater Trunk/Force Sewers 18,605 15,504 (3,101)<br />
Sub-total 61,958 58,511 (3,447)<br />
II - 16
<strong>FY</strong> 2011 - <strong>FY</strong> <strong>2020</strong> <strong>Capital</strong> <strong>Improvement</strong> Plan<br />
Project Lifetime Budgets by <strong>Program</strong> Area ($ 000's)<br />
<strong>FY</strong> 2012<br />
Approved<br />
<strong>FY</strong> 2012<br />
Revised /<br />
<strong>FY</strong> 2013<br />
Approved<br />
Variance<br />
<strong>Water</strong><br />
<strong>Water</strong> Distribution Systems 666,933 695,720 28,787<br />
<strong>Water</strong> Lead <strong>Program</strong> 191,000 191,040 40<br />
<strong>Water</strong> On-Going Projects 112,121 117,541 5,420<br />
<strong>Water</strong> Pumping Facilities 150,149 161,372 11,223<br />
DDOT <strong>Water</strong> Projects 95,892 91,538 (4,354)<br />
<strong>Water</strong> Storage Facilities 71,862 74,311 2,449<br />
<strong>Water</strong> Projects <strong>Program</strong> Management 51,107 47,559 (3,548)<br />
Meter Replacement /AMR Installation 61,151 73,534 12,383<br />
Sub-total 1,400,215 1,452,615 52,400<br />
Washington Aqueduct 203,138 203,138 0<br />
<strong>Capital</strong> Equipment 103,906 98,307 (5,599)<br />
Total <strong>DC</strong> <strong>Water</strong> CIP Lifetime (see notes) 7,940,426 8,019,373 78,947<br />
Notes:<br />
1 Lifetime budgets shown here represent total budgets for projects that are active during the current 10-year CIP. Lifetime<br />
budgets include historical spending prior to the beginning of the current 10-year plan, spending during the 10-year plan, and<br />
projected spending beyond the current 10-year plan. Projects completed in <strong>FY</strong> 2011 will be dropped from the CIP next year.<br />
2 These budgets do not include inhouse labor costs, estimated to be in the $8 to $9 million range, annually, and are applicable to,<br />
primarily, the time charged to capital projects by employees in the Departments of Engineering and Technical Services, Sewer Services,<br />
and <strong>Water</strong> Services.<br />
II - 17
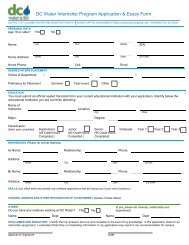
Fiscal Year 2013 <strong>Capital</strong> Authority Request<br />
($ 000's)<br />
Fiscal Year 2013<br />
*<strong>Capital</strong> Authority Request<br />
Service Areas<br />
Blue Plains Wastewater Treatment<br />
$277,007<br />
Sanitary Sewer System 88,795<br />
Combined Sewer Overflow<br />
124,734<br />
Stormwater 2,683<br />
<strong>Water</strong> System 91,894<br />
Washington Aqueduct (<strong>DC</strong> <strong>Water</strong> share) 10,848<br />
<strong>Capital</strong> Equipment 10,129<br />
Total $606,090<br />
1<br />
1<br />
*<br />
The authority request includes a 24 month look-ahead, i.e.,<br />
it also takes into account projected commitments for<br />
<strong>FY</strong> 2014 and <strong>FY</strong> 2015.<br />
1 Includes Special Risk Allowance of $20 million, and $122 million for Enhanced<br />
Nitrogen Removal (formerly Total Nitrogen - "BTN"), and Clean Rivers (aka Long<br />
Term Control Plan - "LTCP") <strong>Program</strong>s, respectively, although not part of<br />
their Lifetime Budgets.<br />
II - 18
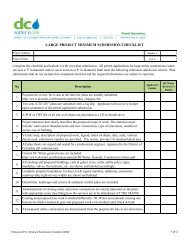
<strong>FY</strong> 2011 - <strong>2020</strong> CAPITAL IMPROVEMENT PROGRAM<br />
Sources of Funds<br />
($000's)<br />
EPA Grants & CSO Appropriations<br />
$311,392<br />
8%<br />
Interest Income on Bond Proceeds<br />
$17,315<br />
1%<br />
Wholesale <strong>Capital</strong> Payments<br />
$911,171<br />
24%<br />
Pay-Go Financing (1)<br />
$317,960<br />
8%<br />
Revenue Bonds/Commercial Paper<br />
$2,268,364<br />
59%<br />
(1) Debt financing refers to the borrowingof funds through long-term revenue bonds, commercial paper and other short term notes.<br />
(2) Pay-go financing is any funds available after funding the greater of 120 day or 125.5million operating and maintenance reserve, approximately<br />
$125.5million in <strong>FY</strong> 2012. These transfers reduce the amount of new debt issuance.<br />
II - 19
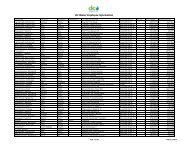
List of New Projects<br />
Project I.D. Project Title Service Area Budgeted Cost<br />
HS Rehabilitation of Influent Sewers Sanitary Sewer $3,000,000<br />
JI <strong>FY</strong><strong>2020</strong> - DSS Sanitary Sewer Projects Sanitary Sewer 12,568,000<br />
JQ Hydraulic Protection Project Sanitary Sewer 1,723,000<br />
IX Headworks HVAC Rehab Wastewater 366,000<br />
JY IT - Data Center Wastewater 3,335,175<br />
J7 Small Diameter <strong>Water</strong> Main Rehabilitation 17 <strong>Water</strong> 36,250,000<br />
J8 <strong>FY</strong><strong>2020</strong> - DDOT <strong>Water</strong> Projects <strong>Water</strong> 10,400,000<br />
JA <strong>FY</strong><strong>2020</strong> - DWS <strong>Water</strong> Projects <strong>Water</strong> 9,955,000<br />
JB Bryant Street PS <strong>Improvement</strong>s - Phase II <strong>Water</strong> 2,800,000<br />
JJ Bryant Street PS <strong>Improvement</strong>s - Phase III <strong>Water</strong> 6,100,000<br />
$86,497,175<br />
II - 20
List of Closed / Dropped Projects<br />
Project I.D. Project Title Service Area<br />
Cost<br />
at<br />
Completion<br />
Closed Projects<br />
P1 <strong>FY</strong>2000 - DDOT STORMWATER PROJECTS Stormwater $409,709<br />
P2 <strong>FY</strong>2001 - DDOT STORMWATER PROJECTS Stormwater 607,789<br />
P3 <strong>FY</strong>2002 - DDOT STORMWATER PROJECTS Stormwater 119,639<br />
P4 <strong>FY</strong>2003 - DDOT STORMWATER PROJECTS Stormwater -<br />
H1 MWCOG Budget Items Wastewater 39,499<br />
AS <strong>FY</strong>2009 - DDOT <strong>Water</strong> Projects <strong>Water</strong> 92,152<br />
MT Small Diameter <strong>Water</strong>main Rehab. (1) <strong>Water</strong> 11,653,488<br />
MY Elim. Dead Ends (Contract 3 & 4) <strong>Water</strong> 7,693,453<br />
$20,615,729<br />
Dropped Projects<br />
A3 16 inch Tie-in to McMilliam Plant <strong>Water</strong> $2,745,275<br />
E3 <strong>FY</strong> 2003 - DWS <strong>Water</strong> Projects <strong>Water</strong> 7,637,639<br />
R1 <strong>FY</strong>2000 - DDOT <strong>Water</strong> Projects <strong>Water</strong> 1,259,221<br />
R2 <strong>FY</strong>2001 - DDOT <strong>Water</strong> Projects <strong>Water</strong> 1,078,874<br />
R3 <strong>FY</strong>2002 - DDOT <strong>Water</strong> Projects <strong>Water</strong> 2,550,092<br />
R4 <strong>FY</strong>2003 - DDOT <strong>Water</strong> Projects <strong>Water</strong> 4,241,277<br />
R5 <strong>FY</strong>2004 - DDOT <strong>Water</strong> Projects <strong>Water</strong> 653,266<br />
R6 <strong>FY</strong>2005 - DDOT <strong>Water</strong> Projects <strong>Water</strong> 452,844<br />
R7 <strong>FY</strong>2006 - DDOT <strong>Water</strong> Projects <strong>Water</strong> 38,532<br />
R8 <strong>FY</strong>2007 - DDOT <strong>Water</strong> Projects <strong>Water</strong> 4,214,954<br />
R9 <strong>FY</strong>2008 - DDOT <strong>Water</strong> Projects <strong>Water</strong> 265,061<br />
DB Sewer Services Field Facility & Relocation Sanitary Sewer 446,197<br />
$25,583,232<br />
II - 21