San Marcos River Watershed - Guadalupe-Blanco River Authority
San Marcos River Watershed - Guadalupe-Blanco River Authority
San Marcos River Watershed - Guadalupe-Blanco River Authority

You also want an ePaper? Increase the reach of your titles
YUMPU automatically turns print PDFs into web optimized ePapers that Google loves.
SH 123<br />
BS 123B<br />
FM 3353<br />
FM 1117<br />
SH 304<br />
RM 2722<br />
FM 1863<br />
RM 32<br />
FM 2673<br />
COMAL<br />
Legend<br />
FM 482<br />
SL 337<br />
1813<br />
FM 78<br />
IH 10<br />
1815<br />
BS 46C<br />
Monitoring Station<br />
Stream Segment<br />
FM 465<br />
FM 306<br />
York Creek<br />
BI 35H<br />
FM 1044<br />
Segment Boundary<br />
Tributary<br />
<strong>Watershed</strong> Boundary<br />
City<br />
Oil Reserve<br />
" Domestic WW Permit<br />
FM 1101<br />
SINK CR<br />
FM 483<br />
" Texas Land Application Permit<br />
# USGS Gage<br />
SAN MARCOS<br />
FM 725<br />
Water Hole Creek<br />
FM 1102<br />
Caney Creek<br />
Mesquite Creek<br />
FM 775<br />
SH 46<br />
RM 12<br />
FM 2439<br />
FM 464<br />
<strong>Blanco</strong><br />
<strong>River</strong><br />
IH 35<br />
12672-G<br />
12671-T<br />
"<br />
MARTINDALE<br />
12628-T<br />
"<br />
FM 758<br />
FM 725<br />
FM 467<br />
FM 3407<br />
SL 82<br />
#<br />
Long Creek<br />
FM 1979<br />
FM 1339<br />
GUADALUPE<br />
FM 477<br />
1809<br />
FM 1978<br />
FM 2623<br />
<strong>San</strong> <strong>Marcos</strong> <strong>River</strong> <strong>Watershed</strong><br />
RM 150<br />
FM 621<br />
BI 35J<br />
SH 21<br />
YORK CR<br />
FM 466<br />
HAYS<br />
RM 150<br />
FM 1984<br />
*A<br />
FM 1979<br />
FM 1966<br />
FM 20<br />
SH 80<br />
Dickerson Creek<br />
"<br />
"<br />
FM 2438<br />
FM 1977<br />
FM 1104<br />
Callihan Creek<br />
FM 2720<br />
US 90<br />
FM 1150<br />
FM 2001<br />
SH 142<br />
SAN MARCOS R<br />
Wolf Creek<br />
Highsmith Creek<br />
PR 10<br />
US 183<br />
FM 671<br />
FM 2984<br />
Smith Creek<br />
SH 80<br />
FM 1185<br />
LOCKHART<br />
FM 1322<br />
LULING<br />
"<br />
12626-G<br />
#<br />
"<br />
1808<br />
FM 672<br />
FM 1854<br />
US 183<br />
PR 11<br />
"<br />
FM 20<br />
FM 86<br />
FM 1586<br />
FM 3158<br />
FM 2091<br />
GONZALES<br />
Mule Creek<br />
Artesia Creek<br />
"<br />
Canoe Creek<br />
1808<br />
FM 2091<br />
FM 812<br />
CALDWELL<br />
®<br />
Dry Fork<br />
FM 794<br />
16578-G<br />
Smith Creek<br />
FM 535<br />
FM 713<br />
GONZALES<br />
SS 146<br />
US 90<br />
UA 90<br />
SH 97<br />
FM 532<br />
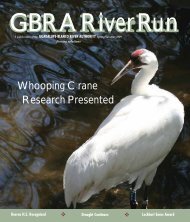
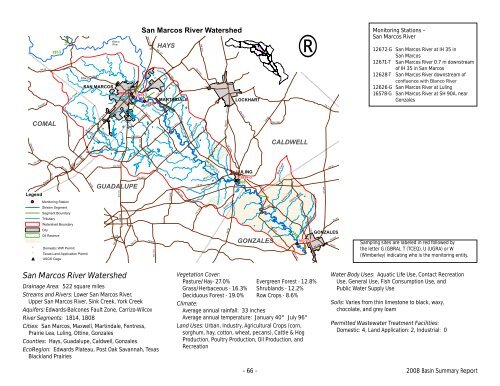
Monitoring Stations –<br />
<strong>San</strong> <strong>Marcos</strong> <strong>River</strong><br />
12672-G <strong>San</strong> <strong>Marcos</strong> <strong>River</strong> at IH 35 in<br />
<strong>San</strong> <strong>Marcos</strong><br />
12671-T <strong>San</strong> <strong>Marcos</strong> <strong>River</strong> 0.7 m downstream<br />
of IH 35 in <strong>San</strong> <strong>Marcos</strong><br />
12628-T <strong>San</strong> <strong>Marcos</strong> <strong>River</strong> downstream of<br />
<br />
12626-G <strong>San</strong> <strong>Marcos</strong> <strong>River</strong> at Luling<br />
16578-G <strong>San</strong> <strong>Marcos</strong> <strong>River</strong> at SH 90A, near<br />
Gonzales<br />
Sampling sites are labeled in red followed by<br />
the letter G (GBRA), T (TCEQ), U (UGRA) or W<br />
(Wimberley) indicating who is the monitoring entity.<br />
<strong>San</strong> <strong>Marcos</strong> <strong>River</strong> <strong>Watershed</strong><br />
Drainage Area: 522 square miles<br />
Streams and <strong>River</strong>s: Lower <strong>San</strong> <strong>Marcos</strong> <strong>River</strong>,<br />
Upper <strong>San</strong> <strong>Marcos</strong> <strong>River</strong>, Sink Creek, York Creek<br />
Aquifers:Edwards-Balcones Fault Zone, Carrizo-Wilcox<br />
<strong>River</strong> Segments: 1814, 1808<br />
Cities: <strong>San</strong> <strong>Marcos</strong>, Maxwell, Martindale, Fentress,<br />
Prairie Lea, Luling, Ottine, Gonzales<br />
Counties: Hays, <strong>Guadalupe</strong>, Caldwell, Gonzales<br />
EcoRegion: Edwards Plateau, Post Oak Savannah, Texas<br />
Blackland Prairies<br />
Vegetation Cover:<br />
Pasture/Hay- 27.0% Evergreen Forest - 12.8%<br />
Grass/Herbaceous - 16.3% Shrublands - 12.2%<br />
Deciduous Forest - 19.0% Row Crops - 8.6%<br />
Climate:<br />
Average annual rainfall: 33 inches<br />
Average annual temperature: January 40° July 96°<br />
Land Uses: Urban, Industry, Agricultural Crops (corn,<br />
sorghum, hay, cotton, wheat, pecans), Cattle & Hog<br />
Production, Poultry Production, Oil Production, and<br />
Recreation<br />
Water Body Uses: Aquatic Life Use, Contact Recreation<br />
Use, General Use, Fish Consumption Use, and<br />
Public Water Supply Use<br />
Soils: Varies from thin limestone to black, waxy,<br />
chocolate, and grey loam<br />
Permitted Wastewater Treatment Facilities:<br />
Domestic: 4, Land Application: 2, Industrial: 0<br />
- 66 - 2008 Basin Summary Report
SL0337<br />
FM0306 FM <strong>Blanco</strong> <strong>River</strong><br />
HWY 123 B<br />
BS0123B<br />
HWY 123<br />
!<br />
FM 20<br />
FM1979<br />
FM FM3353<br />
!<br />
FM2623<br />
FM1117<br />
US UA0090 90A<br />
SH 142<br />
US 183<br />
US 183<br />
!<br />
FM3158<br />
FM1386<br />
FM 713<br />
!<br />
SH SH0304 304<br />
RM2722<br />
FM1863<br />
Legend<br />
FM2673<br />
FM0482<br />
1813<br />
FM 306<br />
COMAL<br />
BS0046C<br />
FM0078<br />
IH0010<br />
RM0032<br />
York Creek<br />
SINK SINK CREEK<br />
SAN MARCOS<br />
SAN MARCOS<br />
12672-G<br />
12672<br />
"<br />
12628-T<br />
"<br />
Water Water Hole Hole Creek Creek<br />
Caney Creek<br />
Mesquite Creek<br />
<br />
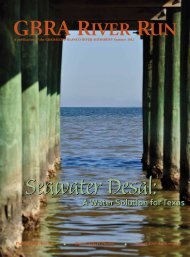
1814, the upper <strong>San</strong> <strong>Marcos</strong> <strong>River</strong><br />
<strong>Marcos</strong> and <strong>Blanco</strong> <strong>River</strong>s, just outside the city of <strong>San</strong> <strong>Marcos</strong>, to the headwaters of<br />
the river in and around Spring Lake within the city. The segment is 4.5 miles long<br />
and is separated into four assessment units: the lower 1.5 miles; from that point to<br />
IH 35; from IH 35 to Spring Lake; and, the remaining portion of the segment to the<br />
headwaters. The lower <strong>San</strong> <strong>Marcos</strong>, segment 1808, is described in the following<br />
section. GBRA has been monitoring the <strong>San</strong> <strong>Marcos</strong> <strong>River</strong> at IH 35 (site no. 12672)<br />
quarterly since 1998. The GBRA site is located in the upper half of the segment,<br />
above the discharge of the city’s wastewater treatment plant but below the city’s<br />
downtown and business district. TCEQ has one historical site less than one mile<br />
downstream of the GBRA site that has data from 1991 to 1997. TCEQ monitored<br />
this site two to four times per year. There are other TCEQ sites in this segment but<br />
with very limited data sets.<br />
Stakeholder Concerns<br />
FM 2325<br />
1815<br />
! Monitoring Station<br />
<strong>River</strong><br />
FM0465<br />
RM 12<br />
Segment Boundary<br />
Tributaries<br />
BI0035H<br />
FM1044<br />
<strong>Watershed</strong> Boundary<br />
City<br />
Oil Reserve<br />
RM3237<br />
3237<br />
Purgatory Creek<br />
FM0725<br />
York Creek<br />
IH 35<br />
FM0483<br />
FM FM1101 1101<br />
FM FM1102 1102<br />
FM0758<br />
SH0046<br />
FM0775<br />
RM0012<br />
12<br />
County with significant poultry activities<br />
Road<br />
County Line<br />
# Industrial WW Permit<br />
" Domestic WW Permit<br />
" Texas Land Application Permit<br />
FM FM24392439<br />
FM0464<br />
IH0035<br />
FM0725<br />
FM0467<br />
FM3407 FM 3407<br />
SH SH0123<br />
SL0082 SL 1814 1814<br />
Long Long Creek Creek<br />
FM FM1339 1339<br />
GUADALUPE<br />
FM0477<br />
1809<br />
1809<br />
1808<br />
FM1978<br />
FM 1978<br />
BI0035J<br />
SH0021<br />
21<br />
YORK YORK CREEK<br />
IH 10<br />
HAYS<br />
RM0150<br />
FM FM1984 1984<br />
FM1979<br />
FM 1979<br />
*A<br />
FM0621<br />
621<br />
FM1966 FM 1966<br />
SH SH0142<br />
FM 20 FM0020<br />
K CR<br />
CREEK<br />
SAN MARCOS<br />
SAN MARCOS<br />
ek<br />
MARTINDALE<br />
"<br />
FM FM2438<br />
FM FM1977<br />
1808<br />
FM1104<br />
Dickerson Dickerson Creek Creek<br />
Brushy Creek<br />
FM 1104<br />
RM0012<br />
MAXWELL<br />
Ca Calihan Creek Creek<br />
US 90 US0090<br />
"<br />
FM1150<br />
FM2720 FM 2720<br />
FM2001<br />
FENTRESS<br />
Saols Creek<br />
PRAIRIE<br />
LEA<br />
SAN MARCOS R<br />
Wolf Creek<br />
PR0010<br />
FM 671<br />
<strong>San</strong> <strong>Marcos</strong><br />
<strong>River</strong><br />
Highsmith Creek<br />
Highsmith Creek<br />
FM 20<br />
US0183<br />
FM0671<br />
SH0080<br />
2.5 5 0 5<br />
Miles<br />
439 439<br />
FM FM2984 2984<br />
12626-G<br />
12626<br />
Smith Smith Creek Creek<br />
SH0080<br />
80<br />
LULING<br />
"<br />
FM1185<br />
FM FM1322 1322<br />
Plum Creek<br />
FM0466<br />
The stakeholders, primarily the <strong>San</strong> <strong>Marcos</strong> <strong>River</strong> Foundation, have asked that<br />
TCEQ locate a monitoring site downstream of the city’s discharge. The closest<br />
monitoring station downstream of the discharge is at site no. 12629 (approximately<br />
0.5 miles) but only four sampling events were conducted in 1999-2000. When<br />
asked at a basin steering committee meeting, representatives of the TCEQ Region<br />
<br />
close proximity and downstream of the wastewater treatment plant. The <strong>San</strong><br />
<strong>Marcos</strong> <strong>River</strong> Foundation offered to assist in locating a landowner that could grant<br />
public access to the regional Surface Water Quality Monitoring team. TCEQ has a<br />
quarterly monitoring site that is 3 miles downstream of the city’s discharge. The 44<br />
data points span 1990 to 2007. Data from this site will be discussed in the next<br />
section on segment 1808.<br />
FM1854<br />
LOCKHART<br />
OTTINE<br />
FM 20<br />
FM FM2091<br />
FM0020<br />
PR0011<br />
11<br />
"<br />
FM0086<br />
FM1586 FM GONZALES<br />
CALDWELL<br />
Mule Creek Creek<br />
US0183<br />
183<br />
Artesia Artesia Creek Creek<br />
®<br />
!<br />
12672-G<br />
12672<br />
"<br />
!<br />
12628-T<br />
IH0035<br />
FM3407 FM 3407<br />
SH SH0123<br />
"<br />
Canoe Canoe Creek Creek<br />
1808 1808<br />
16578-G<br />
FM FM2091 2091<br />
SL0082 SL IH 10<br />
Dry Dry Fork Fork<br />
1814<br />
FM0794 FM BU0183V<br />
US0090<br />
Smith Smith Creek Creek<br />
1814<br />
SS SS0146<br />
FM0713<br />
GONZALES<br />
1808<br />
SH0097<br />
FM0532<br />
97878<br />
SH 21<br />
SH0021<br />
FM FM19841984<br />
FM FM19791979<br />
®<br />
Wastewater Contributions<br />
In addition to the city of <strong>San</strong> <strong>Marcos</strong>’s Wastewater Treatment Plant (WWTP),<br />
there is one other wastewater discharge to the segment. The Texas Parks and<br />
Wildlife Department’s A.E. Wood Fish Hatchery manages a concentrated aquatic<br />
animal production general permit. The General Permit (TXG130005) requires<br />
<br />
90 milligrams per liter (mg/L) monitored once per month; dissolved oxygen of 5.0<br />
mg/L monitored once per week; carbonaceous oxygen demand of 250 pounds per<br />
day maximum reported once per month and an ammonia daily maximum of 2.0<br />
mg/L. The city of <strong>San</strong> <strong>Marcos</strong> wastewater plant is permitted to discharge 9 million<br />
gallons per day. After a lengthy court battle, the <strong>San</strong> <strong>Marcos</strong> <strong>River</strong> Foundation was<br />
<br />
meet high quality standards of 5 mg/L biochemical oxygen demand, 5 mg/L total<br />
suspended solids, 2 mg/L ammonia-nitrogen and 1 mg/L total phosphorus. The<br />
wastewater plant utilizes ultraviolet light for disinfection and is allowed to discharge<br />
up to 200 organisms per 100 milliliter of fecal coliform bacteria. The wastewater<br />
<br />
on golf courses and dust control, when possible. The Gary Job Corps Center (GJCC),<br />
located along this segment, no longer discharges treated wastewater to the <strong>San</strong><br />
<strong>Marcos</strong> <strong>River</strong>. The GJCC discontinued its treatment of wastewater in 2000 and<br />
sends its raw wastewater to the <strong>San</strong> <strong>Marcos</strong> WWTP.<br />
Endangered Species<br />
The <strong>San</strong> <strong>Marcos</strong> <strong>River</strong> is home to the Texas Wild Rice and fountain darter,<br />
<br />
the conditions conducive to these unique species as well as other native and<br />
<br />
out-competed by an invasive non-native aquatic plant, cryptocoryne, also known as<br />
water trumpet. Water trumpet is a fast-growing rooted aquatic plant with no natural<br />
predators. In addition to the damage it poses to Texas Wild Rice, water trumpet is<br />
replacing the habitat that the fountain darter relies on. Removal or control of this<br />
<br />
removal techniques, that are very labor intensive, have been employed so as to not<br />
uproot or damage the wild rice. The cryptocoryne is an example of the damage<br />
that can come from introduction of non-native species, in this case, most likely<br />
introduced by people disposing of the contents of their aquariums. Other species<br />
that are associated with the improper disposal of aquarium populations include<br />
loriicarids (algae eaters), hydrilla and the giant ram’s horn snail.<br />
Water Quality<br />
<br />
located in the hills above the city and in Spring Lake. The springs discharge a<br />
<br />
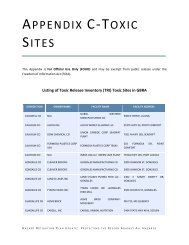
the temperature in the upper <strong>San</strong> <strong>Marcos</strong> <strong>River</strong> stable, at a median temperature<br />
of 22.8ºC, ranging from 19.2 ºC to 25.2ºC. Figure 1 shows how stable the<br />
temperature of the upper <strong>San</strong> <strong>Marcos</strong> <strong>River</strong> is. The exception is during times of<br />
- 67 - 2008 Basin Summary Report
prolonged drought as seen in 2006 where, in the data set collected by GBRA,<br />
<br />
<br />
alarming at most sites, but with the existence of the endangered species that live in<br />
<br />
<br />
29<br />
27<br />
25<br />
23<br />
21<br />
19<br />
17<br />
15<br />
Flow vs. Temperature<br />
Jul-01 Jul-02 Jul-03 Jul-04 Jul-05 Jul-06 Jul-07<br />
date<br />
temperature, oC<br />
flow, cfs<br />
Figure 1. Flow and temperature collected by GBRA at the IH 35 site on the upper <strong>San</strong> <strong>Marcos</strong> <strong>River</strong><br />
(12672).<br />
The 2008 draft Texas Water Quality Inventory has no impairments or concerns<br />
listed for Segment 1814. The water quality at the GBRA and TCEQ monitoring<br />
sites is very good. The median concentration for dissolved oxygen is 9.35 mg/L,<br />
ranging from a minimum of 7.0 mg/L to a maximum of 13.0 mg/L. At no time in<br />
the period of record did the dissolved oxygen drop below the minimum dissolved<br />
oxygen standard (4.0 mg/L). The ranged between 263<br />
and 569 micromhos per centimeter, with a median conductivity of 425 micromhos<br />
per centimeter. The median pH was 7.67, ranging from 6.9 to 8.06 standard units,<br />
never falling outside the stream standard range of 6.5 to 9 standard pH units.<br />
The median concentrations for chloride and sulfate were 19.2 and 25.3 mg/L<br />
respectively. At no time did the concentration of these dissolved constituents<br />
exceed the stream standard of 50 mg/L.<br />
Nitrate nitrogen, ammonia nitrogen and total phosphorus were analyzed at<br />
the GBRA and TCEQ locations. Over the period of record, nitrate nitrogen was<br />
reported under three storet codes, as nitrate nitrogen and in combination with<br />
nitrite nitrogen. The median concentrations for all three methods were 1.18,<br />
1.13, and 1.23 mg/L, ranging from 0.29 to 2.26 mg/L. Regardless of storet code<br />
citing, only two samples exceeded the nitrate nitrogen screening criteria of 1.95<br />
mg/L. The median ammonia nitrogen concentration, combining the GBRA and<br />
TCEQ sites, was 0.03 mg/L, ranging from 0.03 to 0.14 mg/L; never exceeding<br />
the screening concentration of 0.33 mg/L. The median total phosphorus<br />
<br />
400<br />
300<br />
200<br />
100<br />
0<br />
phosphorus was detected in a sample it did not exceed the screening concentration<br />
of 0.69 mg/L. The median chlorophyll a concentration is less than detection<br />
and there was never a measured value above the screening concentration of 14.1<br />
microgram per liter.<br />
Water and Land Uses<br />
Segment 1814 is known for its contact recreational opportunities. The clear, cool<br />
<br />
conditions for snorkeling, tubing and canoeing. The <strong>San</strong> <strong>Marcos</strong> <strong>River</strong> is home to<br />
the Texas Water Safari, one of the world’s largest canoe races. The race attracts<br />
over 150 canoeing teams each June. The stream standard for contact recreation<br />
is a geometric mean of 126 organisms per 100 milliliters, and a single sample<br />
concentration of 394 organisms per 100 milliliters. The geometric mean for E. coli<br />
at the GBRA IH 35 site is 34 organisms per 100 milliliters. In the period of record<br />
no sample collected exceeded the<br />
single sample E. coli standard of 394<br />
organisms per 100 milliliters. The<br />
TCEQ monitored their site for fecal<br />
coliform bacteria before a contact<br />
recreation standard was established<br />
for E. coli. The geometric mean for<br />
fecal coliform bacteria at the TCEQ<br />
site was 39 organisms per 100<br />
milliliter (contact recreation standard<br />
for fecal coliform is a geometric mean<br />
of 200 organisms per 100 milliliters),<br />
with only one sample exceeding<br />
the single sample standard of 400<br />
organisms per 100 milliliters.<br />
The land use in the segment<br />
consists of a highly urbanized area above the two monitoring locations and urban<br />
area to large tracts of farmland below the two monitoring sites. Many of these<br />
family farms are being sold and subdivided, so you are beginning to see more<br />
roof tops in the watershed than cows. The impervious cover created by these<br />
urbanized areas and subdivisions, i.e. streets, rooftops and parking lots, can<br />
be a source of nonpoint source pollution. Because of the impervious cover, the<br />
pollutants that might be captured and bio-degraded by soils, are instead readily<br />
washed over cement and pavement, directly into the surface water bodies. The<br />
suspended solids at the two monitoring sites ranged from 1 to 32 mg/L, with a<br />
median of 3 mg/L. The sediment at the GBRA monitoring location in this segment<br />
<br />
associated with urban environments, such as polyaromatic hydrocarbons.<br />
The historical data from the two monitoring sites was reviewed for trends,<br />
<br />
that were noted, either positive or negative, were not indicative of degrading water<br />
quality conditions.<br />
- 68 - 2008 Basin Summary Report
SL 337<br />
FM 306<br />
FM 758<br />
SH 123<br />
BS 123B<br />
"<br />
FM 1979<br />
FM 3353<br />
FM 2623<br />
BS 123B<br />
FM 1117<br />
FM 3353<br />
SH 142<br />
FM 1117<br />
FM 3158<br />
SH 304<br />
SH 304<br />
RM 2722<br />
FM 1863<br />
RM 32<br />
FM 2673<br />
COMAL<br />
Legend<br />
FM 482<br />
1813<br />
FM 78<br />
IH 10<br />
1815<br />
BS 46C<br />
Monitoring Station<br />
Stream Segment<br />
FM 465<br />
York Creek<br />
BI 35H<br />
FM 1044<br />
Segment Boundary<br />
Tributary<br />
<strong>Watershed</strong> Boundary<br />
City<br />
Oil Reserve<br />
FM 1101<br />
SINK CR<br />
FM 483<br />
" Domestic WW Permit<br />
" Texas Land Application Permit<br />
# USGS Gage<br />
SAN MARCOS<br />
FM 725<br />
Water Hole Creek<br />
FM 1102<br />
Caney Creek<br />
Mesquite Creek<br />
FM 775<br />
SH 46<br />
RM 12<br />
FM 2439<br />
FM 464<br />
<strong>Blanco</strong><br />
<strong>River</strong><br />
IH 35<br />
FM 725<br />
FM 467<br />
12672-G<br />
FM 3407<br />
SL 82<br />
#<br />
Long Creek<br />
1809<br />
SH 21<br />
12671-T<br />
"<br />
MARTINDALE<br />
12628-T<br />
FM 1339<br />
GUADALUPE<br />
FM 477<br />
FM 1978<br />
RM 150<br />
FM 621<br />
BI 35J<br />
YORK CR<br />
FM 466<br />
2672-G<br />
12671-T<br />
"<br />
MARTINDALE<br />
12628-T<br />
FM 3407<br />
HAYS<br />
RM 150<br />
FM 1984<br />
*A<br />
FM 1979<br />
SL 82<br />
Long Creek<br />
FM 1966<br />
FM 20<br />
FM 2438<br />
"<br />
#<br />
FM 1979<br />
"<br />
FM 1977<br />
FM 1339<br />
SH 80<br />
ALUPE<br />
FM 1104<br />
FM 477<br />
1809<br />
Dickerson Creek<br />
"<br />
FM 1978<br />
FM 2623<br />
Ca lihan Creek<br />
FM 621<br />
FM 2720<br />
US 90<br />
FM 1150<br />
FM 2001<br />
SH 21<br />
YORK CR<br />
SAN MARCOS R<br />
Wolf Creek<br />
Highsmith Creek<br />
FM 466<br />
FM 1984<br />
PR 10<br />
*A<br />
FM 1979<br />
US 183<br />
FM 671<br />
FM 2984<br />
Smith Creek<br />
SH 80<br />
FM 20<br />
"<br />
FM 1185<br />
"<br />
FM 2438<br />
6<br />
FM 1977<br />
LOCKHART<br />
FM 1322<br />
LULING<br />
"<br />
12626-G<br />
#<br />
"<br />
1808<br />
SH 80<br />
FM 1104<br />
Dickerson Creek<br />
FM 672<br />
"<br />
FM 1854<br />
US 183<br />
PR 11<br />
"<br />
FM 20<br />
FM 86<br />
FM 1586<br />
FM 2091<br />
GONZALES<br />
Callihan Creek<br />
US 90<br />
Mule Creek<br />
Artesia Creek<br />
"<br />
SH 142<br />
Canoe Creek<br />
1808<br />
FM 2091<br />
FM 812<br />
CALDWELL<br />
FM 1150<br />
®<br />
SAN MARCOS R<br />
Wolf Creek<br />
Highsmith Creek<br />
Dry Fork<br />
FM 794<br />
16578-G<br />
PR 10<br />
Smith Creek<br />
FM 535<br />
FM 713<br />
GONZALES<br />
SS 146<br />
US 183<br />
FM 671<br />
FM 2984<br />
Smith Creek<br />
SH 80<br />
US 90<br />
UA 90<br />
SH 97<br />
FM 532<br />
LOCKHART<br />
FM 1322<br />
LULING<br />
"<br />
12626-G<br />
#<br />
"<br />
1808<br />
US 183<br />
FM<br />
PR 11<br />
"<br />
FM 86<br />
FM 1586<br />
FM 3158<br />
FM 2091<br />
GONZALES<br />
CALDWELL<br />
Mule Creek<br />
Artesia Creek<br />
"<br />
®<br />
Canoe Creek<br />
1808<br />
FM 2091<br />
Dry Fork<br />
FM 794<br />
16578-G<br />
Smith Creek<br />
FM 71<br />
GONZA<br />
<br />
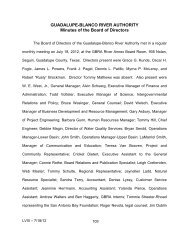
1808, the <br />
<strong>Marcos</strong> and <strong>Guadalupe</strong> <strong>River</strong>s, just outside the city of Gonzales, upstream to the<br />
<br />
The segment is 75 miles long and is separated into four assessment units: the<br />
<br />
<br />
<br />
The upper <strong>San</strong> <strong>Marcos</strong>, segment 1814, is described in the preceding section. GBRA<br />
has been monitoring the <strong>San</strong> <strong>Marcos</strong> <strong>River</strong> at Luling (site no. 12626) monthly since<br />
1987 and at the <strong>San</strong> <strong>Marcos</strong> at SH 90A (site no. 16578) quarterly since 1999. The<br />
GBRA Luling site is located in the upper half of the segment, in the third assessment<br />
unit. The GBRA 90A site is in the lowest most assessment unit, just upstream of<br />
<br />
<br />
12628). TCEQ monitors this site two to four times per year. There are other TCEQ<br />
sites in this segment but with very limited data sets. The statistical review of the<br />
data covered the three historical sites described above.<br />
Stakeholder Concerns<br />
At a <strong>Guadalupe</strong> <strong>River</strong> Basin Steering Committee meeting the stakeholders,<br />
primarily the <strong>San</strong> <strong>Marcos</strong> <strong>River</strong> Foundation, asked that TCEQ locate a monitoring site<br />
downstream of the city of <strong>San</strong> <strong>Marcos</strong>’ discharge. Representatives from the TCEQ<br />
<br />
site in close proximity and downstream of the wastewater treatment plant. The <strong>San</strong><br />
<strong>Marcos</strong> <strong>River</strong> Foundation offered to assist in locating a landowner that could grant<br />
public access to the regional Surface Water Quality Monitoring team. The TCEQ’s<br />
monitoring site in segment 1808 is 3 miles downstream of the city’s discharge.<br />
SS 146<br />
U<br />
In addition to the city of <strong>San</strong> <strong>Marcos</strong>’s Wastewater Treatment Plant (WWTP)<br />
located in the upper segment, there is one other wastewater discharge to the<br />
segment. The city of Luling’s south plant discharges to the <strong>San</strong> <strong>Marcos</strong> <strong>River</strong> and<br />
is permitted to discharge up to 500,000 gallons per day. The facility is permitted<br />
to discharge total suspended solids of 20 milligrams per liter (mg/L), 20 mg/L<br />
biochemical oxygen demand, and ammonia-nitrogen of 2.0 mg/L.<br />
<br />
loading to the stream, the <strong>Blanco</strong> <strong>River</strong> and Plum Creek. The lower segment does<br />
not have the endangered species that are found in the upper segment. The median<br />
of the uppermost station in segment 1808 was 226 cubic<br />
feet per second (cfs) which is<br />
<br />
of the <strong>San</strong> <strong>Marcos</strong> <strong>River</strong> and<br />
the <strong>Blanco</strong> <strong>River</strong> as measured<br />
at the USGS gages. There are<br />
<br />
downstream of the <strong>Blanco</strong> to<br />
Luling so the concentrations of<br />
dissolved constituents remain<br />
relatively unchanged. The<br />
median concentrations for<br />
conductivity, chloride and<br />
sulfate are 553 micromhos<br />
per centimeter, 18.5 milligrams<br />
per liter and 26 milligrams per<br />
liter respectively at the TCEQ<br />
site just downstream of the<br />
<strong>Blanco</strong> <strong>River</strong>. The GBRA Luling<br />
site had median concentrations<br />
of conductivity, chloride and sulfate of 552 micromhos per centimeter, 24.6<br />
milligrams per liter and 28.7 milligrams per liter respectively.<br />
Moving downstream, comparing the GBRA site at 90A to the GBRA Luling<br />
site, there is evidence of impacts to water quality by Plum Creek. The median<br />
<br />
<br />
<br />
contributes less than 1.5 cfs to the <strong>San</strong> <strong>Marcos</strong> <strong>River</strong>. The GBRA 90A site had<br />
median concentrations of conductivity, chloride and sulfate of 610 micromhos per<br />
centimeter, 43.4 milligrams per liter and 35.1 milligrams per liter respectively. The<br />
GBRA Luling site exceeded the stream standards for both dissolved constituents<br />
only once as well (Cl - 56.5 mg/L and SO4 - 63.8 mg/L). But, at the GBRA 90A site<br />
<br />
exceeded 20% of the time, ranging from 18.4 to 135 mg/L. The stream exceeded<br />
the standard for sulfate two times in the period of record. Plum Creek contributes<br />
nutrients and bacteria to the <strong>San</strong> <strong>Marcos</strong> <strong>River</strong> as well. A more detailed discussion<br />
of the water quality can be found in the section on Plum Creek.<br />
- 69 - 2008 Basin Summary Report
Looking at each site individually and reviewing the data for trends, the<br />
conductivity shows a positive trend over time at the uppermost site as well as the<br />
<br />
for more than one dissolved constituent that explained the slight rise over time in<br />
the conductivity at the uppermost site, the rise in conductivity at the Luling site is<br />
<br />
Figure 3. Rise in sulfate<br />
concentration over time<br />
at the <strong>San</strong> <strong>Marcos</strong> <strong>River</strong><br />
at Luling (12626).<br />
Figure 1. Rise in conductivity at the uppermost monitoring location on the lower <strong>San</strong><br />
<strong>Marcos</strong> <strong>River</strong> (12628).<br />
The 2008 draft Texas Water Quality Inventory has no impairments or concerns<br />
listed for Segment 1808. The median concentration for dissolved oxygen is 9.0<br />
mg/L, ranging from a minimum of 7.4 mg/L to a maximum of 10.8 mg/L at the<br />
<br />
the median concentration for dissolved oxygen was slightly lower at 7.99 mg/L,<br />
ranging from a minimum of 5.2 mg/L to a maximum of 21.0 mg/L. The median<br />
concentration for dissolved oxygen was 8.81 mg/L, ranging from a minimum of 5.8<br />
mg/L to a maximum of 11.7 mg/L at the GBRA 90A site. At no time in the data sets<br />
of all three monitoring locations did the dissolved oxygen drop below the minimum<br />
dissolved oxygen standard (3.0 mg/L). The median pH values at the three sites<br />
were 7.8, 7.8 and 7.99, upstream to downstream, and ranged from a low of 7.13 to<br />
a high of 9.34, falling outside the stream standard range of 6.5 to 9 standard pH<br />
units one time at the GBRA Luling site.<br />
The moderating effect of the <strong>San</strong> <strong>Marcos</strong> Springs on water temperature in the<br />
<br />
median temperature of the TCEQ site downstream of the <strong>Blanco</strong> was 23 o C, ranging<br />
from 17.6 o C to 27.7 o C. The median temperature at the GBRA Luling site was<br />
22.8 o C, ranging from 8.4 o C to 31.5 o C, and the median temperature at the GBRA<br />
90A site was 22.2 o C, ranging from 12.1 o C to 30.3 o C.<br />
Figure 2. Rise in conductivity over time at the GBRA Luling site on the <strong>San</strong> <strong>Marcos</strong> <strong>River</strong><br />
(12626).<br />
Nitrate nitrogen, ammonia nitrogen and total phosphorus, were analyzed at<br />
the GBRA and TCEQ locations. Over the period of record, nitrate nitrogen was<br />
reported under three storet codes, as nitrate nitrogen and in combination with<br />
nitrite nitrogen. At the TCEQ site in the upper part of the segment, the median<br />
concentrations for all three methods were 0.9, 1.1, and 1.28 mg/L, ranging from<br />
0.42 to 1.88 mg/L. Moving downstream to the GBRA Luling site, the median<br />
concentrations for all three methods were 0.71, 1.06, and 1.25 mg/L, ranging from<br />
0.18 to 8.51 mg/L, falling outside of the screening concentration of 1.95 mg/L<br />
three times. In the lower portion of the segment, the median concentrations for all<br />
three methods were 0.66, 1.02, and 1.03 mg/L, ranging from 0.38 to 1.83 mg/L.<br />
The median ammonia nitrogen concentration, at both GBRA sites, was 0.04 mg/L,<br />
- 70 - 2008 Basin Summary Report
anging from less than detection to 0.30 mg/L; never exceeding the screening<br />
concentration of 0.33 mg/L. The median concentration for ammonia nitrogen of<br />
0.07 mg/L at the TCEQ site was slightly higher than the downstream stations, and<br />
exceeded the screening concentration of 0.33 mg/L one time. The difference in the<br />
median concentrations may be from contributions from the wastewater treatment<br />
<br />
cause the stream to exceed the screening concentration of 0.33 mg/L more than<br />
one time. The median total phosphorus concentrations were 0.06, 0.09 and<br />
0.10 mg/L, from upstream to downstream respectively, and ranged from below<br />
<br />
<br />
TCEQ site. Again, the source of the nutrient may be coming from the wastewater<br />
discharge that is within 3 miles of the sampling site. Other possible sources of the<br />
<br />
A review of the nutrient data for trends over time at the TCEQ site show statistically<br />
<br />
<br />
TKN and total phosphorus are both nutrients that are constituents of wastewater<br />
Figure 4. Total Kjeldahl Nitrogen<br />
versus time at the <strong>San</strong> <strong>Marcos</strong><br />
<strong>River</strong> at Old Bastrop Highway<br />
<br />
available for this data set).<br />
<br />
level of wastewater treatment by the city of <strong>San</strong> <strong>Marcos</strong> plant or it could just be the<br />
result of a change in detection level for each method in 1997.<br />
<br />
the river create excellent conditions for snorkeling, tubing and canoeing. The <strong>San</strong><br />
<strong>Marcos</strong> <strong>River</strong> is home to the Texas Water Safari, one of the world’s largest canoe<br />
races. The race attracts over 150 canoeing teams each June. Additionally, it was<br />
<br />
Paddling Trail. The Luling Paddling Trail begins at the river crossing at SH 90 west<br />
of Luling and ends at the Zedler Mill in the city. The stream standard for contact<br />
recreation is a geometric mean of 126 organisms per 100 milliliters, and a single<br />
sample concentration of 394 organisms per 100 milliliters. The TCEQ monitored<br />
for fecal coliform bacteria at their site before a contact recreation standard was<br />
established for E. coli. The geometric mean for fecal coliform in the small data set<br />
was 89 organisms per 100 milliliters (contact recreation standard for fecal coliform<br />
is a geometric mean of 200 organisms per 100 milliliters), and the geometric<br />
mean for E. coli was 101 organisms per 100 milliliter after the parameter was<br />
changed. Two samples exceeded the single sample standard of 400 organisms<br />
per 100 milliliters for fecal coliforms and exceeded the single sample standard for<br />
E. coli three times. At the GBRA Luling site, the geometric mean for E. coli was 55<br />
organisms per 100 milliliters, exceeding the single sample standard 8 times. At the<br />
lower portion of the segment, the geometric mean for E. coli was 98 organisms per<br />
100 milliliters, exceeding the single sample standard four times, all of which were<br />
<br />
unusual because storm water brings in bacteria and for a period of time after the<br />
<br />
from the sun from penetrating the water and killing the bacteria.<br />
The land use in watershed that drains to the segment consists of mostly large<br />
farms and ranch land. The contributions of bacteria from agricultural activities that<br />
<br />
load in impaired streams are not seen in segment 1808 but this may be because<br />
<br />
with other areas in the basin as well as the state, these family farms are being sold<br />
and subdivided, so you will begin to see more roof tops in the watershed than cattle,<br />
and those cattle in much more concentrated areas. With urban sprawl comes more<br />
impervious cover, more runoff and more pollutant loading.<br />
Figure 5. Total Phosphorus<br />
versus time at the <strong>San</strong> <strong>Marcos</strong><br />
<strong>River</strong> at Old Bastrop Highway<br />
<br />
available for this data set).<br />
A review of the data for suspended solids<br />
trend over time, or, if there was a slight trend, it was negative, i.e. a reduction in<br />
total suspended solids, over time. Looking at the segment as a whole, the median<br />
concentration of suspended solids increases as you move downstream, beginning<br />
at 8 mg/L at the uppermost site, going to 17.2 mg/L at the GBRA Luling site and<br />
then to 31.6 mg/L at the downstream site at SH 90A.<br />
The median chlorophyll a concentration is less than detection and there was<br />
never a measured value above the screening concentration of 14.1 microgram per<br />
liter.<br />
- 71 - 2008 Basin Summary Report