A combined discreteâcontinuous model describing the lag phase of ...
A combined discreteâcontinuous model describing the lag phase of ...
A combined discreteâcontinuous model describing the lag phase of ...

Create successful ePaper yourself
Turn your PDF publications into a flip-book with our unique Google optimized e-Paper software.
176 R.C. McKellar, K. Knight / International Journal <strong>of</strong> Food Microbiology 54 (2000) 171 –180<br />
©<br />
Fig. 4. Discrete–continuous <strong>model</strong> designed with ModelMaker<br />
to simulate a complete bacterial growth curve.<br />
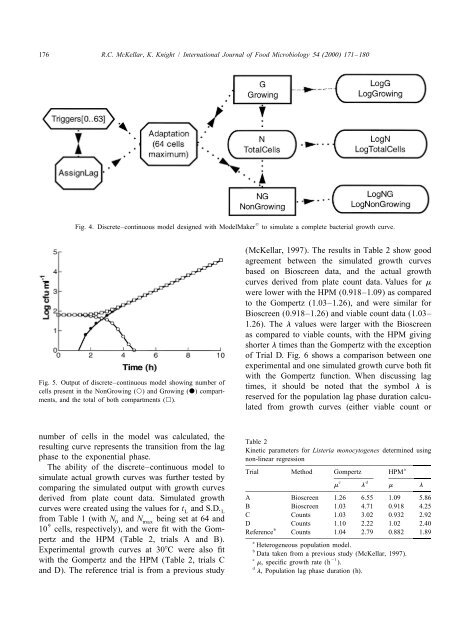
Fig. 5. Output <strong>of</strong> discrete–continuous <strong>model</strong> showing number <strong>of</strong><br />
cells present in <strong>the</strong> NonGrowing (s) and Growing (d) compartments,<br />
and <strong>the</strong> total <strong>of</strong> both compartments (h).<br />
(McKellar, 1997). The results in Table 2 show good<br />
agreement between <strong>the</strong> simulated growth curves<br />
based on Bioscreen data, and <strong>the</strong> actual growth<br />
curves derived from plate count data. Values for m<br />
were lower with <strong>the</strong> HPM (0.918–1.09) as compared<br />
to <strong>the</strong> Gompertz (1.03–1.26), and were similar for<br />
Bioscreen (0.918–1.26) and viable count data (1.03–<br />
1.26). The l values were larger with <strong>the</strong> Bioscreen<br />
as compared to viable counts, with <strong>the</strong> HPM giving<br />
shorter l times than <strong>the</strong> Gompertz with <strong>the</strong> exception<br />
<strong>of</strong> Trial D. Fig. 6 shows a comparison between one<br />
experimental and one simulated growth curve both fit<br />
with <strong>the</strong> Gompertz function. When discussing <strong>lag</strong><br />
times, it should be noted that <strong>the</strong> symbol l is<br />
reserved for <strong>the</strong> population <strong>lag</strong> <strong>phase</strong> duration calcu-<br />
lated from growth curves (ei<strong>the</strong>r viable count or<br />
number <strong>of</strong> cells in <strong>the</strong> <strong>model</strong> was calculated, <strong>the</strong><br />
Table 2<br />
resulting curve represents <strong>the</strong> transition from <strong>the</strong> <strong>lag</strong> Kinetic parameters for Listeria monocytogenes determined using<br />
<strong>phase</strong> to <strong>the</strong> exponential <strong>phase</strong>.<br />
non-linear regression<br />
The ability <strong>of</strong> <strong>the</strong> discrete–continuous <strong>model</strong> to<br />
a<br />
Trial Method Gompertz HPM<br />
simulate actual growth curves was fur<strong>the</strong>r tested by<br />
c d<br />
comparing <strong>the</strong> simulated output with growth curves<br />
m l m l<br />
derived from plate count data. Simulated growth A Bioscreen 1.26 6.55 1.09 5.86<br />
curves were created using <strong>the</strong> values for t and S.D. B Bioscreen 1.03 4.71 0.918 4.25<br />
L<br />
L<br />
C Counts 1.03 3.02 0.932 2.92<br />
from Table 1 (with N0 and Nmax being set at 64 and<br />
9<br />
D Counts 1.10 2.22 1.02 2.40<br />
10 cells, respectively), and were fit with <strong>the</strong> Gom- b<br />
Reference Counts 1.04 2.79 0.882 1.89<br />
pertz and <strong>the</strong> HPM (Table 2, trials A and B).<br />
a Heterogeneous population <strong>model</strong>.<br />
Experimental growth curves at 308C were also fit b Data taken from a previous study (McKellar, 1997).<br />
with <strong>the</strong> Gompertz and <strong>the</strong> HPM (Table 2, trials C<br />
c 21<br />
m, specific growth rate (h ).<br />
d<br />
and D). The reference trial is from a previous study l, Population <strong>lag</strong> <strong>phase</strong> duration (h).