Ensemble Pruning via Individual Contribution Ordering - Computer ...
Ensemble Pruning via Individual Contribution Ordering - Computer ...
Ensemble Pruning via Individual Contribution Ordering - Computer ...

You also want an ePaper? Increase the reach of your titles
YUMPU automatically turns print PDFs into web optimized ePapers that Google loves.
<strong>Ensemble</strong> <strong>Pruning</strong> <strong>via</strong> <strong>Individual</strong> <strong>Contribution</strong> <strong>Ordering</strong><br />
Zhenyu Lu ∗ , Xindong Wu ∗+ , Xingquan Zhu @ , Josh Bongard ∗<br />
∗ Department of <strong>Computer</strong> Science, University of Vermont, Burlington, VT 05401, USA<br />
+ School of <strong>Computer</strong> Science and Information Engineering, Hefei University of Technology, Hefei 230009, China<br />
@ QCIS Center, Faculty of Engineering and Information Technology, University of Technology, Sydney, NSW 2007, Australia<br />
zlu@uvm.edu; xwu@cems.uvm.edu; xqzhu@it.uts.edu.au; jbongard@uvm.edu<br />
ABSTRACT<br />
An ensemble is a set of learned models that make decisions collectively.<br />
Although an ensemble is usually more accurate than a single<br />
learner, existing ensemble methods often tend to construct unnecessarily<br />
large ensembles, which increases the memory consumption<br />
and computational cost. <strong>Ensemble</strong> pruning tackles this problem by<br />
selecting a subset of ensemble members to form subensembles that<br />
are subject to less resource consumption and response time with<br />
accuracy that is similar to or better than the original ensemble. In<br />
this paper, we analyze the accuracy/diversity trade-off and prove<br />
that classifiers that are more accurate and make more predictions in<br />
the minority group are more important for subensemble construction.<br />
Based on the gained insights, a heuristic metric that considers<br />
both accuracy and diversity is proposed to explicitly evaluate each<br />
individual classifier’s contribution to the whole ensemble. By incorporating<br />
ensemble members in decreasing order of their contributions,<br />
subensembles are formed such that users can select the top<br />
p percent of ensemble members, depending on their resource availability<br />
and tolerable waiting time, for predictions. Experimental<br />
results on 26 UCI data sets show that subensembles formed by the<br />
proposed EPIC (<strong>Ensemble</strong> <strong>Pruning</strong> <strong>via</strong> <strong>Individual</strong> <strong>Contribution</strong> ordering)<br />
algorithm outperform the original ensemble and a state-ofthe-art<br />
ensemble pruning method, Orientation <strong>Ordering</strong> (OO) [16].<br />
Categories and Subject Descriptors<br />
H.2.8 [Database applications]: Database Applications - Data Mining<br />
General Terms<br />
Algorithms<br />
Keywords<br />
ensemble learning, ensemble pruning<br />
1. INTRODUCTION<br />
The construction of classifier ensembles is an active research<br />
field in machine learning and data mining communities [3]. Rather<br />
Permission to make digital or hard copies of all or part of this work for<br />
personal or classroom use is granted without fee provided that copies are<br />
not made or distributed for profit or commercial advantage and that copies<br />
bear this notice and the full citation on the first page. To copy otherwise, to<br />
republish, to post on servers or to redistribute to lists, requires prior specific<br />
permission and/or a fee.<br />
KDD’10, July 25–28, 2010, Washington, DC, USA.<br />
Copyright 2010 ACM 978-1-4503-0055-110/07 ...$10.00.<br />
than relying on a single classifier, an ensemble is a set of classifiers<br />
that make decisions collectively. It is well accepted that an ensemble<br />
usually generalizes better than a single classifier [22]. Dietterich<br />
stated [8] “A necessary and sufficient condition for an ensemble<br />
of classifiers to be more accurate than any of its individual<br />
members is if the classifiers are accurate and diverse.” Since the diversity<br />
of the ensemble decreases with the increase in accuracies of<br />
ensemble members, the key to the success of any ensemble learning<br />
method is the appropriate handling of the trade-off between accuracy<br />
and diversity.<br />
Many approaches have been proposed to create accurate and diverse<br />
ensembles. Examples include bagging [4], boosting [11],<br />
random forests [5], the random subspace method [12] and random<br />
decision trees [10]. In most ensemble methods, the diversity and<br />
accuracy are acquired by manipulating subsets of data points or<br />
features. One problem with these ensembling approaches is that<br />
they tend to construct unnecessarily large ensembles, which requires<br />
a large amount of memory to store the trained classifiers<br />
and decreases the response time for prediction. <strong>Ensemble</strong> pruning,<br />
or selective ensembles, is a technique that tackles this problem by<br />
choosing a subset of individual classifiers from a trained ensemble<br />
to form a subensemble for prediction. The classifiers in the<br />
subensemble need to be carefully chosen so that it is small enough<br />
to reduce the memory requirement and response time with predictive<br />
accuracy that is similar to or better than the original ensemble.<br />
Given an ensemble of size M, the problem of finding the subset<br />
of ensemble members with the optimal generalization ability<br />
involves searching the space of 2 M − 1 non-empty subensembles,<br />
which was proved to be an NP-complete problem [19]. Like other<br />
approaches in ensemble learning, the performance gain of the ensemble<br />
pruning methods stems from the balanced accuracy/diversity<br />
trade-off, where choosing only the most accurate individual classifiers<br />
to form the subensemble is theoretically unsound. As an<br />
informative example, Zhang et al. [23] has demonstrated that “an<br />
ensemble of three identical classifiers with 95% accuracy is worse<br />
than an ensemble of three classifiers with 67% accuracy and least<br />
pairwise correlated error (which is perfect!).” At the other extreme,<br />
as a strategy that only considers diversity for pruning, Kappa pruning<br />
[14] was shown to have “the poorest overall performance on the<br />
data sets investigated” of the ensemble pruning methods compared<br />
in [15].<br />
Many approaches [15] exist for selecting good subensembles to<br />
achieve the accuracy gain and reduce the computational cost, where<br />
existing efforts roughly fall into the following two categories: (1)<br />
regarding ensemble pruning as a mathematical programming and<br />
optimization problem [23][25]; and (2) reordering the original ensemble<br />
members based on some predefined criteria [16], such as the<br />
classifiers’ prediction accuracies, and selecting a subset of ensem-
le members from the sorted list. For solutions in the first category,<br />
the selected subensembles are unscalable to the users’ request on<br />
the subensemble size, whereas for solutions in the second category,<br />
they fail to effectively integrate both accuracy and diversity, which<br />
are two critical measures for ensemble pruning. Indeed, while the<br />
correlation between diversity and ensemble learning have been observed<br />
for many years [13], the emphasis has been traditionally on<br />
the characterization of the diversity and the creation of the diverse<br />
classifiers. We currently lack effective pruning principles to assess<br />
the amount of “contribution” that each ensemble member can bring<br />
to the ensemble. Existing approaches fall short in answering some<br />
fundamental questions, such as, given two ensemble members, (1)<br />
what are the differences between their impact to the ensemble (2)<br />
which one is better for ensemble learning if we have to prune out<br />
one of them and (3) what are the effective criteria if both accuracy<br />
and diversity are considered for ensemble pruning<br />
To address the above concerns, we report, in this paper, our recent<br />
work on individual contribution ordering for scalable ensemble<br />
pruning. We argue that although obtaining the optimal ensemble<br />
pruning is NP-complete, two general properties can still be<br />
observed: (1) when the accuracies of individual members of two<br />
ensembles are similar, the more diverse ensemble should perform<br />
better than the other one; and (2) when two ensembles are similarly<br />
diverse, the one with more accurate individual members should perform<br />
better. To assert that these two properties are genuinely true<br />
for ensemble construction, we limit our analysis, in the paper, to a<br />
disagreement based diversity measure [12] and two-class learning<br />
problems and carry out a theoretical study to prove the validity of<br />
the first property. Because a similar proof can also be obtained for<br />
the second property, our theoretical analysis concludes that an individual<br />
classifier makes a more important contribution to the ensemble<br />
not only when it is more accurate, but also when its predictions<br />
more often disagree with the majority vote of the ensemble.<br />
Based on this insight, a heuristic metric for evaluating contribution<br />
of each ensemble member that explicitly considers both accuracy<br />
and diversity is proposed in this paper. By reordering the<br />
ensemble members according to the proposed metric, an algorithm<br />
named <strong>Ensemble</strong> <strong>Pruning</strong> <strong>via</strong> <strong>Individual</strong> <strong>Contribution</strong> ordering (EPIC)<br />
that incorporates ensemble members with decreasing order of individual<br />
contributions into subensembles is introduced. Experimental<br />
results on 26 UCI data sets show that subensembles formed by<br />
EPIC are significantly more accurate than the original ensembles.<br />
In all experiments, bagging is chosen to be the method for constructing<br />
the original ensemble because it has been shown to be a<br />
safe and robust method [7]. To compare EPIC with peer ensemble<br />
pruning methods, Orientation <strong>Ordering</strong> (OO) [16] is chosen<br />
to be the control case, because it was shown to exhibit good performance<br />
with a low computational cost in [15]. Our experiments<br />
show that EPIC outperforms OO with a similar pruning time, which<br />
is O(Mlog(M)) for an ensemble with size M.<br />
The remainder of the paper is structured as follows. Section 2<br />
reviews related work. Section 3 carries out theoretical study on the<br />
accuracy/diversity trade-off, proposes a metric for evaluating individual<br />
contribution, and introduces the EPIC algorithm. Section 4<br />
reports the experimental settings and results, and we conclude the<br />
paper in Section 5.<br />
2. RELATED WORK<br />
<strong>Ensemble</strong> methods usually have two stages [16]: (1) training a<br />
set of accurate and diverse classifiers; and (2) combining individual<br />
classifiers, using strategies such as majority voting [4], weighted<br />
voting [11] or stacking [21], for predictions. <strong>Ensemble</strong> pruning can<br />
be viewed as a special case of the weighted voting approach, where<br />
each individual member is associated with a binary number indicating<br />
whether or not it should be included in the predicting process<br />
[23]. The major difference between ensemble pruning and other<br />
ensemble methods is that its main focus is to reduce memory and<br />
computational costs by choosing small subensembles for predictions,<br />
as well as maintaining or increasing the predictive accuracy.<br />
In 1997, Margineantu and Dietterich [14] observed that although<br />
ensemble methods can achieve better generalization accuracy than<br />
a single learner, the resulting ensembles are often unnecessarily<br />
large. Sometimes the memory for storing the ensemble members<br />
is even larger than the size of the training set. A question was then<br />
raised: are all classifiers generated essential for the ensemble’s performance<br />
Through investigation of five pruning heuristics, they<br />
concluded that the size of the ensemble can be substantially reduced<br />
without serious impact on performance, and sometimes the<br />
pruned ensemble can even outperform the original ensemble. Tamon<br />
and Xiang [19] proved the problem of pruning boosting ensembles<br />
to be NP-complete.<br />
In the work carried out by Zhou et al. [25], analysis showed<br />
that ensembling a subset of classifiers could be better than using<br />
all the classifiers. Further, a genetic algorithm (GA) based algorithm<br />
called GASEN was proposed to evolve the voting weights<br />
of individual classifiers in an ensemble of neural networks. Only<br />
the classifiers with weights above a certain threshold were chosen<br />
to form the subensembles for prediction. Experimental results of<br />
GASEN confirmed the conclusion that ensembles can be pruned to<br />
yield similar or better performance. A similar approach was used<br />
to prune ensembles of decision trees [24].<br />
Zhang et al. [23] formulated the ensemble pruning problem as<br />
a quadratic integer programming problem, which is NP-hard. By<br />
applying semi-definite programming techniques, approximate solutions<br />
can be obtained in polynomial time for this NP-hard problem.<br />
Another work [6] first obtained an extensive library of more<br />
than 2000 classifiers trained by existing methods such as C4.5 [18]<br />
with different parameters, and then ensembles were constructed by<br />
selecting classifiers using metrics such as accuracy and ROC area.<br />
The approach this paper takes belongs to a family of ensemble<br />
pruning methods based on ordered aggregation, where the original<br />
ensembles are reordered according to some criteria, and subensembles<br />
are constructed according to this order. In ensemble learning<br />
methods, the generalization error generally monotonically decreases<br />
with the increase of the ensemble size. Exceptions are<br />
when applying algorithms such as boosting to noisy data sets, the<br />
generalization error might increase because of overfitting. By reordering<br />
ensemble members, highest accuracy can be obtained for<br />
subensembles with an intermediate number of classifiers. A representative<br />
of this approach is [16], in which classifiers were reordered<br />
by increasing values of angles between the signature vectors<br />
(binary vectors that indicate each classifier’s correctness in predicting<br />
each data point) and a reference vector. The algorithm introduced<br />
here differs from this work in that EPIC explicitly considers<br />
both accuracy and diversity.<br />
In [17], Partalas et al. identified that an ensemble member’s prediction<br />
on one data point can be divided into four subsets: (1) the<br />
subset in which the individual classifier predicts correctly and is in<br />
the minority group; (2) the subset in which the individual classifier<br />
predicts correctly and is in the majority group; (3) the subset<br />
in which the individual classifier predicts incorrectly and is in the<br />
minority group; and (4) the subset in which the individual classifier<br />
predicts incorrectly and is in the majority group. The paper<br />
concluded that considering all four cases is crucial to designing ensemble<br />
diversity measures and ensemble selection techniques.<br />
Although the designing of EPIC is also based on the four cases, it
differs from [17] in two ways. Firstly, while both algorithms agree<br />
that considering the four cases is crucial, a more important question<br />
is understanding the relationship among the four cases and using it<br />
for pruning. [17] made an intuitive observation and concluded that<br />
ensemble members near to change status (correct/incorrect classification)<br />
are more important, which did not show the intrinsic relationship<br />
among the four cases. In this paper however, our theoretical<br />
analysis shows an unintuitive conclusion that ensemble members<br />
with more correct predictions in the minority contribute more<br />
for subensemble construction, and ensemble members with more<br />
incorrect predictions in the minority are less harmful for a subensemble’s<br />
predictions. Thus EPIC is different from [17] because we<br />
show for the first time a strict order of importance for the four cases.<br />
Secondly, [17] is an iterative algorithm with a polynomial pruning<br />
time, while EPIC’s pruning time is O(Mlog(M)) for an ensemble<br />
with size M.<br />
[2] is another work that considers the four cases. Like [17], [2]<br />
did not show the relationship among the four cases, and its pruning<br />
time is polynomial.<br />
Recent work [15] gives a review and comparative study of the<br />
ensemble pruning literature.<br />
3. ALGORITHM DESIGN<br />
In this section, we formally study the accuracy/diversity tradeoff<br />
and derive proper theories to quantify and characterize the importance<br />
of the individual classifier for subensemble construction.<br />
Based on the results of the analysis, a heuristic metric for evaluating<br />
a classifier’s individual contribution is proposed, through which our<br />
EPIC algorithm can order and prune ensemble members to build<br />
subensemble in an effective way.<br />
3.1 <strong>Individual</strong> <strong>Contribution</strong> Assessment<br />
In this subsection, we first introduce the notations and the diversity<br />
measures used in this paper, and then derive properties to<br />
characterize ensemble members which are important for subensemble<br />
construction. As introduced in Section 1, two observations can<br />
be made from the accuracy/diversity trade-off: 1) when members<br />
of two ensembles are similarly accurate, the more diverse ensemble<br />
should perform better than the other one; and (2) when two<br />
ensembles are similarly diverse, the one with more accurate individual<br />
members should perform better. These observations mean<br />
that for a subensemble to outperform the original ensemble, incorporating<br />
ensemble members that are accurate but different from the<br />
peer members is crucial. In this paper, individual contribution of<br />
an ensemble member is defined in the context of ensemble pruning<br />
to indicate its expected performance in a subensemble.<br />
The two observations can be transformed into another form to<br />
shed light on the evaluation of individual contributions: (1) when<br />
two individual classifiers in an ensemble are similarly accurate, the<br />
one that increases the diversity of the ensemble more should have<br />
a higher individual contribution; and (2) when two individual classifiers<br />
in an ensemble contributes similar diversity to the ensemble,<br />
the one with the higher accuracy should have a higher individual<br />
contribution. The first observation indicates how well a classifier<br />
is expected to work with other classifiers, and the second observation<br />
shows the individual property of a classifier. In our study,<br />
we formally prove the first observation and will show that similar<br />
proof can apply to the second observation. The two observations<br />
will therefore act as ensemble punning principles for the proposed<br />
EPIC algorithm.<br />
Let D = {d 1, ...., d N } be a set of N data points where d i =<br />
{(x i, y i) | i ∈ [1, N]} is a pair of input features and label that<br />
represents the ith data point, C = {c 1, ...., c M } be a set of M<br />
classifiers where c i(x j) gives the prediction of the ith classifier on<br />
the jth data point, V = {v (1) , ...., v (N) |v (i) = [v (i)<br />
1 , ..., v(i)<br />
L ], i ∈<br />
[1, N]} be a set of vectors where v (i)<br />
j is the number of predictions<br />
for the jth label of the ith data point of an ensemble combined with<br />
majority voting, and L is the number of output labels. Denote the<br />
accuracy of the ensemble as ACC en, and the accuracy of the ith<br />
classifier as ACC i.<br />
Many measures [13] exist to evaluate the diversity (or distance)<br />
of classifiers or the diversity of an ensemble. In this paper, we employ<br />
a 0/1 loss based disagreement measure, which was proposed<br />
by Ho [12], to characterize the pair-wise diversity for ensemble<br />
members. The same analysis apply for others, such as the Q statistics<br />
or κ statistics [9], based measures.<br />
Definition 1: Given two classifiers c i and c j, where N (01) denotes<br />
the number of data points incorrectly predicted by c i but correctly<br />
predicted by c j, and N (10) is the opposite of N (01) , the diversity<br />
of c i and c j, denoted by Div i,j, is the ratio between the sum of the<br />
number of data points correctly predicted by one of the classifiers<br />
only and the total number of data points, as given in Eq. (1).<br />
Div i,j = N(01) + N (10)<br />
N<br />
Definition 2: A classifier c i’s diversity contribution to an ensemble,<br />
denoted by ConDiv i, is the sum of the diversities between c i<br />
and each other classifier in the ensemble (excluding c i because according<br />
to Eq. (1 a classifier’s diversity to itself is zero), as given<br />
in Eq.(2).<br />
ConDiv i =<br />
(1)<br />
M∑<br />
Div i,j (2)<br />
j=1<br />
Lemma 1: Given a two-class classification problem, the diversity<br />
contribution of a classifier c i, defined in Eq. (2), is equal to Eq. (3)<br />
ConDiv i = 1 N<br />
N∑<br />
(M − v (i)<br />
c i (x k ) ) (3)<br />
k=1<br />
Proof: For each data point d k , denotes v (i)<br />
c i (x k )<br />
the number of classifiers<br />
that agree with c i in prediction (including itself), and (M −<br />
v (i)<br />
c i (x k )) is the number of classifiers that disagree with ci in prediction.<br />
In a two-class learning task, each disagreement is counted<br />
once when calculating the diversity contribution of c i, as defined<br />
in Eq. (2). Thus the sum of the disagreements on all data points<br />
divided by N is exactly equal to Eq.(2). <br />
Lemma 2: Given a two-class classification problem, the expected<br />
diversity contribution of a classifier c i, denoted by E(ConDiv i),<br />
is equal to Eq.(4), where N ma<br />
(i) and N ma<br />
(i) are the total number of<br />
data points that c i votes in the majority and minority groups, respectively,<br />
and AVG ma and AVG mi are the average of the number of<br />
votes in the majority and minority groups, respectively.<br />
E(ConDiv i) = (N(i) ma AVG mi + N (i)<br />
mi<br />
AVG ma)<br />
N<br />
Proof: For diversity contribution defined in Eq.(3), there are two<br />
cases for (M − v (i)<br />
c i (x k )) in total: (1) when v(i)<br />
c i (x k )<br />
> (M − v(i)<br />
c i (x k ) ),<br />
which means the majority of classifiers vote for class c i(x k ); and<br />
(2) when v (i)<br />
c i (x k )<br />
< (M − v(i)<br />
c i (x k )), which means the minority classifiers<br />
vote for class c i(x k ). Ties are not considered here because it<br />
(4)
is irrelevant to the conclusion and considering it will unnecessarily<br />
complicate the understanding of this paper. For a classifier c i which<br />
is uniformly randomly drawn from the classifier pool, the expected<br />
sum of the (M − v (i)<br />
c i (x k )) in case (1) is equal to N(i) ma AVG mi. The<br />
expected sum of the (M − v (i)<br />
c i (x k )) in case (2) equals N(i)<br />
mi<br />
AVG ma,<br />
where N (i)<br />
mi<br />
and AVG ma are the counterparts of N ma<br />
(i) and AVG mi in<br />
case (1), respectively. Thus the expected diversity contribution of<br />
c i is equal to Eq.(4). <br />
Lemma 3: For classifiers c i and c j, the difference between their<br />
expected diversity contributions is equal to Eq.(5).<br />
(N (i)<br />
ma<br />
− N ma (j) )AVG mi + (N (i)<br />
mi<br />
N<br />
− N (j)<br />
mi<br />
)AVG ma<br />
Proof: omitted due to simplicity.<br />
In short, Lemma 3 provides an effective means to compares the<br />
diversity contributions of two equally accurate ensemble members,<br />
through which we are able to quantify each ensemble member and<br />
measure their importance for subensemble construction.<br />
THEOREM 1: Given a two-class learning problem, and two classifiers<br />
c i and c j of a classifier ensemble E, if c i and c j are equally<br />
accurate, the classifier which disagrees more with other ensemble<br />
members is expected to contain more useful knowledge, in terms<br />
of diversity contribution, for constructing the classifier ensemble.<br />
Proof:An individual classifier’s prediction on the data points can<br />
be divided into four exclusive subsets: (1) the subset in which the<br />
individual classifier predicts correctly and is in the minority group;<br />
(2) the subset in which the individual classifier predicts correctly<br />
and is in the majority group; (3) the subset in which the individual<br />
classifier predicts incorrectly and is in the minority group; and (4)<br />
the subset in which the individual classifier predicts incorrectly and<br />
is in the majority group. Again, ties are not considered because of<br />
the irrelevance to the conclusion.<br />
For a two-class classification problem, these four subsets are<br />
equivalent to: (1) the subset in which the individual classifier predicts<br />
correctly and the ensemble predicts incorrectly; (2) the subset<br />
in which the individual classifier predicts correctly and the ensemble<br />
predicts correctly; (3) the subset in which the individual classifier<br />
predicts incorrectly and the ensemble predicts correctly; and<br />
(4) the subset in which the individual classifier predicts incorrectly<br />
and the ensemble predicts incorrectly.<br />
For the ith classifier,denote the fraction of data points that fall<br />
into these four sets as a i, b i, u i, and t i respectively (henceforth<br />
referred to as the a, b, u, t notation), their relations are:<br />
(5)<br />
a i + b i = ACC i (6)<br />
u i + t i = 1 − ACC i (7)<br />
where a i + b i + u i + t i = 1.<br />
Eq. (5) can be rewritten using the a, b, u, t notation as:<br />
(b i + t i − b j − t j)AVG mi + (a i + u i − a j − u j)AVG ma<br />
N<br />
because for classifier c i, N (i)<br />
ma<br />
(8)<br />
is equal to (b i +t i) and N (i)<br />
mi<br />
is equal<br />
to (a i + u i).<br />
Assume the two classifiers have the same accuracy. From Eq.<br />
(6) and (7), we know that a i +b i = a j +b j and u i +t i = u j +t j,<br />
which in another form is a i − a j = b j − b i and u i − u j = t j − t i.<br />
Eq. (8) can therefore be rewritten as:<br />
(a i + u i − a j − u j)(AVG ma − AVG mi)<br />
N<br />
(9)<br />
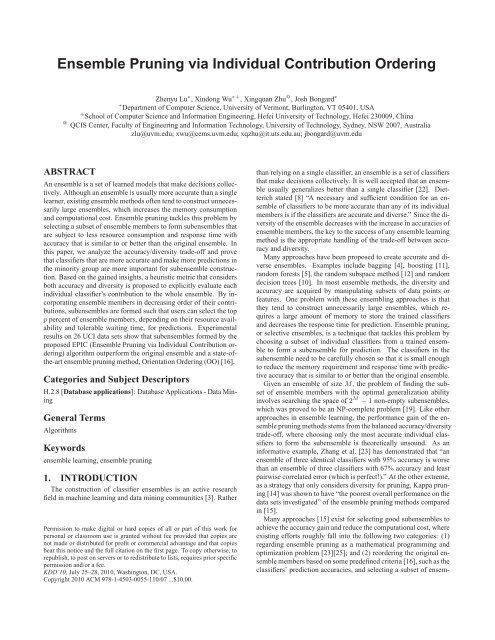
Correct and Minority<br />
Correct and Majority<br />
Incorrect and Minority<br />
Incorrect and Majority<br />
positive<br />
contribution<br />
negative<br />
contribution<br />
Figure 1: Rules for evaluating contributions of predictions<br />
Since (AVG ma−AVG mi) > 0, it is clear that if a i+u i > a j+u j,<br />
formula (9) is greater than 0, which means that if two classifiers<br />
have the same accuracy, the classifier with more votes that are in the<br />
minority group is expected to bring more diversity contribution to<br />
the ensemble. In other words, the classifier which disagrees more<br />
with other ensemble members is expected to contain more useful<br />
knowledge for constructing subensembles. <br />
Following the proof of the THEOREM 1, we can also assert that<br />
if two classifiers contribute equal diversity to the ensemble, the<br />
more accurate one is more important for constructing subensembles.<br />
The proof of the claim is omitted due to space constraints.<br />
Note that this claim is intuitive, though, because each correct prediction<br />
on a data point increases the probability of the ensemble to<br />
predict it correctly, thus making a positive contribution, and each<br />
incorrect prediction on a data point makes a negative contribution.<br />
We note that although the derivation of the THEOREM 1 is<br />
based on the two-class learning problem, it can be generalized for<br />
multi-class problems. The assumptions in this paper are made to<br />
assist the analysis so that better understanding of the problem can<br />
lead to better design of individual contribution measures. Thorough<br />
analysis is of future interest but beyond the scope of this paper.<br />
3.2 Evaluation Metric for <strong>Ensemble</strong><br />
Members<br />
The analysis in the previous section concludes following two<br />
rules for designing a heuristic metric for evaluating individual contributions<br />
of ensemble members: (1) correct predictions make positive<br />
contributions, incorrect predictions make negative contributions;<br />
and (2) correct predictions that are in the minority group<br />
make more positive contributions than correct predictions that are<br />
in the majority group, and incorrect predictions that are in the minority<br />
group make less negative contributions than incorrect predictions<br />
that are in the majority group. Fig. 1 gives an illustration<br />
of the rules.<br />
The individual contribution of a classifier c i is therefore defined<br />
as:<br />
IC i =<br />
N∑<br />
j=1<br />
IC (j)<br />
i (10)<br />
where IC (j)<br />
i is c i’s contribution on the jth data point d j.<br />
When c i(x j) equals y j, which means c i makes correct predictions<br />
on d j, if c i(x j) is in the minority group, IC (j)<br />
i is defined as:<br />
IC (j)<br />
i<br />
= 2v (j)<br />
max − v (j)<br />
c i (x j )<br />
(11)<br />
where v (j)<br />
max is the number of majority votes on d j, and v (j)<br />
c i (x j ) is
the number of predictions on c i(x j), as defined before. In this<br />
equation, (v max (j) − v (j)<br />
c i (x j )) is an estimation of the “degree of positive<br />
contribution”. For example, given an ensemble of size 100,<br />
d j and d k are two data points that have been incorrectly predicted<br />
by the whole ensemble in data set D where the number of labels L<br />
equals 3. Suppose v (j) = [35, 33, 32], v (k) = [68, 0, 32], and<br />
y j = y k = 3, therefore v max (j) = 35 and v max (k) = 68. Although v (j)<br />
3 =<br />
v (k)<br />
3 , it is harder for a subensemble to correct the wrong prediction<br />
of the ensemble for d k , because the difference between v max (k) and<br />
v (k)<br />
3 is larger than the difference between v max (j) and v (j)<br />
3 . The harder<br />
the correction is, the more valuable the predictions in the minority<br />
group are. Intuitively, the less classifiers that make the correct<br />
predictions with a classifier on d j, the more valuable a classifier<br />
is. The “degree of positive contribution”, which indicates how hard<br />
it is for a subensemble to correct the incorrect predictions of the<br />
whole ensemble, can therefore be estimated by (v (j)<br />
max − v (j)<br />
c i (x j ) ).<br />
The extra v max (j) in this equation is a normalization term that is used<br />
together with Eq. (12).<br />
When c i(x j) equals y j and c i(x j) is in the majority group (in<br />
this case v (j)<br />
c i (x j ) = v(j) max), IC (j)<br />
i is defined as:<br />
IC (j)<br />
i<br />
= v (j)<br />
sec (12)<br />
where v sec (j) is the second largest number of votes on the labels of d j.<br />
(v sec<br />
(j) − v max) (j) is an estimation of the “degree of positive contribution”<br />
in this case. Intuitively, if the majority of classifiers predicts<br />
correctly with a classifier on d j, this classifier’s contribution is not<br />
very valuable because without its prediction, the ensemble would<br />
− v (j)<br />
max)<br />
still be correct on d j (assuming no tie). Note that (v sec<br />
(j)<br />
is negative. According to our rules for designing the individual<br />
contribution measure, all correct predictions make positive contributions.<br />
Thus a term v max (j) is added to (v sec<br />
(j) − v max) (j) to normalize<br />
it to always be positive, which gives Eq. (12). And v max (j) is added<br />
to (v max (j) − v (j)<br />
c i (x j )) to maintain their relative order, which gives Eq.<br />
(11).<br />
When c i(x j) does not equal y j, IC (j)<br />
i is defined as:<br />
IC (j)<br />
i<br />
= v (j)<br />
correct − v (j)<br />
c i (x j ) − v(j) max (13)<br />
where v (j)<br />
correct is the number of votes for the correct label of d j. The<br />
two negative cases shown in Fig. 1 can be considered together.<br />
Similar to the discussion of “degree of positive contribution”, the<br />
“degree of negative contribution” is estimated by (v (j)<br />
correct −v (j)<br />
c i (x j ) ),<br />
which is the difference between the number of votes on the correct<br />
label and the number of votes on c i(x j). For example, given an<br />
ensemble of size 100, d j and d k are two data points in data set D<br />
where L = 3. Suppose v (j) = [40, 30, 30], v (k) = [40, 50, 10],<br />
y j = y k = 2, and c i(x j) = c i(x j) = 1. Therefore v (j)<br />
correct = 30<br />
and v (k)<br />
correct = 50. Although v (j)<br />
c i (x j ) = v(j) c i (x k )<br />
= 40, ci makes a<br />
more negative contribution on d j than d k because v (j)<br />
c i (x j ) > v(j) correct,<br />
thus c i makes a negative contribution that partially leads to the fact<br />
that the ensemble predicts incorrectly on d i. The “degree of negative<br />
contribution”, which indicates how much a classifier’s predictions<br />
might negatively affect a subensemble, can therefore be<br />
estimated by (v (j)<br />
correct − v (j)<br />
c i (x j )). Note that (v(j) correct − v (j)<br />
c i (x j ) ) could<br />
give a positive value, but according to our designing rules incorrect<br />
predictions should make negative contributions. So a term (−v max)<br />
(j)<br />
is added to (v (j)<br />
correct − v (j)<br />
c i (x j )) to normalize it to always be negative.<br />
Combining Eq. (11), Eq. (12), Eq. (13) with Eq. (10), the<br />
Table 1: EPIC<br />
Input: the training set D tr, the testing set D te, the pruning set<br />
D pr, an ensemble C = {c 1, ...., c M } that is trained on D tr, and<br />
the parameter p which is the desired percentage of classifiers in<br />
C that should be kept in the output subensemble.<br />
Initialize: a list of vectors V = {v (1) , ...., v (Npr) |v (i) =<br />
[v (i)<br />
1<br />
, ..., v(i)<br />
L<br />
], i ∈ [1, Npr]}, where v(i)<br />
j<br />
= 0 is initial number of predictions<br />
in label j on the ith data point in D pr, N pr is the size of<br />
D pr, L is the number of class labels, and OL is an empty list.<br />
<strong>Pruning</strong>:<br />
1. For each c i in C:<br />
for each d j in D pr:<br />
get c i(x j), which is c i’s predictions on d j;<br />
v (j)<br />
c i (x j ) = v(j) c i (x j ) + 1;<br />
2. For each c i in C:<br />
{<br />
1 if c i(x j) = y j and c i(x j) is in the minority group;<br />
α ij =<br />
0 otherwise.<br />
{<br />
1 if c i(x j) = y j and c i(x j) is in the majority group;<br />
β ij =<br />
0 otherwise.<br />
{<br />
1 if c i(x j) ≠ y j;<br />
θ ij =<br />
0 otherwise.<br />
IC i = ∑ N<br />
j=1 (αij(2v(j) max − v (j)<br />
c i (x j ) ) + βijv(j) sec<br />
+θ ij(v (j)<br />
correct − v (j)<br />
c i (x j ) − v(j) max));<br />
append pair (c i, IC i) to OL;<br />
3. Order OL in decreasing order of IC i;<br />
Output: the classifiers in the first p percent of OL is outputted<br />
as the pruned subensemble.<br />
individual contribution of the classifier c i is:<br />
N∑<br />
IC i = (α ij(2v max (j) − v (j)<br />
c i (x j ) ) + βijv(j) sec<br />
where:<br />
α ij =<br />
β ij =<br />
θ ij =<br />
j=1<br />
+θ ij(v (j)<br />
correct − v (j)<br />
c i (x j ) − v(j) max)) (14)<br />
{<br />
1 if c i(x j) = y j and c i(x j) is in the minority group;<br />
0 otherwise.<br />
{<br />
1 if c i(x j) = y j and c i(x j) is in the majority group;<br />
0 otherwise.<br />
{<br />
1 if c i(x j) ≠ y j;<br />
0 otherwise.<br />
3.3 <strong>Ensemble</strong> <strong>Pruning</strong> <strong>via</strong> <strong>Individual</strong> <strong>Contribution</strong><br />
<strong>Ordering</strong><br />
The inputs to EPIC are a training set D tr, a testing set D te, a<br />
pruning set D pr (it is called the selection set in [15]), which is an
Table 2: Characteristics of data sets used in the experiments<br />
Data sets Size #Features #Classes<br />
Anneal 898 38 6<br />
Autos 205 25 6<br />
Balance Scale 625 4 3<br />
Breast-w 699 9 2<br />
Car 1728 6 4<br />
Glass 214 9 7<br />
Heart-h 294 13 5<br />
Hypothyroid 3772 29 4<br />
Ionosphere 351 34 2<br />
Kr-vs-kp 3196 36 2<br />
Letter 20000 16 26<br />
Mfeat-factors 2000 216 10<br />
Mfeat-fourier 2000 76 10<br />
Mfeat-karhunen 2000 64 10<br />
Mfeat-pixel 2000 240 10<br />
Mfeat-zernike 2000 47 10<br />
Nursery 12960 8 5<br />
Optdigits 5620 64 10<br />
Pendigits 10992 16 10<br />
Primary tumor 339 17 22<br />
Segment 2310 19 7<br />
Soybean 683 35 19<br />
Spambase 4601 57 2<br />
Splice 3190 60 3<br />
Vehicle 846 18 4<br />
Vowel 990 12 11<br />
independent set for calculating the individual contributions of ensemble<br />
members, a predefined parameter p which is the percentage<br />
of the desired subensemble in terms of the size of the original ensemble,<br />
and an ensemble C = {c 1, ...., c M } that is trained on D tr.<br />
The pruning process starts by collecting the predictions of each<br />
ensemble on each data point in D pr. The results are recorded in<br />
V = {v (1) , ...., v (N) |v (i) = [v (i)<br />
1 , ..., v(i)<br />
L<br />
], i ∈ [1, N]}. Then the<br />
individual contribution of each classifier in C on the pruning set<br />
D pr is calculated using Eq. (14), this step takes O(MN pr) time,<br />
where N pr is the size of D pr. Then the classifiers in C are ordered<br />
by decreasing values of their contributions. The result is stored in<br />
a list OL. This step takes O(Mlog(M)) time.<br />
The output of EPIC is the first p percent of the classifiers in the<br />
ordered list OL. The running time of EPIC is O(MN pr+Mlog(M)).<br />
Since N pr is a constant for a given data set, EPIC’s time complexity<br />
is O(Mlog(M)). Table 1 gives the pseudo-code of EPIC.<br />
4. EXPERIMENTAL EVALUATION<br />
This section first introduces the settings of experiments and the<br />
characteristics of the data sets tested in this paper, and then the experimental<br />
results of the comparison between EPIC, OO and bagging<br />
are given.<br />
4.1 Experimental Settings and Data Sets<br />
26 data sets were chosen from the UCI machine learning repository<br />
[1] to evaluate the performance of EPIC. Each data set was randomly<br />
divided into three subsets with equal sizes. There are six permutations<br />
of the three subsets. Experiments on each data set consisted<br />
of six sets of sub-experiments. Each set of sub-experiments<br />
used one of the subsets as the training set, one of the subsets as<br />
the testing set, and the other one as the pruning set, corresponding<br />
to the order of one of the six permutations. And each set of subexperiments<br />
consisted of 50 independent trials. Therefore a total of<br />
300 trials of experiments were conducted on each data set. In the<br />
experiments of this paper, both EPIC and OO used the independent<br />
pruning set for pruning.<br />
A bagging ensemble was trained in each trial. The base learner<br />
was J48, which is a Java implementation of C4.5 [18] from Weka<br />
[20]. In all experiments, the ensemble size was 200. Both EPIC<br />
and OO were used to reorder the same ensemble in each trial. The<br />
predictive accuracies of the original ensemble, the EPIC-ordered<br />
ensemble and the OO-ordered ensemble were recorded. Table 2<br />
summarizes the characteristics of the data sets.<br />
4.2 Experimental Results<br />
The experimental results of the 26 tested data sets have four<br />
cases: (1) EPIC outperforms both the original ensemble and OO;<br />
(2) EPIC outperforms the original ensemble, and EPIC and OO perform<br />
comparably; (3) EPIC outperforms the original ensemble, and<br />
OO outperforms EPIC; and (4) the original ensemble outperforms<br />
both EPIC and OO. The first case contains 15 data sets, the second<br />
case contains eight data sets, the third case contains two cases, and<br />
the last case contains one data set. The results are reported both in<br />
figures and a summarizing table, where the figures show representative<br />
results from the four cases, and the table reports results for<br />
all tested data sets. The calculation method of the four cases will<br />
be introduced when describing the summarizing table.<br />
Figure 2 reports the error curves of the three compared methods<br />
for six representative data sets in the first case. Results in the figures<br />
are reported as curves of average errors with regard to the number<br />
of classifiers. The standard de<strong>via</strong>tions are not reported in the figures<br />
for reasons of clarity, but are reported in the table. Classifiers<br />
in bagging ensembles are trained on training sets that are uniformly<br />
sampled from the initial training set with replacement. As the number<br />
of aggregated classifiers increases, the errors of bagging ensembles<br />
typically monotonically decrease at a decreasing rate and reach<br />
an asymptotic error when the ensemble size is large. When aggregating<br />
classifiers according to the orders given by EPIC or OO, a<br />
typical error curve drops rapidly, reaches the minimum error in the<br />
intermediate steps of aggregation which is lower than the error of<br />
the whole original ensemble, and then increase until the error is<br />
the same as the whole ensemble. Figure 2(a) shows typical error<br />
curves of bagging, EPIC and OO in the first case, where both EPIC<br />
and OO reach accuracies that are better than the whole ensemble at<br />
intermediate ensemble sizes, and EPIC’s error curve is below the<br />
error curve of OO. The remaining five data sets, “Balance Scale”,<br />
“Mfeat-pixel”, “Primary-tumor”, “Vehicle” and “Vowel” have similar<br />
error curves to “Autos”.<br />
Figure 3 reports results for two representative data sets from the<br />
second case, where EPIC outperforms the original ensemble, and<br />
EPIC and OO perform comparably. The error curves for “Car”<br />
is reported in Figure 3(a). Although EPIC achieves a lower error<br />
curve than OO, the two algorithms have comparable performance<br />
because the difference is not statistically significant. Detailed accuracies<br />
are reported later in the summarizing table. As reported in<br />
figure 3(b), the error curves for EPIC and OO are superimposed on<br />
each other.<br />
Figure 4 reports the error curves for the two data sets in third<br />
case, where EPIC outperforms the original ensemble, and OO outperforms<br />
EPIC. Figure 4(a) shows the result for “Anneal”, in which<br />
OO achieves lower errors than EPIC when the size of the subensembles<br />
are smaller than 50. EPIC’s average errors are better than OO<br />
when the subensemble size is larger than 50. This is a negative<br />
case for EPIC because OO reaches lower errors with less classi-
0.52<br />
0.5<br />
0.48<br />
0.46<br />
bagging<br />
OO<br />
EPIC<br />
0.26<br />
0.24<br />
0.22<br />
bagging<br />
OO<br />
EPIC<br />
Error<br />
0.44<br />
0.42<br />
0.4<br />
Error<br />
0.2<br />
0.18<br />
0.38<br />
0.36<br />
0.16<br />
0.34<br />
0 20 40 60 80 100 120 140 160 180 200<br />
number of classifiers<br />
(a) “Autos”<br />
0.14<br />
0 20 40 60 80 100 120 140 160 180 200<br />
number of classifiers<br />
(b) “Balance Scale”<br />
0.32<br />
0.3<br />
0.28<br />
bagging<br />
OO<br />
EPIC<br />
0.72<br />
0.7<br />
bagging<br />
OO<br />
EPIC<br />
0.26<br />
0.68<br />
Error<br />
0.24<br />
0.22<br />
Error<br />
0.66<br />
0.2<br />
0.64<br />
0.18<br />
0.16<br />
0.62<br />
0.14<br />
0 20 40 60 80 100 120 140 160 180 200<br />
number of classifiers<br />
(c) “Mfeat-pixel”<br />
0.6<br />
0 20 40 60 80 100 120 140 160 180 200<br />
number of classifiers<br />
(d) “Primary-tumor”<br />
0.36<br />
0.35<br />
0.34<br />
bagging<br />
OO<br />
EPIC<br />
0.45<br />
0.4<br />
bagging<br />
OO<br />
EPIC<br />
0.33<br />
0.32<br />
0.35<br />
Error<br />
0.31<br />
0.3<br />
Error<br />
0.3<br />
0.29<br />
0.28<br />
0.25<br />
0.27<br />
0.26<br />
0 20 40 60 80 100 120 140 160 180 200<br />
number of classifiers<br />
(e) “Vehicle”<br />
0.2<br />
0 20 40 60 80 100 120 140 160 180 200<br />
number of classifiers<br />
(f) “Vowel”<br />
Figure 2: Comparative results for six data sets in the first case.
0.16<br />
0.15<br />
bagging<br />
OO<br />
EPIC<br />
0.08<br />
0.07<br />
bagging<br />
OO<br />
EPIC<br />
0.14<br />
0.06<br />
Error<br />
0.13<br />
Error<br />
0.05<br />
0.12<br />
0.04<br />
0.11<br />
0.03<br />
0.1<br />
0 20 40 60 80 100 120 140 160 180 200<br />
number of classifiers<br />
(a) “Car”<br />
0.02<br />
0 20 40 60 80 100 120 140 160 180 200<br />
number of classifiers<br />
(b) “Pendigits”<br />
Figure 3: Comparative results for two data sets in the second case.<br />
0.16<br />
0.15<br />
0.14<br />
bagging<br />
OO<br />
EPIC<br />
0.024<br />
0.022<br />
0.02<br />
bgging<br />
OO<br />
EPIC<br />
Error<br />
0.13<br />
0.12<br />
0.11<br />
0.1<br />
Error<br />
0.018<br />
0.016<br />
0.014<br />
0.09<br />
0.012<br />
0.08<br />
0.01<br />
0.07<br />
0 20 40 60 80 100 120 140 160 180 200<br />
number of classifiers<br />
(a) “Anneal”<br />
0.008<br />
0 20 40 60 80 100 120 140 160 180 200<br />
number of classifiers<br />
(b) “Kr-vs-kp”<br />
Figure 4: Comparative results for all data sets in the third case.<br />
fiers, which is crucial for ensemble pruning methods. Figure 4(b)<br />
reports the result for “Kr-vs-kp”, which is similar to the result for<br />
“Anneal” although the difference between EPIC and OO is smaller.<br />
Figure 5 reports the result for “Heart-h”. As is shown by the error<br />
curves, when the size of the subensembles are smaller than 100,<br />
the original bagging ensemble achieve lower errors than both EPIC<br />
and OO, and EPIC and OO achieve lower errors when the ensemble<br />
size is larger than 100. This means that both EPIC and OO fail to<br />
efficiently prune the original ensemble. Of the two pruning methods,<br />
the errors of EPIC are lower than OO when the subensemble<br />
size is smaller than 40, then OO achieves lower errors than EPIC<br />
until the ensemble size reaches 100. Above this ensemble size the<br />
two methods perform similarly.<br />
Table 3 summarizes the results for the 26 data sets. Each cell in<br />
the table reports the mean and standard de<strong>via</strong>tion of 300 trials. Experimental<br />
results in this paper empirically show that EPIC and OO<br />
generally reach minimum errors when the size of the subensembles<br />
are between 15% and 30%. [16] also reported similar observations.<br />
For this reason, in this table results of EPIC and OO are reported as<br />
the predictive accuracies of the subensembles constructed by using<br />
the first 15% and 30% of classifiers in the ordered lists. Results<br />
of bagging ensembles are reported as the predictive accuracies of<br />
the whole ensembles. Subensembles formed by EPIC with sizes<br />
of 15% of the original ensembles (henceforth referred to as “EPIC<br />
15%”) are compared with subensembles formed by OO with the<br />
same sizes (henceforth referred to as “OO 15%”) and the whole<br />
ensembles using pair-wise t-tests at the 95% significance level.<br />
Subensembles formed by EPIC with sizes of 30% of the original<br />
ensembles (henceforth referred to as “EPIC 30%”) are compared<br />
with subensembles formed by OO with the same size (henceforth<br />
referred to as “OO 30%”) and the whole ensembles. The meanings<br />
of the symbols ⊕, ⊙, and ⊖ are explained in the caption of the table.<br />
For results of bagging ensembles, the first symbol at the end<br />
shows the comparative results between “EPIC 15%” and itself, and
Table 3: Classification error percentages of bagging, EPIC and OO. ⊕ represents that EPIC outperforms the comparing method in<br />
pair-wise t-tests at 95% significance level, ⊙ represents EPIC is comparable to the comparing method, and ⊖ represents EPIC is<br />
outperformed by the comparing method.<br />
Bagging (%) EPIC + 15% (%) EPIC + 30% (%) OO + 15% (%) OO + 30% (%)<br />
Anneal 10.61±2.9⊕⊕ 8.19±1.97 7.62±2.15 7.31±2.1⊖ 7.73±2.31⊙<br />
Autos 39.94±7.25⊕⊕ 34.91±7.36 35.88±7.51 36.79±8.11⊕ 37.19±7.61⊕<br />
Balance Scale 15.75±1.52⊕⊕ 15.41±1.58 15.06±1.64 16.12±1.66⊕ 15.72±1.5⊕<br />
Breast-w 4.48±1.14⊕⊙ 4.19±0.95 4.45±0.88 4.46±0.91⊕ 4.47±0.83⊙<br />
Car 11.76±2.13⊕⊕ 10.19±1.93 10.23±1.94 10.31±1.92⊙ 10.38±1.97⊙<br />
Glass 30.71±2.99⊕⊕ 29.43±5.24 28.85±4.63 30.57±4.51⊕ 30.81±4.39⊕<br />
Heart-h 21.6±4.18⊖⊖ 22.41±3.99 22.36±3.55 23.23±3.72⊕ 21.93±3.44⊙<br />
Hypothyroid 0.66±0.23⊕⊕ 0.55±0.16 0.54±0.13 0.54±0.12⊙ 0.58±0.15⊕<br />
Ionosphere 13.22±3.09⊕⊕ 11.21±2.85 10.1±3.53 11.18±2.92⊙ 10.63±3.67⊙<br />
Kr-vs-kp 1.13±0.35⊕⊕ 0.91±0.17 0.87±0.16 0.87±0.14⊖ 0.89±0.17⊙<br />
Letter 9.51±0.55⊖⊕ 9.65±0.64 8.99±0.48 9.58±0.47⊙ 9.21±0.46⊕<br />
Mfeat-factors 7.09±0.72⊕⊕ 6.18±0.89 6.05±0.78 6.4±0.83⊕ 6.31±0.82⊕<br />
Mfeat-fourier 21.75±0.95⊕⊕ 21.04±1.3 20.88±1.2 21.63±1.26⊕ 21.45±1.11⊕<br />
Mfeat-karhunen 12.07±1.72⊕⊕ 10.52±1.63 10.28±1.59 11.0±1.5⊕ 10.87±1.5⊕<br />
Mfeat-pixel 17.78±4.31⊕⊕ 14.54±3.0 14.98±3.65 15.87±3.34⊕ 16.22±3.97⊕<br />
Mfeat-zernike 25.22±1.54⊕⊕ 24.68±1.57 24.53±1.47 25.42±1.53⊕ 25.11±1.46⊕<br />
Nursery 4.98±0.26⊕⊕ 4.52±0.32 4.62±0.29 4.52±0.33⊙ 4.6±0.3⊙<br />
Optdigits 5.0±0.49⊕⊕ 4.31±0.44 4.1±0.44 4.34±0.45⊙ 4.25±0.43⊕<br />
Pendigits 2.59±0.29⊕⊕ 2.28±0.28 2.24±0.25 2.3±0.28⊙ 2.26±0.27⊙<br />
Primary-tumor 62.74±4.88⊕⊕ 60.49±5.51 61.0±5.35 61.65±5.39⊕ 62.15±5.18⊕<br />
Segment 4.57±0.52⊕⊕ 3.71±0.56 3.9±0.57 3.8±0.56⊙ 3.91±0.57⊙<br />
Soybean 14.48±3.64⊕⊕ 11.08±2.95 11.25±2.81 11.37±3.09⊙ 11.6±3.09⊙<br />
Spambase 6.89±0.36⊕⊕ 6.45±0.31 6.48±0.28 6.47±0.3⊙ 6.5±0.27⊙<br />
Splice 7.46±0.83⊕⊕ 6.6±0.99 6.7±0.93 6.63±0.96⊙ 6.72±0.89⊙<br />
Vehicle 27.37±1.9⊕⊕ 26.64±1.7 26.5±1.74 26.88±1.59⊙ 26.85±1.8⊕<br />
Vowel 24.18±2.74⊕⊕ 21.65±2.17 21.47±2.34 23.59±2.3⊕ 23.35±2.3⊕<br />
EPIC 15% win/tie/loss 24/0/2 12/12/2<br />
EPIC 30% win/tie/loss 24/1/1 14/12/0<br />
Error<br />
0.29<br />
0.28<br />
0.27<br />
0.26<br />
0.25<br />
0.24<br />
0.23<br />
0.22<br />
0.21<br />
0 20 40 60 80 100 120 140 160 180 200<br />
number of classifiers<br />
bagging<br />
OO<br />
EPIC<br />
Figure 5: Comparative results for ‘Heart-h” in the fourth case.<br />
the second symbol shows the comparative results between “EPIC<br />
30%” and itself. The cumulative win/tie/loss results of the 26 data<br />
sets are shown in the bottom rows of the table.<br />
Data sets are divided into the four cases of results using the following<br />
rules: (1) “Heart-h” is divided into the fourth case because<br />
both EPIC and OO are outperformed by the whole ensemble; (2)<br />
each of the remaining data sets is divided into the first case if one<br />
of “EPIC 15%” and “EPIC 30%” outperforms the whole bagging<br />
ensemble and the other either outperforms or performs comparably<br />
to the whole ensemble, and one of “EPIC 15%” and “EPIC<br />
30%” outperforms its counterpart of OO, and the other either outperforms<br />
of performs comparably to the counterpart of OO; (3)<br />
each of the remaining data sets is divided into the second case if<br />
one of “EPIC 15%” and “EPIC 30%” outperforms the whole bagging<br />
ensemble and the other either outperforms or performs comparably<br />
to the whole ensemble, and both “EPIC 15%” and “EPIC<br />
30%” perform comparably to its counterpart of OO; and (4) the<br />
remaining data sets are divided into the third case. “Letter” is an<br />
exception in the first case, because “EPIC 15%” is outperformed<br />
by the whole ensemble. It is still divided into the first case “EPIC<br />
30%” outperforms the whole ensemble and OO.<br />
As is shown, EPIC outperforms bagging on 24 out of 26 data<br />
sets when using both 15% and 30% of all classifiers, which shows<br />
that EPIC efficiently performs pruning by achieving better predictive<br />
accuracies with small subensembles. EPIC is also shown to<br />
outperform OO when subensembles are formed with 15% and 30%<br />
of classifiers in the original ensemble. As introduced before, the<br />
pruning time of both EPIC and OO is Mlog(M).<br />
5. CONCLUSIONS AND FUTURE WORK<br />
In this paper, an effective ensemble pruning method termed <strong>Ensemble</strong><br />
<strong>Pruning</strong> <strong>via</strong> <strong>Individual</strong> <strong>Contribution</strong> ordering (EPIC) is introduced,<br />
which orders individual classifiers in an ensemble in terms
of their importance to subensemble construction. We argued that<br />
although obtaining the optimal ensemble pruning solution is NPcomplete,<br />
some general properties can still be derived for ensemble<br />
pruning. To achieve the goal, we limited the scope of our analysis<br />
to pair-wise diversity and two-class learning problems and have<br />
proved some general principles for ensemble pruning. Based on the<br />
derived principles, the proposed EPIC algorithm can sort ensemble<br />
members into a list, through which a subensemble with arbitrary<br />
size can be formed by selecting the top p percent of ensemble members.<br />
Experimental comparisons on 26 UCI data sets showed that<br />
EPIC outperforms both the original ensemble and a state-of-the-art<br />
ensemble pruning method, OO [16].<br />
Although the original goal of ensemble pruning methods is to<br />
reduce the memory consumption and the computational cost with<br />
minimum impact on predictive accuracy, subensembles constructed<br />
with recent pruning methods such as OO and the method introduced<br />
in this paper are consistently more accurate than whole ensembles,<br />
which suggests that it is practically unnecessary, even<br />
without the resource consumption concerns, to keep all ensemble<br />
members for predictions.<br />
In the paper, we limited our scope to specific diversity measures<br />
and two-class learning problems, and used Bagging to generate the<br />
initial pool of classifiers. But the general principles derived in the<br />
paper are valid for broad diversity measures, multi-class learning<br />
problems, and any other ensemble methods. Future work will involve<br />
testing EPIC’s performance when working with other ensemble<br />
methods, designing better individual contribution measures and<br />
automating the selection of the sizes of the subensembles.<br />
Acknowledgements<br />
This research is supported in part by the US National Science Foundation<br />
(NSF) under grants EPS-0701410 and CCF-0905337, in part<br />
by the National Natural Science Foundation of China (NSFC) under<br />
award 60828005, and in part by the National Basic Research<br />
Program of China (973 Program) under award 2009CB326203.<br />
6. REFERENCES<br />
[1] A. Asuncion and D. Newman. UCI machine learning<br />
repository, 2007.<br />
[2] R. E. Banfield, L. O. Hall, K. W. Bowyer, and W. P.<br />
Kegelmeyer. <strong>Ensemble</strong> diversity measures and their<br />
application to thinning. Information Fusion, 6(1):49–62,<br />
2005.<br />
[3] A. Bifet, G. Holmes, B. Pfahringer, R. Kirkby, and<br />
R. Gavaldá. New ensemble methods for evolving data<br />
streams. In Proceedings of the 15th ACM SIGKDD<br />
International Conference on Knowledge Discovery and Data<br />
mining, pages 139–148, 2009.<br />
[4] L. Breiman. Bagging predictors. Machine Learning,<br />
24(2):123–140, 1996.<br />
[5] L. Breiman. Random forests. Machine Learning, 45(1):5 –<br />
32, 2001.<br />
[6] R. Caruana, A. Munson, and A. Niculescu-Mizil. Getting the<br />
most out of ensemble selection. In Proceedings of the 6th<br />
International Conference on Data Mining, pages 828–833,<br />
2006.<br />
[7] R. Caruana and A. Niculescu-Mizil. An empirical<br />
comparison of supervised learning algorithms. In<br />
Proceedings of the 23rd International Conference on<br />
Machine Learning, pages 161 – 168, 2006.<br />
[8] T. G. Dietterich. <strong>Ensemble</strong> methods in machine learning. In<br />
Proceedings of the 1st International Workshop on Multiple<br />
Classifier Systems, pages 1–15, 2000.<br />
[9] T. G. Dietterich. An experimental comparison of three<br />
methods for constructing ensembles of decision trees:<br />
Bagging, boosting and randomization. Machine Learning,<br />
40:2:139–157, 2000.<br />
[10] W. Fan, H. Wang, P. S. Yu, and S. Ma. Is random model<br />
better on its accuracy and efficiency. In Proceedings of the<br />
3rd IEEE International Conference on Data Mining, pages<br />
51 – 58, 2003.<br />
[11] Y. Freund and R. E. Schapire. A decision-theoretic<br />
generalization of on-line learning and an application to<br />
boosting. Journal of <strong>Computer</strong> and System Sciences,<br />
55(1):119–139, 1997.<br />
[12] T. K. Ho. The random subspace method for constructing<br />
decision forests. IEEE Transactions on Pattern Analysis and<br />
Machine Intelligence, 20(8):832–844, 1998.<br />
[13] L. I. Kuncheva and C. J. Whitaker. Measures of diversity in<br />
classifier ensembles and their relationship with the ensemble<br />
accuracy. Machine Learning, 51(2):181 – 207, 2003.<br />
[14] D. D. Margineantu and T. G. Dietterich. <strong>Pruning</strong> adaptive<br />
boosting. In Proceedings of the 14th International<br />
Conference on Machine Learning, pages 211 – 218, 1997.<br />
[15] G. Martínez-Munoz, D. Hernández-Lobato, and A. Suárez.<br />
An analysis of ensemble pruning techniques based on<br />
ordered aggregation. IEEE Transactions on Pattern Analysis<br />
and Machine Intelligence, 31(2):245–259, 2009.<br />
[16] G. Martínez-Munoz and A. Suárez. <strong>Pruning</strong> in ordered<br />
bagging ensembles. In Proceedings of the 23rd International<br />
Conference on Machine Learning, pages 609 – 616, 2006.<br />
[17] I. Partalas, G. Tsoumakas, and I. Vlahavas. Focused<br />
ensemble selection: A diversity-based method for greedy<br />
ensemble selection. In Proceeding of the 18th European<br />
Conference on Artificial Intelligence, pages 117–121, 2008.<br />
[18] J. R. Quinlan. C4.5: programs for machine learning. Morgan<br />
Kaufmann, San Francisco, CA, USA, 1993.<br />
[19] C. Tamon and J. Xiang. On the boosting pruning problem. In<br />
Proceedings of the 11th European Conference on Machine<br />
Learning, pages 404 – 412, 2000.<br />
[20] I. H. Witten and E. Frank. Data Mining: Practical machine<br />
learning tools and techniques. Morgan Kaufmann, San<br />
Francisco, 2005.<br />
[21] D. H. Wolpert. Stacked generalization. Neural Networks,<br />
5(2):241 – 259, 1992.<br />
[22] X. Wu, V. Kumar, J. R. Quinlan, J. Ghosh, Q. Yang,<br />
H. Motoda, G. J. McLachlan, A. Ng, B. Liu, P. S. Yu, Z.-H.<br />
Zhou, M. Steinbach, D. J. Hand, and D. Steinberg. Top 10<br />
algorithms in data mining. Knowledge and Information<br />
Systems, 14(1):1–37, 2008.<br />
[23] Y. Zhang, S. Burer, and W. N. Street. <strong>Ensemble</strong> pruning <strong>via</strong><br />
semi-definite programming. The Journal of Machine<br />
Learning Research, 7:1315 – 1338, 2006.<br />
[24] Z.-H. Zhou and W. Tang. Selective ensemble of decision<br />
trees. Lecture Notes in <strong>Computer</strong> Science, 2639:476 – 483,<br />
2003.<br />
[25] Z.-H. Zhou, J. Wu, and W. Tang. Ensembling neural<br />
networks: many could be better than all. Artificial<br />
Intelligence, 137(1-2):239 – 263, 2002.