Atlas of health and climate - World Health Organization
Atlas of health and climate - World Health Organization
Atlas of health and climate - World Health Organization

You also want an ePaper? Increase the reach of your titles
YUMPU automatically turns print PDFs into web optimized ePapers that Google loves.
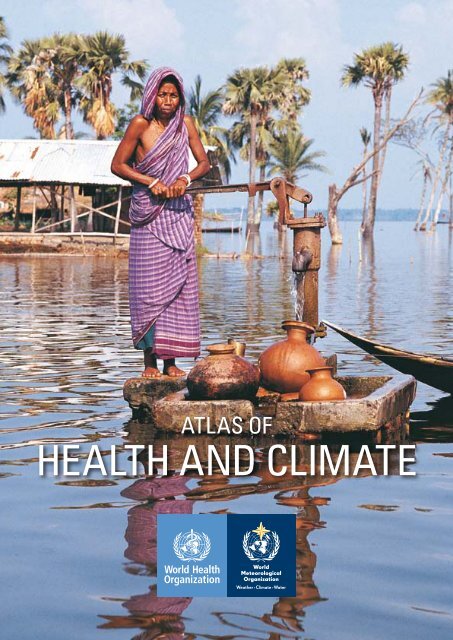
ATLAS OF<br />
HEALTH AND CLIMATE
© <strong>World</strong> <strong>Health</strong> <strong>Organization</strong> <strong>and</strong> <strong>World</strong> Meteorological <strong>Organization</strong> 2012<br />
WMO-No. 1098<br />
All rights reserved. This publication can be obtained from either the <strong>World</strong> <strong>Health</strong> <strong>Organization</strong> or the <strong>World</strong> Meteorological<br />
<strong>Organization</strong> at the following addresses:<br />
WHO Press<br />
<strong>World</strong> <strong>Health</strong> <strong>Organization</strong> (WHO), Tel.: +41 (0) 22 791 32 64<br />
20 Avenue Appia, Fax: +41 (0) 22 791 48 57<br />
1211 Geneva 27, Switzerl<strong>and</strong> E-mail: bookorders@who.int<br />
Order online: www.who.int/bookorders<br />
or: WMO Bookstore at www.wmo.int/e-catalog/index_en.php or by e-mail at publications@wmo.int.<br />
Requests for permission to reproduce or translate the publication should be addressed to WHO Press, at the above address<br />
(fax: +41 (0) 22 791 48 06; e-mail: permissions@who.int) or:<br />
Chair, Publications Board<br />
<strong>World</strong> Meteorological <strong>Organization</strong> (WMO)<br />
7 bis, avenue de la Paix Tel.: +41 (0) 22 730 84 03<br />
P.O. Box 2300 Fax: +41 (0) 22 730 80 40<br />
CH-1211 Geneva 2, Switzerl<strong>and</strong><br />
E-mail: publications@wmo.int<br />
ISBN 978 92 4 156452 6 (WHO; NLM classification: WA 30.5); 978-92-63-11098-5 (WMO)<br />
Cover illustrations: Stockbyte (front); Oli Scarff / Getty Images (back)<br />
DISCLAIMER<br />
The designations employed <strong>and</strong> the presentation <strong>of</strong> the material in this publication do not imply the expression <strong>of</strong> any opinion whatsoever on the part <strong>of</strong> the<br />
<strong>World</strong> <strong>Health</strong> <strong>Organization</strong> nor on the part <strong>of</strong> the <strong>World</strong> Meteorological <strong>Organization</strong> concerning the legal status <strong>of</strong> any country, territory, city or area or <strong>of</strong><br />
its authorities, or concerning the delimitation <strong>of</strong> its frontiers or boundaries. Dotted <strong>and</strong> dashed lines on maps represent approximate border lines for which<br />
there may not yet be full agreement. Detailed information about maps, such as on data source, map production <strong>and</strong> copyright, will be provided in endnotes at<br />
the end <strong>of</strong> the publication.<br />
The mention <strong>of</strong> specific companies or <strong>of</strong> certain manufacturers’ products does not imply that they are endorsed or recommended by the <strong>World</strong> <strong>Health</strong> <strong>Organization</strong><br />
nor the <strong>World</strong> Meteorological <strong>Organization</strong> in preference to others <strong>of</strong> a similar nature that are not mentioned. Errors <strong>and</strong> omissions excepted, the names<br />
<strong>of</strong> proprietary products are distinguished by initial capital letters.<br />
All reasonable precautions have been taken by the <strong>World</strong> <strong>Health</strong> <strong>Organization</strong> <strong>and</strong> the <strong>World</strong> Meteorological <strong>Organization</strong> to verify the information contained<br />
in this publication. However, the published material is being distributed without warranty <strong>of</strong> any kind, either expressed or implied. The responsibility for the<br />
interpretation <strong>and</strong> use <strong>of</strong> the material lies with the reader. In no event shall the <strong>World</strong> <strong>Health</strong> <strong>Organization</strong> nor the <strong>World</strong> Meteorological <strong>Organization</strong> be liable<br />
for damages arising from its use.<br />
WHO LIBRARY CATALOGUING-IN-PUBLICATION DATA<br />
<strong>Atlas</strong> <strong>of</strong> <strong>health</strong> <strong>and</strong> <strong>climate</strong>.<br />
1.Communicable diseases. 2.Emergencies. 3.Climate change. 4.Global <strong>health</strong>. 5.Environmental <strong>health</strong>. 6.Disasters. 7.<strong>Atlas</strong>es.<br />
I.<strong>World</strong> <strong>Health</strong> <strong>Organization</strong>. II.<strong>World</strong> Meteorological <strong>Organization</strong>.<br />
Printed in Switzerl<strong>and</strong>
ATLAS OF<br />
HEALTH AND CLIMATE
CONTENTS<br />
PREFACE . . . . . . . . . . . . . . . . . . . . . . . . . . . . . . . . . . . . . . . . . . . . . . . . . . . . . . . . 4<br />
SECTION 1 | INFECTIONS 7<br />
MALARIA . . . . . . . . . . . . . . . . . . . . . . . . . . . . . . . . . . . . . . . . . . . . . . 8<br />
DIARRHOEA . . . . . . . . . . . . . . . . . . . . . . . . . . . . . . . . . . . . . . . . . . . . 12<br />
MENINGITIS . . . . . . . . . . . . . . . . . . . . . . . . . . . . . . . . . . . . . . . . . . . . 16<br />
DENGUE FEVER . . . . . . . . . . . . . . . . . . . . . . . . . . . . . . . . . . . . . . . . . . 20<br />
SECTION 2 | EMERGENCIES 25<br />
FLOODS AND CYCLONES . . . . . . . . . . . . . . . . . . . . . . . . . . . . . . . . . . . . 26<br />
DROUGHT . . . . . . . . . . . . . . . . . . . . . . . . . . . . . . . . . . . . . . . . . . . . . 30<br />
AIRBORNE DISPERSION OF HAZARDOUS MATERIALS . . . . . . . . . . . . . . . . . . 34
SECTION 3 | EMERGING ENVIRONMENTAL CHALLENGES 39<br />
HEAT STRESS . . . . . . . . . . . . . . . . . . . . . . . . . . . . . . . . . . . . . . . . . . . 40<br />
UV RADIATION . . . . . . . . . . . . . . . . . . . . . . . . . . . . . . . . . . . . . . . . . . 44<br />
POLLENS . . . . . . . . . . . . . . . . . . . . . . . . . . . . . . . . . . . . . . . . . . . . . . 48<br />
AIR POLLUTION . . . . . . . . . . . . . . . . . . . . . . . . . . . . . . . . . . . . . . . . . . 52<br />
ACKNOWLEDGEMENTS . . . . . . . . . . . . . . . . . . . . . . . . . . . . . . . . . . . . . . . . . . . . . . 57<br />
NOTES AND REFERENCES . . . . . . . . . . . . . . . . . . . . . . . . . . . . . . . . . . . . . . . . . . . . 59
PREFACE<br />
ATLAS OF HEALTH AND CLIMATE: REALIZING THE POTENTIAL TO IMPROVE<br />
HEALTH OUTCOMES THROUGH THE USE OF CLIMATE SERVICES<br />
Human <strong>health</strong> is pr<strong>of</strong>oundly affected by weather <strong>and</strong><br />
<strong>climate</strong>. Extreme weather events kill tens <strong>of</strong> thous<strong>and</strong>s<br />
<strong>of</strong> people every year <strong>and</strong> undermine the physical <strong>and</strong><br />
psychological <strong>health</strong> <strong>of</strong> millions. Droughts directly affect<br />
nutrition <strong>and</strong> the incidence <strong>of</strong> diseases associated with<br />
malnutrition. Floods <strong>and</strong> cyclones can trigger outbreaks<br />
<strong>of</strong> infectious diseases <strong>and</strong> damage hospitals <strong>and</strong> other<br />
<strong>health</strong> infrastructure, overwhelming <strong>health</strong> services just<br />
when they are needed most.<br />
Climate variability also has important consequences<br />
for <strong>health</strong>. It influences diseases such as diarrhoea <strong>and</strong><br />
malaria, which kill millions annually <strong>and</strong> cause illness<br />
<strong>and</strong> suffering for hundreds <strong>of</strong> millions more. Long-term<br />
<strong>climate</strong> change threatens to exacerbate today’s problems<br />
while undermining tomorrow’s <strong>health</strong> systems,<br />
infrastructure, social protection systems, <strong>and</strong> supplies <strong>of</strong><br />
food, water, <strong>and</strong> other ecosystem products <strong>and</strong> services<br />
that are vital for human <strong>health</strong>.<br />
While the impact <strong>of</strong> <strong>climate</strong> change on <strong>health</strong> is felt<br />
globally, different countries experience these impacts<br />
to different degrees. Evidence shows that the most<br />
severe adverse effects tend to strike the poorest <strong>and</strong><br />
most vulnerable populations. In addition, the adverse<br />
<strong>health</strong> impacts <strong>of</strong> <strong>climate</strong> are worsened by rapid <strong>and</strong><br />
unplanned urbanization, the contamination <strong>of</strong> air <strong>and</strong><br />
water, <strong>and</strong> other consequences <strong>of</strong> environmentally<br />
unsustainable development.<br />
Concern about how a changing <strong>climate</strong> will affect <strong>health</strong><br />
is reflected in the UN Framework Convention on Climate<br />
Change <strong>and</strong> the Global Framework for Climate Services.<br />
Countries have also recognized the need to protect <strong>health</strong><br />
from <strong>climate</strong>-related risks through collaborative action<br />
on managing disaster risk, ensuring access to safe <strong>and</strong><br />
adequate water <strong>and</strong> food, <strong>and</strong> strengthening preparedness,<br />
surveillance <strong>and</strong> response capacities needed for<br />
managing <strong>climate</strong>-sensitive diseases.<br />
In order to achieve these goals, decision-makers at<br />
all levels need access to the most relevant <strong>and</strong> reliable<br />
information available on the diverse connections<br />
between <strong>climate</strong> <strong>and</strong> <strong>health</strong>. The <strong>World</strong> <strong>Health</strong> <strong>Organization</strong><br />
<strong>and</strong> the <strong>World</strong> Meteorological <strong>Organization</strong> are<br />
working together to meet this need through a practical<br />
<strong>and</strong> innovative approach that uses <strong>climate</strong> services<br />
to strengthen the <strong>climate</strong> resilience <strong>of</strong> <strong>health</strong> systems<br />
<strong>and</strong> support proactive decision-making. These <strong>climate</strong><br />
services will contribute to protecting public <strong>health</strong> <strong>and</strong><br />
achieving better <strong>health</strong> outcomes.<br />
The <strong>Atlas</strong> <strong>of</strong> <strong>Health</strong> <strong>and</strong> Climate is a product <strong>of</strong> this<br />
unique collaboration between the meteorological <strong>and</strong><br />
public <strong>health</strong> communities. It provides sound scientific<br />
information on the connections between weather <strong>and</strong><br />
<strong>climate</strong> <strong>and</strong> major <strong>health</strong> challenges. These range from<br />
diseases <strong>of</strong> poverty to emergencies arising from extreme<br />
weather events <strong>and</strong> disease outbreaks. They also include<br />
4
environmental degradation, the increasing prevalence<br />
<strong>of</strong> noncommunicable diseases <strong>and</strong> the universal trend<br />
<strong>of</strong> demographic ageing.<br />
The <strong>Atlas</strong> conveys three key messages. First, <strong>climate</strong><br />
affects the geographical <strong>and</strong> temporal distribution <strong>of</strong> large<br />
burdens <strong>of</strong> disease <strong>and</strong> poses important threats to <strong>health</strong><br />
security, on time scales from hours to centuries. Second,<br />
the relationship between <strong>health</strong> <strong>and</strong> <strong>climate</strong> is influenced<br />
by many other types <strong>of</strong> vulnerability, including the physiology<br />
<strong>and</strong> behaviour <strong>of</strong> individuals, the environmental<br />
<strong>and</strong> socio-economic conditions <strong>of</strong> populations, <strong>and</strong> the<br />
coverage <strong>and</strong> effectiveness <strong>of</strong> <strong>health</strong> programmes. Third,<br />
<strong>climate</strong> information is now being used to protect <strong>health</strong><br />
through risk reduction, preparedness <strong>and</strong> response over<br />
various spatial <strong>and</strong> temporal scales <strong>and</strong> in both affluent<br />
<strong>and</strong> developing countries.<br />
It is our hope that the <strong>Atlas</strong> <strong>of</strong> <strong>Health</strong> <strong>and</strong> Climate will<br />
serve as a visual “call to action” by illustrating not only<br />
the scale <strong>of</strong> challenges already confronting us – <strong>and</strong><br />
certain to grow more acute – but also by demonstrating<br />
how we can work together to apply science <strong>and</strong> evidence<br />
to lessen the adverse impacts <strong>of</strong> weather <strong>and</strong> <strong>climate</strong><br />
<strong>and</strong> to build more <strong>climate</strong>-resilient <strong>health</strong> systems <strong>and</strong><br />
communities.<br />
Margaret CHAN<br />
Michel JARRAUD<br />
Director General<br />
Secretary-General<br />
<strong>World</strong> <strong>Health</strong> <strong>Organization</strong><br />
<strong>World</strong> Meteorological <strong>Organization</strong><br />
Geneva,<br />
Geneva,<br />
October 2012 October 2012<br />
5
A patient suffering from dengue fever lies<br />
on a bed covered by a mosquito net at San Felipe<br />
hospital in Tegucigalpa, Honduras<br />
6<br />
EDGARD GARRIDO / REUTERS
SECTION 1<br />
INFECTIONS<br />
Infectious diseases take a heavy toll on populations<br />
around the world. Some <strong>of</strong> the most virulent infections<br />
are also highly sensitive to <strong>climate</strong> conditions. For<br />
example, temperature, precipitation <strong>and</strong> humidity have<br />
a strong influence on the reproduction, survival <strong>and</strong><br />
biting rates <strong>of</strong> the mosquitoes that transmit malaria<br />
<strong>and</strong> dengue fever, <strong>and</strong> temperature affects the lifecycles<br />
<strong>of</strong> the infectious agents themselves. The same<br />
meteorological factors also influence the transmission<br />
<strong>of</strong> water <strong>and</strong> food-borne diseases such as cholera, <strong>and</strong><br />
other forms <strong>of</strong> diarrhoeal disease. Hot, dry conditions<br />
favour meningococcal meningitis – a major cause <strong>of</strong><br />
disease across much <strong>of</strong> Africa. All <strong>of</strong> these diseases<br />
are major <strong>health</strong> problems. Diarrhoea kills over two<br />
million people annually, <strong>and</strong> malaria almost one million.<br />
Meningitis kills thous<strong>and</strong>s, blights lives <strong>and</strong> hampers<br />
economic development in the poorest countries. Some<br />
50 million people around the world suffer from dengue<br />
fever each year. The public <strong>health</strong> community has made<br />
important progress against all <strong>of</strong> these diseases in<br />
recent decades, but they will continue to cause death<br />
<strong>and</strong> suffering for the foreseeable future.<br />
One <strong>of</strong> the important challenges for control <strong>of</strong> all <strong>of</strong> these<br />
diseases is to underst<strong>and</strong> <strong>and</strong>, where possible, predict<br />
their distribution in time <strong>and</strong> space, to allow control<br />
programmes to target interventions <strong>and</strong> to anticipate<br />
<strong>and</strong> prevent epidemics. All <strong>of</strong> these diseases are strongly<br />
influenced by <strong>climate</strong> <strong>and</strong> weather – but these effects are<br />
mediated by other determinants. For diarrhoea, meningitis<br />
<strong>and</strong> malaria, these are closely associated with poverty<br />
<strong>and</strong> weaknesses in <strong>health</strong> programmes, which leaves<br />
populations without the protection <strong>of</strong> reliable water <strong>and</strong><br />
sanitation services, protective vaccines <strong>and</strong> life-saving<br />
drugs. In the case <strong>of</strong> dengue, unplanned urbanization,<br />
the proliferation <strong>of</strong> mosquito breeding sites in household<br />
waste, <strong>and</strong> population movement, are contributing to a<br />
re-emergence <strong>of</strong> the disease. The <strong>climate</strong> sensitivity <strong>of</strong><br />
these diseases means that there is an important role for<br />
meteorological information. The interaction with other<br />
determinants means that <strong>climate</strong> services will only reach<br />
their full potential through a true collaboration between<br />
the meteorological <strong>and</strong> <strong>health</strong> communities.<br />
By working with disease control programmes, meteorological<br />
services can help to identify where their information<br />
can be applied most effectively. Early experience<br />
shows that providing the relatively simple meteorological<br />
monitoring data that are collected by National<br />
Meteorological Services can <strong>of</strong>ten bring the greatest<br />
value to <strong>health</strong> programmes. These include short-term<br />
observations <strong>of</strong> local precipitation to provide an alert<br />
for epidemics <strong>of</strong> cholera or malaria, or gridded maps <strong>of</strong><br />
routinely collected temperature <strong>and</strong> humidity data, to<br />
generate maps <strong>of</strong> suitability for meningitis or malaria<br />
transmission, in order to improve targeting <strong>and</strong> efficiency<br />
<strong>of</strong> disease surveillance <strong>and</strong> control. Disease control<br />
programmes, meteorological services <strong>and</strong> researchers,<br />
are also beginning to work together to explore the<br />
potential <strong>of</strong> more sophisticated <strong>climate</strong> products, such<br />
as seasonal forecasts, to provide more advance warning<br />
<strong>of</strong> risks <strong>of</strong> infectious disease.<br />
While the evidence base in favour <strong>of</strong> collaboration<br />
between <strong>health</strong> <strong>and</strong> <strong>climate</strong> services continues to exp<strong>and</strong>,<br />
these techniques are not currently used to their full<br />
potential. This requires building the capacity <strong>of</strong> the<br />
meteorological services to collect information <strong>and</strong> to<br />
process it into useful products, <strong>and</strong> the capacity <strong>of</strong><br />
<strong>health</strong> services to interpret <strong>and</strong> apply these products<br />
to <strong>health</strong> challenges – <strong>and</strong> thereby increase their own<br />
dem<strong>and</strong> for <strong>climate</strong> services.<br />
7
SECTION 1 | INFECTIONS<br />
MALARIA<br />
THE BURDEN OF MALARIA<br />
Malaria is a parasitic disease spread by the bites <strong>of</strong><br />
infected Anopheles mosquitoes. There are many species<br />
<strong>of</strong> malaria parasites but, <strong>of</strong> the five affecting humans, the<br />
greatest threat to <strong>health</strong> comes from the Plasmodium<br />
vivax <strong>and</strong> Plasmodium falciparum. Malaria remains a<br />
disease <strong>of</strong> global importance despite much progress in<br />
recent years. It is a persistent threat to <strong>health</strong> in developing<br />
nations where it represents a major constraint<br />
to economic development measures <strong>and</strong> reduces the<br />
likelihood <strong>of</strong> living a <strong>health</strong>y life, especially among<br />
women, children <strong>and</strong> the rural poor.<br />
Over the last century, the surface area on which malaria<br />
remains a risk has been reduced from half to a quarter <strong>of</strong><br />
the Earth’s l<strong>and</strong>mass, but due to demographic changes<br />
the number <strong>of</strong> people exposed to malaria has increased<br />
substantially over the same period. Estimates <strong>of</strong> cases<br />
<strong>and</strong> deaths differ greatly: the number <strong>of</strong> cases st<strong>and</strong>s<br />
between 200 million <strong>and</strong> 500 million while the death<br />
estimate is around 1 million per year. According to the<br />
<strong>World</strong> Malaria Report in 2011, malaria remains prevalent<br />
in 106 countries <strong>of</strong> the tropical <strong>and</strong> semi-tropical world.<br />
Thirty-five countries in central Africa bear the highest<br />
burden <strong>of</strong> cases, more than 80 per cent, <strong>and</strong> deaths,<br />
more than 90 per cent. This is due to a number <strong>of</strong> factors:<br />
most deadly parasite species, most efficient mosquito<br />
vectors <strong>and</strong> poor rural infrastructure. 1<br />
Temperature<br />
suitability index<br />
1<br />
0<br />
Unsuitable<br />
WHO / STEPHENIE HOLLYMAN<br />
8
Temperature suitability for transmission <strong>of</strong> Plasmodium falciparum 2<br />
Proportion <strong>of</strong> child deaths<br />
from malaria<br />
0<br />
REDUCING THE INCIDENCE OF MALARIA<br />
Where malarial control is inadequate, the <strong>climate</strong> can<br />
provide valuable information about the potential distribution<br />
<strong>of</strong> the disease in both time <strong>and</strong> space. Climate<br />
variables – rainfall, humidity <strong>and</strong> temperature – are<br />
fundamental to the propagation <strong>of</strong> the mosquito vector<br />
<strong>and</strong> to parasite dynamics. Rainfall produces mosquitobreeding<br />
sites, humidity increases mosquito survival<br />
<strong>and</strong> temperature affects parasite development rates.<br />
Mapping, forecasting <strong>and</strong> monitoring these variables,<br />
<strong>and</strong> unusual conditions that may trigger epidemics such<br />
as cyclones or the breaking <strong>of</strong> a drought in a region,<br />
enable <strong>health</strong> services to better underst<strong>and</strong> the onset,<br />
intensity <strong>and</strong> length <strong>of</strong> the transmission season.<br />
WHO / STEPHENIE HOLLYMAN<br />
WHO, WMO <strong>and</strong> the Famine Early Warning Systems 4<br />
have routinely produced such information products for<br />
continental Africa for a number <strong>of</strong> years. More recent<br />
collaboration with National Meteorological Services have<br />
built capacity in seasonal forecasting 5 <strong>and</strong> enabled a<br />
much denser network <strong>of</strong> ground station data to be combined<br />
with the extensive coverage <strong>of</strong> satellite data. 6 The<br />
resulting mapping, forecasting <strong>and</strong> monitoring products<br />
are made available to <strong>health</strong> services through National<br />
Meteorological <strong>and</strong> Hydrological Services websites <strong>and</strong><br />
joint training workshops encourage mutual learning <strong>and</strong><br />
negotiation around information needs. Regional Outlook<br />
Fora 7 <strong>and</strong> National Climate <strong>and</strong> <strong>Health</strong> Working Groups 8<br />
have been established in a number <strong>of</strong> countries to elicit<br />
priorities for research, policy, practice <strong>and</strong> training.<br />
CASE STUDY: MALARIA EARLY WARNING IN SOUTHERN AFRICA<br />
The WHO’s Global Malaria Programme in the southern<br />
African countries <strong>of</strong> Angola, Botswana, Namibia,<br />
Madagascar, Mozambique, South Africa, Swazil<strong>and</strong>,<br />
Zambia <strong>and</strong> Zimbabwe <strong>of</strong>fers a good example <strong>of</strong> the<br />
practical use <strong>of</strong> weather <strong>and</strong> <strong>climate</strong> information<br />
in combating disease. The programme uses the<br />
seasonal <strong>climate</strong> forecasts issued by the Southern<br />
African Regional Climate Outlook Forum to predict<br />
malaria epidemics several months ahead <strong>of</strong> time,<br />
allowing effective control, <strong>and</strong> other preventive measures,<br />
to be put in place. The <strong>climate</strong> forecasts have<br />
been central to the development <strong>of</strong> the Malaria Early<br />
Warning System. Through programmes co-sponsored<br />
by WMO, several projects based on the “Learning<br />
through Doing” concept have been launched to help<br />
National Meteorological <strong>and</strong> Hydrological Services<br />
(NMHSs) collaborate <strong>and</strong> build partnerships with<br />
their <strong>health</strong> communities. Thus, in Botswana <strong>and</strong><br />
Madagascar, the <strong>health</strong> ministries now have longer<br />
lead times on the likely occurrence <strong>of</strong> malaria, plague<br />
<strong>and</strong> Rift Valley Fever epidemics, based on <strong>climate</strong><br />
predictions provided by the NMHSs. Similar projects<br />
have been launched in Ethiopia, Burkina Faso, Chile,<br />
Panama <strong>and</strong> Peru.<br />
10
Percent Occurrence in Historical Record<br />
0 20 40 60 80 100<br />
Climatology for<br />
~11 km x 11 km grid box<br />
centred on 36.15E, 6.35N<br />
(located within Ethiopia).<br />
Jan Apr Jul Oct Jan<br />
Month<br />
for parasite:<br />
falciparum<br />
11km 36.15E 6.35N<br />
View Climatology<br />
Percent Occurence <strong>of</strong> Climate Conditions<br />
Suitable for Malaria Transmission<br />
Percent Occurrence<br />
0 100<br />
Percent Occurrence<br />
0 100<br />
Percent Occurrence<br />
0 100<br />
Precipitation<br />
Jan Apr Jul Oct Jan<br />
Month<br />
Temperature<br />
Jan Apr Jul Oct Jan<br />
Month<br />
Relative Humidity<br />
Jan Apr Jul Oct Jan<br />
Month<br />
National Meteorological Services can supply more accurate local assessments 9<br />
Number <strong>of</strong> months suitable for malaria transmission 10<br />
11
SECTION 1 | INFECTIONS<br />
DIARRHOEA<br />
Around two million people die every year due to diarrhoeal<br />
disease – 80 per cent are children under 5. Cholera<br />
is one <strong>of</strong> the most severe forms <strong>of</strong> waterborne diarrhoeal<br />
disease. There are sporadic incidences <strong>of</strong> the disease<br />
in the developed world, but it is a major public <strong>health</strong><br />
concern for developing countries, where outbreaks occur<br />
seasonally <strong>and</strong> are associated with poverty <strong>and</strong> use<br />
<strong>of</strong> poor sanitation <strong>and</strong> unsafe water. Extreme weather<br />
events, such as hurricanes, typhoons, or earthquakes,<br />
cause a disruption in water systems resulting in the<br />
mixing <strong>of</strong> drinking <strong>and</strong> waste waters, which increase<br />
the risk <strong>of</strong> contracting cholera.<br />
In 1995 a combined average <strong>of</strong> 65 per cent <strong>of</strong> the world’s<br />
population had access to improved drinking water<br />
sources <strong>and</strong> sanitation facilities. 1 That left two billion<br />
people relying on drinking water that could potentially<br />
contain pathogens, including Vibrio cholerae, the causative<br />
organism <strong>of</strong> cholera. There is a definite correlation<br />
between disease outbreaks <strong>and</strong> inadequate access to<br />
safe water <strong>and</strong> lack <strong>of</strong> proper sanitation. Therefore<br />
people in the least developed regions <strong>of</strong> the world who<br />
only have access to unsafe water <strong>and</strong> poor sanitation<br />
also have the greatest burden <strong>of</strong> related diseases, like<br />
cholera or other diarrhoeal diseases.<br />
Extreme weather-related events such as increased<br />
precipitation <strong>and</strong> flooding further contaminate water<br />
sources, contributing to an oral-faecal contamination<br />
pathway that is difficult to manage <strong>and</strong> which increases<br />
the cases <strong>of</strong> disease <strong>and</strong> fatalities. When such events<br />
take place, Vibrio cholerae persists in aquatic ecosystems,<br />
causing the rapid spread <strong>of</strong> seasonal epidemics<br />
in many countries.<br />
WHO / DERMOT TATLOW<br />
12
% <strong>of</strong> households having access to water <strong>and</strong> sanitation<br />
0.01 - 25.00<br />
25.01 - 50.00<br />
50.01 - 75.00<br />
75.01 - 90.00<br />
90.01 - 100.00<br />
Data not available<br />
Not applicable<br />
Number <strong>of</strong> cases <strong>of</strong> cholera reported by the country<br />
0 -10<br />
11-100<br />
101-1000<br />
1001-10000<br />
10001-100000<br />
100001-1000000<br />
Precipitation departure from normal<br />
Above Normal<br />
Normal<br />
Below Normal<br />
This map demonstrates that in 1995 there was a widespread correlation between cholera prevalence <strong>and</strong><br />
poor access to water <strong>and</strong> sanitation as well as precipitation anomalies 2<br />
Ten percent <strong>of</strong> the population in least<br />
developed countries rely on surface water<br />
Open defecation is practised by nearly a quarter <strong>of</strong><br />
the population in least developed countries<br />
18%<br />
10%<br />
3%<br />
16%<br />
2%<br />
16%<br />
22%<br />
14%<br />
24%<br />
14%<br />
7%<br />
20%<br />
32%<br />
30%<br />
27%<br />
30%<br />
45%<br />
21%<br />
53%<br />
50%<br />
52%<br />
33%<br />
25%<br />
24%<br />
25%<br />
25%<br />
23%<br />
52%<br />
44%<br />
53%<br />
43%<br />
31%<br />
30%<br />
11%<br />
8%<br />
2% 3%<br />
1990 2010 1990 2010 1990 2010<br />
Total<br />
Urban<br />
Rural<br />
■ Piped on premises ■ Other improved ■ Unimproved ■ Surface water<br />
16%<br />
24%<br />
13%<br />
11%<br />
48%<br />
7%<br />
41%<br />
25%<br />
30%<br />
21%<br />
16%<br />
1990 2010 1990 2010 1990 2010<br />
Total<br />
Urban<br />
Rural<br />
■ Improved ■ Shared ■ Unimproved ■ Open defecation<br />
Left: Trends in the use <strong>of</strong> piped water on premises, improved drinking water sources, unimproved sources<br />
<strong>and</strong> surface water in least developed countries by urban <strong>and</strong> rural areas 1<br />
Right: Trends in the use <strong>of</strong> improved, unimproved <strong>and</strong> shared sanitation facilities <strong>and</strong> open defecation in<br />
least developed countries by urban <strong>and</strong> rural areas 1<br />
13
THE CLIMATE DATA LAYER<br />
In 2010, the world met the Millennium Develop Goals’<br />
target on water, as measured by its proxy indicator: “(by<br />
2015) halving the proportion <strong>of</strong> (1990) population without<br />
sustainable access to an improved source <strong>of</strong> drinking<br />
water” (see the figure below). Despite such progress<br />
nearly eight hundred million people still lacked access<br />
to water from such sources, <strong>and</strong> public <strong>health</strong> research 3<br />
has shown that billions are still using unsafe water. At<br />
the same time we are still badly <strong>of</strong>f track to meet the<br />
Millennium Develop Goal on sanitation. Access to water<br />
<strong>and</strong> sanitation improved from 1995 to 2010, but not<br />
substantially in the parts <strong>of</strong> the world where cholera is<br />
recurring. Cases <strong>of</strong> cholera continue to rise in parts <strong>of</strong><br />
poverty-stricken Africa <strong>and</strong> Asia where access to water<br />
<strong>and</strong> sanitation are already poor <strong>and</strong> progress towards<br />
improving such services is slow or stagnant.<br />
Extreme weather-related events have made disease<br />
transmission pathways worse. Thus, <strong>climate</strong> services have<br />
an important role to play if effective prevention is to be<br />
put in place. By adding a <strong>climate</strong> layer such as precipitation<br />
anomalies, including flooding, to maps containing<br />
other datasets such as disease burden, one can pinpoint<br />
hotspots where further analyses would be needed <strong>and</strong><br />
data gathering should be improved <strong>and</strong> enhanced. Such<br />
maps can help decision-makers to visualize the water,<br />
sanitation <strong>and</strong> the environmental problems in their region<br />
<strong>and</strong> to put measures in place to avoid outbreaks <strong>and</strong> thus<br />
diminish the spread <strong>of</strong> such diseases.<br />
This complex topic is part <strong>of</strong> an ongoing research.<br />
Nevertheless, these high level maps can contribute<br />
to informing policymakers on measures to reduce the<br />
disease burden <strong>of</strong> cholera.<br />
WATERAID / JUTHIKA HOWLADER<br />
CASE STUDY: GLOBAL INFORMATION MANAGEMENT SYSTEM ON<br />
HEALTH AND ENVIRONMENT<br />
The goal <strong>of</strong> the WHO project Global Information Management<br />
System on <strong>Health</strong> <strong>and</strong> Environment (GIMS) 4<br />
is to save lives by preventing communicable water<br />
borne diseases through providing an evidence base<br />
for ensuring good environmental <strong>health</strong> modalities like<br />
access to safe water <strong>and</strong> basic sanitation in a sustainable<br />
manner under changing global environmental<br />
conditions. Prevention <strong>of</strong> environment-related disease<br />
requires a comprehensive information system for<br />
adequate planning <strong>and</strong> targeted resource use for<br />
assisting the most vulnerable populations in hotspot<br />
analyses. GIMS plans to produce these maps on a<br />
real time basis <strong>and</strong> with its in-built predictive tool<br />
also aims to contribute to an early warning system<br />
for diarrhoeal diseases. In its initial phase, which will<br />
last until 2015, the project will focus on cholera <strong>and</strong><br />
be tested in selected pilot countries where cholera<br />
is present.<br />
14
% <strong>of</strong> households having access to water <strong>and</strong> sanitation<br />
0.01 - 25.00<br />
25.01 - 50.00<br />
50.01 - 75.00<br />
75.01 - 90.00<br />
90.01 - 100.00<br />
Data not available<br />
Not applicable<br />
Number <strong>of</strong> cases <strong>of</strong> cholera reported by the country<br />
0 -10<br />
11-100<br />
101-1000<br />
1001-10000<br />
10001-100000<br />
100001-1000000<br />
Precipitation departure from normal<br />
Above Normal<br />
Normal<br />
Below Normal<br />
Information on precipitation anomalies, overlaid with 2010 reported cholera cases from<br />
the countries where access to water <strong>and</strong> sanitation remains poor, indicate priority areas for<br />
further research <strong>and</strong> <strong>health</strong> intervention 2<br />
Trends in global drinking water coverage,<br />
1990–2010, projected to 2015<br />
100%<br />
90%<br />
24<br />
21<br />
17<br />
14<br />
11<br />
8<br />
80%<br />
70%<br />
60%<br />
50%<br />
40%<br />
76<br />
79<br />
83<br />
86<br />
89<br />
92<br />
30%<br />
20%<br />
10%<br />
0%<br />
1990 1995 2000 2005 2010 2015 (projected)<br />
■ Improved sources ■ Unimproved sources - - - Open defecation<br />
The MDG proxy indicator for the drinking water target, which is showing steady improvement,<br />
has been met 1<br />
15
SECTION 1 | INFECTIONS<br />
MENINGITIS<br />
MENINGITIS – THE HEALTH CHALLENGE<br />
Meningococcal meningitis is a severe infectious disease<br />
<strong>of</strong> the meninges, a thin layer around the brain <strong>and</strong> spinal<br />
cord. Several micro-organisms can cause meningitis.<br />
The bacterium with the greatest epidemic potential is<br />
Neisseria meningitidis.<br />
Although meningitis is a ubiquitous problem, most <strong>of</strong><br />
the burden <strong>of</strong> disease lies in sub-Saharan Africa in an<br />
area called the “Meningitis Belt”. The Meningitis Belt<br />
is regularly hit by epidemics that occur only during the<br />
dry season, from December to May. Over the past 10<br />
years, more than 250 000 cases <strong>and</strong> an estimated 25 000<br />
deaths have been reported. The disease is an obstacle to<br />
socio-economic development: outbreak management is<br />
extremely costly <strong>and</strong> paralyses the <strong>health</strong> system – about<br />
10 per cent <strong>of</strong> the survivors suffer life-long sequels such<br />
as deafness <strong>and</strong> blindness. A study in Burkina Faso 1 – one<br />
<strong>of</strong> the world’s poorest countries with an annual income<br />
<strong>of</strong> US$ 300 – indicated that the financial burden for the<br />
family <strong>of</strong> a patient suffering from meningitis is on average<br />
US$ 90 <strong>and</strong> up to US$ 154 more when meningitis<br />
sequels occur.<br />
There is a clear seasonal pattern <strong>of</strong> meningitis cases<br />
that corresponds to the period <strong>of</strong> the year when there<br />
are increases in dust concentrations as well as reductions<br />
in humidity levels linked to the movement <strong>of</strong> the<br />
Inter Tropical Convergence Zone. While the temporal<br />
association between <strong>climate</strong> <strong>and</strong> meningitis is evident,<br />
what triggers or ends an epidemic is as yet unknown.<br />
One hypothesis is that dry, hot <strong>and</strong> dusty air irritates<br />
the respiratory mucosa thus facilitating invasion <strong>of</strong><br />
the bacteria.<br />
Meningitis cases<br />
per week<br />
6000<br />
5000<br />
4000<br />
3000<br />
Dust<br />
(kgm/m 3 )<br />
0.8<br />
0<br />
Rain<br />
(mm)<br />
150<br />
2000<br />
1000<br />
0<br />
RH (%)<br />
80<br />
20<br />
0<br />
1<br />
11<br />
21<br />
31<br />
41<br />
51<br />
61<br />
71<br />
81<br />
91<br />
101<br />
111<br />
121<br />
131<br />
141<br />
151<br />
161<br />
171<br />
181<br />
191<br />
201<br />
211<br />
221<br />
231<br />
241<br />
251<br />
261<br />
271<br />
Week<br />
2005 2006 2007 2008 2009 2010<br />
Year<br />
Meningitis cases increase in the dry, hot <strong>and</strong> dusty season. Data from Burkina Faso (2005-2011) 2<br />
16
500<br />
200<br />
100<br />
40<br />
10<br />
5<br />
2.5<br />
1<br />
Dust surface concentration (μg/m 3 ) across the Meningitis Belt in December to February,<br />
averaged over 1979-2010 3<br />
African Meningitis Belt:<br />
Loosely defined as areas that experience<br />
frequent epidemics during the dry season 4<br />
Cases<br />
200 000<br />
180 000<br />
160 000<br />
140 000<br />
120 000<br />
100 000<br />
80 000<br />
60 000<br />
40 000<br />
20 000<br />
1970<br />
1972<br />
1974<br />
1976<br />
1978<br />
1980<br />
1982<br />
1984<br />
1986<br />
1988<br />
1990<br />
1992<br />
1994<br />
1996<br />
1998<br />
2000<br />
2002<br />
2004<br />
2006<br />
2008<br />
2010<br />
2012<br />
Years<br />
Number <strong>of</strong> suspect cases <strong>of</strong> meningitis per year in the Meningitis Belt<br />
between 1970 <strong>and</strong> 2012 5<br />
17
ADDRESSING THE MENINGITIS CHALLENGE<br />
The public <strong>health</strong> strategy to control meningitis epidemics<br />
relies on the implementation <strong>of</strong> large-scale vaccination<br />
campaigns in a timely manner to prevent further cases.<br />
Knowing if, where <strong>and</strong> when an outbreak is likely to occur<br />
would help public <strong>health</strong> decision makers prepare for<br />
vaccination campaigns <strong>and</strong> procure sufficient vaccine<br />
quantities to immunize the population at risk <strong>and</strong> ultimately<br />
reduce the impact <strong>of</strong> the disease. By increasing<br />
the underst<strong>and</strong>ing <strong>of</strong> meningitis risk factors <strong>and</strong> how<br />
they influence the occurrence <strong>of</strong> an epidemic, public<br />
<strong>health</strong> <strong>of</strong>ficials will have greater capacity to predict<br />
<strong>and</strong> prepare for potential outbreaks through reactive<br />
vaccination campaigns.<br />
A preventive vaccination strategy, involving a conjugate<br />
vaccine against Neisseria meningitidis serogroup-A,<br />
is being implemented in the highest risk countries<br />
in sub-Saharan Africa. This <strong>of</strong>fers great potential to<br />
eliminate large meningitis outbreaks as a public <strong>health</strong><br />
problem. While the introduction <strong>of</strong> the meningitis A<br />
conjugate vaccine promises to significantly reduce the<br />
problem <strong>of</strong> meningitis epidemics in Africa, the reactive<br />
vaccination approach remains an important part <strong>of</strong> the<br />
control strategy. 6<br />
Improving the prevention <strong>and</strong> control <strong>of</strong> meningitis<br />
epidemics is the focus <strong>of</strong> numerous research projects in<br />
Africa <strong>and</strong> internationally. Under a collaborative partnership<br />
initiative known as Meningitis Environmental Risk<br />
Information Technologies ‘MERIT’ constituted by WHO,<br />
WMO, the International Research Institute for Climate<br />
<strong>and</strong> Society <strong>and</strong> other leaders within the environmental<br />
<strong>and</strong> public <strong>health</strong> communities, research projects have<br />
been designed <strong>and</strong> developed to respond directly to<br />
public <strong>health</strong> questions <strong>and</strong> priorities.<br />
The combined output <strong>of</strong> operational research activities<br />
is being assessed to determine the effectiveness <strong>of</strong><br />
predictive models in strengthening the public <strong>health</strong><br />
strategy. For example, the expected probability <strong>of</strong> an<br />
epidemic occurring based on climatic <strong>and</strong> environmental<br />
factors combined with epidemiological spatio-temporal<br />
models at the district level, may in the future help public<br />
<strong>health</strong> <strong>of</strong>ficials respond to potential outbreaks. The<br />
<strong>climate</strong> service in support <strong>of</strong> the public <strong>health</strong> <strong>of</strong>ficials in<br />
meningitis-affected countries, should supply forecasts <strong>of</strong><br />
the likely duration <strong>and</strong> end <strong>of</strong> the dry season <strong>and</strong> update<br />
these with any pertinent meteorological forecasts.<br />
Log (incidence)<br />
7<br />
6<br />
5<br />
4<br />
3<br />
2<br />
1<br />
0<br />
Burkina Faso<br />
1969<br />
1971<br />
1973<br />
1975<br />
1977<br />
1979<br />
1981<br />
1983<br />
1985<br />
1987<br />
1989<br />
1991<br />
1993<br />
1995<br />
1997<br />
1999<br />
2001<br />
2003<br />
2005<br />
Time (years)<br />
Observed annual meningitis incidence (purple<br />
bars) <strong>and</strong> predictions based on meridional<br />
winds (red lines); <strong>of</strong>fering potential to inform<br />
outbreak response 7<br />
18
Niger<br />
7<br />
6<br />
Log (incidence)<br />
5<br />
4<br />
3<br />
2<br />
1<br />
0<br />
1969<br />
1971<br />
1973<br />
1975<br />
1977<br />
1979<br />
1981<br />
1983<br />
1985<br />
1987<br />
1989<br />
1991<br />
1993<br />
1995<br />
1997<br />
1999<br />
2001<br />
2003<br />
2005<br />
Time (years)<br />
Legend<br />
MVP target countries for<br />
MenAfriVac introduction<br />
Countries not covered<br />
Not applicable<br />
Target countries for the meningitis A conjugate vaccine, containing approximately<br />
450 million people at risk <strong>of</strong> meningitis 8<br />
WHO / CHRISTOPHER BLACK<br />
Cases / Cases prevented<br />
1400<br />
1200<br />
1000<br />
800<br />
600<br />
400<br />
200<br />
0<br />
Cases prevented<br />
Cases<br />
Vaccination<br />
campaign<br />
1 2 3 4 5 6 7 8 9 10 11 12 13 14 15 16 17<br />
Weeks <strong>of</strong> 1997<br />
Early vaccination prevents many cases. Data <strong>and</strong> modelling<br />
for Reo district, Burkina Faso, 1997 9<br />
19
SECTION 1 | INFECTIONS<br />
DENGUE FEVER<br />
DENGUE FEVER – THE GROWING CHALLENGE<br />
Transmitted by Aedes mosquitoes, dengue is the most<br />
rapidly spreading mosquito-borne viral disease in the<br />
world. It is estimated to cause over 50 million infections,<br />
<strong>and</strong> around 15,000 deaths every year across approximately<br />
100 countries. 1, 2<br />
Infection could range from a mild flu-like fever to the<br />
potentially fatal severe dengue, which particularly affects<br />
individuals who are exposed to one <strong>of</strong> the four different<br />
strains <strong>of</strong> the virus as a secondary infection. The<br />
impact <strong>of</strong> dengue, <strong>and</strong> other mosquito-borne viruses,<br />
goes beyond the immediate medical effects. Often<br />
occurring as epidemics, including in large cities, they<br />
can have an important impact on economic development<br />
– for example, it may affect tourism – <strong>and</strong> strain<br />
<strong>health</strong> systems, crowding hospitals.<br />
Dengue is particularly prevalent in cities in tropical <strong>and</strong><br />
subtropical areas, where the combination <strong>of</strong> abundant<br />
mosquito breeding sites <strong>and</strong> high densities <strong>of</strong> human<br />
populations support high rates <strong>of</strong> infection. Climate also<br />
exerts a strong influence, in combination with these<br />
socio-economic determinants. Heavy rainfall can cause<br />
st<strong>and</strong>ing water, while drought can encourage people<br />
to store more water around the home, both providing<br />
breeding sites for Aedes mosquitoes. Warm temperatures<br />
increase the development rates <strong>of</strong> both the mosquito<br />
vector <strong>and</strong> the virus, fuelling more intense transmission.<br />
Agreement on occurrence<br />
<strong>of</strong> transmission<br />
Complete (absence)<br />
Good<br />
Moderate<br />
Poor<br />
Intermediate<br />
Poor<br />
Moderate<br />
Good<br />
Complete (presence)<br />
Data not available<br />
Not applicable<br />
Dengue is now increasing in many parts <strong>of</strong> the world,<br />
driven by development <strong>and</strong> globalization – the combination<br />
<strong>of</strong> rapid <strong>and</strong> unplanned urbanization, movement <strong>of</strong><br />
goods <strong>and</strong> infected people, dispersal <strong>of</strong> mosquitoes to<br />
newer territories, spread <strong>and</strong> mixing <strong>of</strong> strains <strong>of</strong> the<br />
virus, <strong>and</strong> more favourable climatic conditions. 3<br />
ASIANET-PAKISTAN / SHUTTERSTOCK.COM<br />
20
Surveillance <strong>of</strong> dengue is <strong>of</strong>ten incomplete <strong>and</strong> inconsistent.<br />
The map combines information from different sources to show the degree <strong>of</strong> consensus as to<br />
whether dengue transmission occurs in each country 4<br />
Temperature<br />
<strong>and</strong> precipitation<br />
Population size<br />
<strong>and</strong> distribution<br />
Community infrastructure<br />
<strong>and</strong> behaviour<br />
Social &<br />
ecological<br />
context<br />
Aquatic<br />
breeding<br />
sites<br />
Vector<br />
ecology<br />
Vector capacity<br />
<strong>and</strong> feeding<br />
opportunities<br />
Individual virological <strong>and</strong><br />
immunological factors<br />
Epidemiology<br />
Epidemic<br />
or endemic<br />
disease<br />
Control policies<br />
<strong>and</strong> services<br />
Vector<br />
control<br />
Vector density<br />
(& fitness & longevity)<br />
Dengue disease<br />
Clinical severity<br />
Community action<br />
Dengue transmission<br />
Herd immunity<br />
Climate exerts a strong influence on dengue transmission - in interaction with<br />
many other non-<strong>climate</strong> factors 5<br />
21
USING CLIMATE SERVICES TO SUPPORT<br />
DENGUE CONTROL<br />
There is currently no effective vaccine or drugs for<br />
dengue. Control programmes rely on environmental or<br />
chemical control <strong>of</strong> the vectors, rapid case detection <strong>and</strong><br />
case management in hospitals for severe dengue. But<br />
these interventions are challenging, <strong>and</strong> there has been<br />
only very limited success in disease outbreak control<br />
within the most suitable transmission zones. Future<br />
initiatives are likely to depend not just on development<br />
<strong>of</strong> better interventions, but also on more effective targeting<br />
<strong>of</strong> control in time <strong>and</strong> space. In such scenarios,<br />
meteorological information can make an important<br />
contribution to underst<strong>and</strong>ing where <strong>and</strong> when dengue<br />
cases are likely to occur.<br />
For example, statistical models, based on correlations<br />
between <strong>climate</strong> <strong>and</strong> other environmental variables <strong>and</strong><br />
incidence <strong>of</strong> dengue in areas with good epidemiological<br />
<strong>and</strong> entomological surveillance, can be used to make<br />
predictions <strong>of</strong> the likelihood <strong>of</strong> transmission in locations<br />
where disease surveillance is weak or absent. Such<br />
information can also be used to alert authorities to<br />
the potential spread <strong>of</strong> dengue by mapping where the<br />
<strong>climate</strong> <strong>and</strong> other conditions either are, or may become,<br />
more suitable for transmission. Such information can be<br />
shared with neighbouring countries for sound planning<br />
<strong>and</strong> effective control <strong>of</strong> transmission.<br />
Dengue risk<br />
High suitability<br />
Low suitability<br />
Unsuitable/non-endemic<br />
Meteorological information – knowledge <strong>of</strong> seasonal<br />
patterns <strong>and</strong> weather forecasts – can also play a role in<br />
targeting resources in time. Combining information on<br />
precipitation <strong>and</strong> temperature, with an underst<strong>and</strong>ing <strong>of</strong><br />
non-<strong>climate</strong> factors such as availability <strong>of</strong> breeding sites<br />
<strong>and</strong> the previous exposure <strong>of</strong> populations to infection,<br />
can help to predict when <strong>and</strong> where epidemics may<br />
occur, or be particularly severe.<br />
WHO / JIM HOLMES<br />
22
Climate information can be used to improve dengue surveillance. The map shows the estimated<br />
suitability for dengue in specific locations, based on a combination <strong>of</strong> disease surveillance data, <strong>and</strong><br />
predictions based on <strong>climate</strong> <strong>and</strong> other environmental factors 6<br />
3500 1000<br />
3000<br />
900<br />
800<br />
Total rainfall (mm)<br />
2500<br />
2000<br />
1500<br />
1000<br />
700<br />
600<br />
500<br />
400<br />
300<br />
Dengue cases<br />
200<br />
500<br />
100<br />
0<br />
0<br />
1997 1998 1999 2000 2001 2002 2003 2004 2005 2006 2007 2008 2009 2010 2011<br />
Year<br />
In many locations, dengue shows a strong seasonal pattern, <strong>and</strong> underst<strong>and</strong>ing <strong>of</strong> meteorological effects<br />
may help preparedness <strong>and</strong> targeting <strong>of</strong> control efforts. The figure shows pooled monthly dengue cases<br />
(red line) <strong>and</strong> monthly rainfall (blue bars) in Siem Reap <strong>and</strong> Phnom Penh, Cambodia 7<br />
23
A girl is helped <strong>of</strong>f a truck after<br />
being evacuated from the flooded area<br />
<strong>of</strong> Thail<strong>and</strong>’s Ayutthaya province<br />
24<br />
CHAIWAT SUBPRASOM / REUTERS
SECTION 2<br />
EMERGENCIES<br />
Every year, emergencies caused by weather-, <strong>climate</strong><strong>and</strong><br />
water-related hazards impact communities<br />
around the world, leading to loss <strong>of</strong> life, destruction<br />
<strong>of</strong> social <strong>and</strong> economic infrastructure <strong>and</strong> degradation<br />
<strong>of</strong> already fragile ecosystems. Between 80 <strong>and</strong><br />
90 per cent <strong>of</strong> all documented disasters from natural<br />
hazards during the last ten years have resulted from<br />
floods, droughts, tropical cyclones, heat waves <strong>and</strong><br />
severe storms.<br />
STATISTICS AND THE HIDDEN IMPACT<br />
In 2011, 332 disasters from natural hazards were recorded<br />
in 101 countries, causing more than 30 770 deaths, <strong>and</strong><br />
affecting over 244 million people. Recorded damages<br />
amounted to more than US$ 366.1 billion. 1<br />
But statistics cannot reflect the full <strong>health</strong> impact or the<br />
depths <strong>of</strong> human suffering felt during such emergencies.<br />
Millions <strong>of</strong> people have suffered injuries, disease <strong>and</strong><br />
long-term disabilities as well as emotional anguish from<br />
the loss <strong>of</strong> loved ones <strong>and</strong> the memories <strong>of</strong> traumatic<br />
events. 2<br />
Over the past 30 years the proportion <strong>of</strong> the world’s population<br />
living in flood-prone river basins has increased<br />
by 114 per cent <strong>and</strong> those living on cyclone-exposed<br />
coastlines by 192 per cent. 3<br />
Reports <strong>of</strong> extreme weather events <strong>and</strong> disasters have<br />
more than tripled since the 1960s <strong>and</strong> scientists expect<br />
such events to become more frequent <strong>and</strong> severe in the<br />
future due to <strong>climate</strong> change in many parts <strong>of</strong> the world.<br />
There is also growing evidence that links escalations<br />
in violence <strong>and</strong> conflict over access to food <strong>and</strong> water<br />
resources to <strong>climate</strong>. 4<br />
CLIMATE SERVICES AND HEALTH EMERGENCIES<br />
Adopted by 168 Member States at the <strong>World</strong> Disaster<br />
Reduction Conference in Kobe, Japan in 2005, the Hyogo<br />
Framework For Action describes the work that is required<br />
from all different sectors <strong>and</strong> actors, including <strong>health</strong><br />
<strong>and</strong> <strong>climate</strong> communities, to reduce disaster losses. The<br />
Global Framework for Climate Services will contribute to<br />
the implementation <strong>of</strong> the Hyogo Framework by making<br />
tailored science-based <strong>climate</strong>-related information available<br />
to support informed investment <strong>and</strong> planning at<br />
all levels as a critical step in disaster risk management. 5<br />
Climate services support <strong>health</strong> <strong>and</strong> other sectors to save<br />
lives <strong>and</strong> reduce illness <strong>and</strong> injury in emergencies by:<br />
• assisting <strong>health</strong> emergency response operations, for<br />
example, by providing early warnings <strong>of</strong> extreme hot<br />
<strong>and</strong> cold temperatures;<br />
• providing seasonal forecasting <strong>and</strong> early warning<br />
systems to enable planning <strong>and</strong> action;<br />
• determining which populations <strong>and</strong> <strong>health</strong> care<br />
facilities are at risk <strong>of</strong> hydrometeorological hazards<br />
using risk assessment tools;<br />
• applying <strong>climate</strong> change models to forecast the longterm<br />
effects <strong>of</strong> <strong>climate</strong> change, information which<br />
could be used, for example, to decide where to locate<br />
new <strong>health</strong> facilities away from high risk areas; <strong>and</strong>,<br />
• providing real-time meteorological <strong>and</strong> hydrological<br />
data, properly integrated with related <strong>health</strong> services<br />
data <strong>and</strong> information, to support local <strong>and</strong> national<br />
decision-making.<br />
25
SECTION 2 | EMERGENCIES<br />
FLOODS AND CYCLONES<br />
United States<br />
Widespread flooding in Missouri <strong>and</strong><br />
Southern Indiana during 2008.<br />
WIDESPREAD EFFECTS<br />
Floods can cause widespread devastation, resulting in<br />
loss <strong>of</strong> life <strong>and</strong> damages to personal property <strong>and</strong> critical<br />
public <strong>health</strong> infrastructure that amount to billions <strong>of</strong><br />
dollars in economic losses.<br />
Floods <strong>and</strong> cyclones may directly <strong>and</strong> indirectly affect<br />
<strong>health</strong> in many ways, for example by:<br />
Mexico<br />
Massive floods in November 2007<br />
were the worst experienced in<br />
5 decades <strong>and</strong> caused the worst<br />
disaster in Mexico’s history.<br />
Colombia <strong>and</strong> Venezuela<br />
November 2010 saw the worst<br />
flooding in over 30 years.<br />
Peru <strong>and</strong> Bolivia<br />
Heavy seasonal rainfall in 2004<br />
caused crop damage <strong>and</strong><br />
at least 50 deaths.<br />
• increasing cases <strong>of</strong> drowning <strong>and</strong> other physical<br />
trauma;<br />
• increasing risks <strong>of</strong> water- <strong>and</strong> vector-borne infectious<br />
diseases;<br />
• increasing mental <strong>health</strong> effects associated with<br />
emergency situations; 1<br />
Chile<br />
There was severe<br />
flooding in the<br />
southern-central<br />
region in 2002.<br />
• disrupting <strong>health</strong> systems, facilities <strong>and</strong> services,<br />
leaving communities without access to <strong>health</strong> care 2<br />
when they are needed most; <strong>and</strong><br />
• damaging basic infrastructure such as food <strong>and</strong> water<br />
supplies <strong>and</strong> safe shelter. 3<br />
WHO<br />
CASE STUDY: BANGLADESH<br />
In 1970, the world’s most devastating cyclone to date<br />
claimed approximately 500 000 lives in Bangladesh,<br />
<strong>and</strong> another in 1991 claimed around 140 000 lives.<br />
Since 1991, the government with the support <strong>of</strong> the<br />
UN, including WHO <strong>and</strong> WMO, has established early<br />
warning systems, shelters along coastal areas, search<br />
<strong>and</strong> rescue teams <strong>and</strong> first-aid training <strong>and</strong> equipment.<br />
Bangladesh now has the capacity to evacuate hundreds<br />
<strong>of</strong> thous<strong>and</strong>s <strong>of</strong> people from the path <strong>of</strong> floods<br />
<strong>and</strong> cyclones. When Sidr, a very strong, Category-4<br />
cyclone struck Bangladesh in November 2007, the<br />
devastation it wreaked was widespread. Sidr was <strong>of</strong><br />
similar strength as the cyclone <strong>of</strong> 1991, but its death<br />
toll, 3000 lives, was much lower. 4<br />
26
United Kingdom<br />
2007 saw the worst flooding in 60 years.<br />
Siberia<br />
In 2001, the homes <strong>of</strong> over 300 000 people<br />
were lost or damaged in widespread floods.<br />
France<br />
Severe flooding<br />
resulted in damage<br />
<strong>and</strong> deaths in<br />
September 2002.<br />
Central & Eastern Europe<br />
2010 flooding in Danube river<br />
basin caused severe damage.<br />
Algeria & Morocco<br />
The worst floods in a century<br />
in November 2008 caused severe<br />
infrastructure damage.<br />
Western Africa<br />
Benin experienced its worst flooding<br />
on record in the summer <strong>of</strong> 2010.<br />
Suriname<br />
Torrential rain in 2006 caused<br />
the worst disaster in recent times.<br />
Brazil<br />
Intense rainfall in November 2008<br />
caused flooding <strong>and</strong> mudslides in<br />
Santa Catarina state.<br />
Eastern Africa<br />
Extensive flooding in Kenya,<br />
southern Ethiopia <strong>and</strong> Somalia<br />
during 2003. Some areas experienced<br />
the wettest conditions for more<br />
than 70 years.<br />
Southern Africa<br />
Between February <strong>and</strong> April 2001 heavy<br />
rainfall <strong>and</strong> flooding in several southern<br />
Argentina & Uruguay<br />
African countries.<br />
In Spring 2003, Santa Fe province<br />
experienced the worst flooding since 1800’s.<br />
China<br />
In the summer <strong>of</strong> 2007, the region <strong>of</strong><br />
Huai He river valley was affected by the<br />
worst floods since 1954.<br />
Pakistan<br />
Most severe flooding in decades occurred<br />
during summer <strong>of</strong> 2010, causing thous<strong>and</strong>s <strong>of</strong> deaths.<br />
India<br />
The 2005 monsoon season resulted in<br />
unprecedented heavy rain <strong>and</strong> massive flooding<br />
in parts <strong>of</strong> western <strong>and</strong> southern India.<br />
Australia <strong>and</strong> Indonesia<br />
Large parts <strong>of</strong> Indonesia <strong>and</strong> Australia<br />
experienced heavy rains in 2010.<br />
New Zeal<strong>and</strong><br />
Heavy floods in 2005 caused<br />
widespread damage in<br />
parts <strong>of</strong> Tauranga.<br />
A number <strong>of</strong> major flood events from 2000 – 2010 5<br />
77,640<br />
NORTH<br />
AMERICA<br />
1,190<br />
640<br />
1,870<br />
1,650<br />
EUROPE<br />
29,780<br />
Average Physical<br />
Exposure to Floods Assuming<br />
Constant Hazard<br />
in thous<strong>and</strong>s <strong>of</strong> people per year<br />
in 2030<br />
in 1970<br />
Circles are proportional<br />
to the number <strong>of</strong> persons affected<br />
180<br />
70<br />
CARIBBEAN*<br />
1,320<br />
550<br />
CENTRAL AND<br />
SOUTH AMERICA<br />
AFRICA<br />
3,640<br />
850<br />
ASIA<br />
60<br />
30<br />
AUSTRALIA<br />
NEW ZEALAND<br />
* Only catchments bigger than 1,000 km 2 were included in this analysis. Therefore, only the largest isl<strong>and</strong>s in the Caribbean are covered.<br />
The projected increase in the number <strong>of</strong> people (in thous<strong>and</strong>s) exposed to floods in 2030<br />
compared to those in 1970 6<br />
27
FORECASTING FLOODS AND CYCLONES: PREPARE AND PREDICT TO SAVE LIVES<br />
Climate information about flood <strong>and</strong> cyclone risks,<br />
routinely prepared by national meteorological services,<br />
inform billions <strong>of</strong> people around the world <strong>of</strong> the hazards<br />
they face, <strong>of</strong> ways <strong>of</strong> reducing their vulnerability <strong>and</strong> <strong>of</strong><br />
emergency preparedness measures. These same services<br />
provide advice to government <strong>and</strong> other organizations<br />
concerning disaster response.<br />
The El Niño/La Niña “cycle” is an episodic change<br />
between large scale warming <strong>and</strong> cooling either side<br />
<strong>of</strong> the equator in the Pacific Ocean. When El Niño <strong>and</strong><br />
La Niña are at their most intense extreme weather<br />
events may result in disaster when communities are<br />
ill-prepared to face them.<br />
Making hospitals safe from disasters, either by reinforcing<br />
existing hospitals or ensuring that all new hospitals<br />
are built to withst<strong>and</strong> local hazards, protects patients<br />
<strong>and</strong> staff, <strong>and</strong> enables them to provide <strong>health</strong> services<br />
in the aftermath <strong>of</strong> an emergency, when they are most<br />
needed. Using <strong>climate</strong> information about flood hazards,<br />
<strong>health</strong> facilities can be built in areas that are not prone<br />
to flooding, <strong>and</strong> early warnings can ensure that staff<br />
are ready to respond to emergencies. 7<br />
Tropical Cyclone<br />
centres count as<br />
a function <strong>of</strong><br />
SOI index<br />
0.1 - 7<br />
7.1 - 14<br />
14.1 - 21<br />
Tropical Cyclone<br />
centres count as<br />
a function <strong>of</strong><br />
SOI index<br />
0.1 - 7<br />
7.1 - 14<br />
14.1 - 21<br />
21.1 - 28<br />
Tropical cyclone tracks vary substantially between times El Niño <strong>and</strong> times <strong>of</strong> La Niña. The locations <strong>of</strong><br />
tropical cyclones is shown above for months <strong>of</strong> La Niña conditions (upper panel), <strong>and</strong> months <strong>of</strong> El Niño<br />
conditions (lower panel) 8<br />
CASE STUDY: PAKISTAN<br />
During Pakistan’s 2010 flood emergency, monsoonal<br />
rains <strong>and</strong> raging floodwaters damaged or destroyed<br />
more than 500 hospitals <strong>and</strong> clinics. 9 Information<br />
on the extent <strong>of</strong> the flooding enabled the Ministry<br />
<strong>of</strong> <strong>Health</strong>, supported by WHO <strong>and</strong> <strong>Health</strong> Cluster<br />
partners, to plan <strong>and</strong> position <strong>health</strong> services for the<br />
affected populations.<br />
Facilities damaged during the 2010 floods had been<br />
identified as at risk <strong>of</strong> damage in a flood hazard<br />
modelling analysis conducted by the Ministry <strong>of</strong><br />
<strong>Health</strong> <strong>and</strong> WHO in 2008. 10 WMO continues to work<br />
with the National Meteorological Service to improve<br />
their capability to forecast extreme events such as<br />
the 2010 flood.<br />
28
Province Established In progress Not Established Total<br />
Balochistan 11 4 0 15<br />
Khyber Pakhtunkhwa 27 0 0 27<br />
Punjab 12 4 2 18<br />
Sindh 11 7 2 20<br />
Gr<strong>and</strong> Total 61 15 4 80<br />
Status <strong>of</strong><br />
Diarrhoea Treatment Centers (DTCs)<br />
(WHO, 04/10/2010)<br />
Established<br />
In Progress<br />
Not Yet Established<br />
WHO Hubs <strong>and</strong> <strong>Health</strong> Clusters<br />
Flood-Affected Areas<br />
Flood Extent (UNOSAT Satellite Imagery Analysis,<br />
08/08/2010 to 16/09/2010)<br />
(Official, NDMA, 20/09/2010)<br />
Severe<br />
Medium<br />
Not applicable<br />
International Boundaries<br />
100<br />
0 200 400<br />
Km<br />
Flood-affected districts <strong>of</strong> Pakistan during 2010 <strong>and</strong> the location <strong>of</strong> diarrhoea treatment centres 11<br />
Flood Hazard (index)<br />
(WHO, 2008)<br />
Very low<br />
Low<br />
Medium<br />
High<br />
Very high<br />
Not applicable<br />
International boundaries<br />
90<br />
80<br />
78<br />
Number <strong>of</strong> <strong>health</strong> facilities<br />
70<br />
60<br />
50<br />
40<br />
30<br />
20<br />
10<br />
4<br />
37<br />
31<br />
30<br />
100<br />
0 200 400<br />
Km<br />
0<br />
Very low<br />
Low Medium High<br />
Flood hazard intensity level<br />
Very high<br />
Map produced in 2008, indicating flood hazard prone areas <strong>and</strong> grading<br />
the level <strong>of</strong> exposure <strong>of</strong> <strong>health</strong> facilities 12<br />
29
SECTION 2 | EMERGENCIES<br />
DROUGHT<br />
Canada<br />
Severe drought conditions<br />
during 2001. Many regions<br />
experienced their driest growing<br />
season in 34 years.<br />
United States<br />
Severe drought conditions in 2004<br />
<strong>and</strong> 2005 in western region.<br />
Drought in 2006 contributed to<br />
a record wildfire season with<br />
3.9 million hectares burned.<br />
DROUGHT: THE BIGGER PICTURE<br />
Drought is a prolonged dry period in the natural <strong>climate</strong><br />
cycle that can occur anywhere in the world. It is<br />
a slow-onset phenomenon caused by rainfall deficit.<br />
Compounding factors such as poverty <strong>and</strong> inappropriate<br />
l<strong>and</strong> use increase vulnerability to drought.<br />
When drought causes water <strong>and</strong> food shortages, there<br />
can be many impacts on the <strong>health</strong> <strong>of</strong> the affected<br />
population which may increase morbidity <strong>and</strong> result in<br />
deaths. In recent years, most drought-related mortality<br />
has occurred in countries also experiencing political<br />
<strong>and</strong> civil conflicts.<br />
Drought may have acute <strong>and</strong> chronic <strong>health</strong> effects:<br />
• malnutrition due to the decreased availability <strong>of</strong> food;<br />
• increased risk <strong>of</strong> communicable diseases due to<br />
acute malnutrition, inadequate or unsafe water for<br />
consumption <strong>and</strong> sanitation, <strong>and</strong> increased crowding<br />
among displaced populations;<br />
• psycho-social stress <strong>and</strong> mental <strong>health</strong> disorders;<br />
• overall increase <strong>of</strong> population displacement; <strong>and</strong><br />
• disruption <strong>of</strong> local <strong>health</strong> services due to a lack <strong>of</strong><br />
water supplies <strong>and</strong>/or <strong>health</strong> care workers being<br />
forced to leave local areas. 1,2<br />
Measles<br />
HIV/AIDS<br />
1%<br />
2%<br />
Injuries<br />
3%<br />
Malaria<br />
8%<br />
Diarrhoea<br />
14%<br />
Others<br />
16%<br />
Central America<br />
Dry summer conditions during 2002<br />
had significant impacts.<br />
Brazil<br />
A series <strong>of</strong> below normal rainfalls<br />
between 2004 <strong>and</strong> 2010 led to severe<br />
drought in the Amazon, the worst<br />
in 60 years.<br />
Globally, more<br />
than one third <strong>of</strong><br />
child deaths are<br />
attributable to<br />
undernutrition<br />
Pneumonia<br />
14%<br />
Neonatal<br />
41%<br />
Undernutrition contributes to a range<br />
<strong>of</strong> diseases, <strong>and</strong> causes 35 per cent <strong>of</strong> all<br />
under-five deaths 3,5<br />
WHO<br />
30
Western Europe<br />
Affected by severe summer<br />
drought in 2005<br />
Western Russia<br />
Severe drought across central region<br />
from April to August with the lowest rainfall<br />
on record.<br />
Western Africa<br />
Below normal precipitation in 2002 <strong>and</strong><br />
long-term drought conditions in some areas.<br />
China<br />
Drought was present across country<br />
for much <strong>of</strong> 2009.<br />
Southern Asia<br />
Devastating drought from 1998 to 2001.<br />
Greater Horn <strong>of</strong> Africa<br />
The long-term drought during 2005<br />
continued in 2006. It severely affected<br />
15 million people.<br />
Southern Africa<br />
Severe drought conditions in early 2003<br />
Australia<br />
Most severe drought ever recorded across<br />
parts <strong>of</strong> the country during 2000 – 2010.<br />
South-eastern South America<br />
Severe <strong>and</strong> prolonged drought in 2008<br />
was the worst for over a century.<br />
A number <strong>of</strong> major drought events from 2000 – 2010 4<br />
Children<br />
aged < 5 years<br />
underweight (%)<br />
30<br />
Data not available<br />
Not applicable<br />
Percentage <strong>of</strong> underweight children under 5 years <strong>of</strong> age<br />
(based on latest available data from 2000) 6<br />
31
CASE STUDY: HORN OF AFRICA CRISIS 2010-2011<br />
Two consecutive seasons <strong>of</strong> significantly below average<br />
rainfall made 2011 one <strong>of</strong> the driest years in the<br />
Eastern Horn <strong>of</strong> Africa since 1995. The on-going<br />
conflict in Somalia aggravated the situation, leading<br />
to a significant outflow <strong>of</strong> refugees into neighbouring<br />
states. Famine was declared in six regions <strong>of</strong> Somalia,<br />
with large areas <strong>of</strong> Kenya, Ethiopia, <strong>and</strong> Djibouti facing<br />
severe food insecurity, which led to high levels<br />
<strong>of</strong> acute malnutrition.<br />
As <strong>of</strong> September 2010, <strong>climate</strong> services gave clear early<br />
warnings <strong>of</strong> the reduced rainfall <strong>and</strong> <strong>of</strong> the emerging<br />
crisis situation, but coordinated <strong>and</strong> proactive action<br />
aimed at alleviating the predicted effects <strong>of</strong> the crisis<br />
did not take place. As a result, 13.3 million people<br />
were in need <strong>of</strong> humanitarian assistance in the region.<br />
Preventive action is possible. The Tana River Drought<br />
Recovery Project in Kenya supported modern agricultural<br />
practices <strong>and</strong> <strong>health</strong> activities, including<br />
conducting monthly mobile clinics in hard to reach<br />
areas, a house-to-house campaign on immunization<br />
<strong>and</strong> malaria, distribution <strong>of</strong> mosquito nets <strong>and</strong> the<br />
construction <strong>of</strong> a maternity wing at Mulago hospital.<br />
The 33 farms created by the Project provided long-term<br />
food security for almost 10 000 people. The same<br />
money, spent on food aid, would have given only<br />
1 250 people a partial food ration for six months. 7-10<br />
33<br />
33<br />
33<br />
I<br />
25<br />
35<br />
40<br />
III<br />
Legend<br />
No information<br />
II<br />
35<br />
40<br />
25<br />
25<br />
35 IV<br />
40<br />
Wetter than normal<br />
Drier than normal<br />
Water bodies<br />
Figures represents probabilities <strong>of</strong><br />
A<br />
N<br />
B<br />
Above normal<br />
Near normal<br />
Below normal<br />
The probabilities <strong>of</strong> above, near or below normal rainfall in the Horn <strong>of</strong> Africa<br />
for September to December 2010 11<br />
Climate<br />
event<br />
Community<br />
impact<br />
<strong>Health</strong><br />
impact<br />
<strong>Health</strong> emergency<br />
response<br />
Water<br />
shortage<br />
Diarrhoea,<br />
cholera,<br />
etc.<br />
1. Food supplementation <strong>and</strong><br />
<strong>health</strong> care<br />
2. Epidemic surveillance, early<br />
warning, response<br />
Drought<br />
Crop<br />
failure<br />
Livestock<br />
loss<br />
Malnutrition<br />
3. <strong>Health</strong> services<br />
(immunization, child & maternal<br />
<strong>health</strong>, referrals, education)<br />
Food crisis<br />
Other<br />
<strong>health</strong> risks<br />
(eg low birth<br />
weight)<br />
4. Special services:<br />
outreach, mobile teams<br />
5. Emergency funding to<br />
support <strong>health</strong> action<br />
Drought as a risk factor for complex public <strong>health</strong> impacts <strong>and</strong> the possible areas<br />
for public <strong>health</strong> response 12<br />
32
CASE STUDY: THE SAHEL – EARLY WARNING, EARLY RESPONSE<br />
As predicted by the regional Famine Early Warning<br />
System Network (FEWS NET) below-average rains in<br />
the Sahel in late 2011 resulted in drought conditions<br />
in 2012 <strong>and</strong> widespread food insecurity throughout<br />
the region. The UN estimated that over 18 million<br />
people were at risk in areas in nine countries where<br />
food insecurity <strong>and</strong> malnutrition were already chronic.<br />
In the Sahel the humanitarian community’s response<br />
to the early warning included:<br />
• Providing food assistance, including special<br />
foods designed to combat malnutrition;<br />
• Treating malnutrition, by training nurses,<br />
providing medical supplies <strong>and</strong> supporting free<br />
access to <strong>health</strong> care;<br />
• Preventing communicable diseases through<br />
vaccination, disease surveillance, <strong>and</strong> preparedness<br />
for outbreaks; <strong>and</strong><br />
• Improving water <strong>and</strong> sanitation services<br />
thereby, promoting hygiene. 13<br />
Food Security Conditions April-June 2012<br />
(Integrated Food Security Phase Classification Scale)<br />
Normal or minimal<br />
Stressed<br />
Crisis<br />
Emergency<br />
Catastrophe/Famine<br />
Data not available<br />
Not applicable<br />
Most likely food security conditions in the<br />
Sahel Region between April-June (at 2 April<br />
2012). Senegal, Gambia, northern Nigeria <strong>and</strong><br />
northern Cameroon was also affected 14<br />
Drought frequency<br />
in number <strong>of</strong> years (yrs)<br />
0<br />
Less than 1 in 15<br />
1 in 7 - 9<br />
1 in 5 - 6<br />
1 in 4<br />
1 in 3<br />
Data not available<br />
Frequency <strong>of</strong> drought (WRSI for Millet) from 1996-2011 across the Sahel region 15<br />
33
SECTION 2 | EMERGENCIES<br />
AIRBORNE DISPERSION<br />
OF HAZARDOUS MATERIALS<br />
Large-scale dispersion <strong>of</strong> airborne hazardous materials<br />
such as smoke from large fires, chemicals released<br />
from hazardous facilities <strong>and</strong> radiological materials<br />
from nuclear incidents can adversely affect human <strong>and</strong><br />
animal life <strong>and</strong> the environment. 1<br />
WILDFIRES AND FOREST FIRES<br />
Wildfires <strong>and</strong> forest fires occur in all vegetation zones.<br />
Caused by natural phenomena or by human activity,<br />
emissions from fires contain gas <strong>and</strong> particle pollutants<br />
that can cause diverse <strong>health</strong> problems, as well as disrupt<br />
transportation, tourism <strong>and</strong> agriculture. Extreme radiant<br />
heat <strong>and</strong> smoke inhalation may cause injury <strong>and</strong> death<br />
to people directly exposed to the fires. The occurrence<br />
<strong>of</strong> wildfires is strongly determined by the incidence <strong>of</strong><br />
drought <strong>and</strong> heat waves. Climatologists believe that<br />
<strong>climate</strong> change will increase in the incidence <strong>of</strong> wildfires<br />
as the associated droughts <strong>and</strong> heat waves are expected<br />
to increase in frequency <strong>and</strong> intensity.<br />
CASE STUDY: SOUTH-EAST ASIA FOREST FIRES OF 1997<br />
South-East Asia witnessed one <strong>of</strong> its worst smoke <strong>and</strong><br />
haze episodes in autumn 1997 due to forest fires that<br />
were exacerbated by the El Niño-related drought. It<br />
is estimated that more than two million hectares <strong>of</strong><br />
forests burned in the Indonesian isl<strong>and</strong>s <strong>of</strong> Kalimantan<br />
<strong>and</strong> Sumatra, emitting the equivalent level <strong>of</strong> carbon<br />
dioxide as a whole year <strong>of</strong> CO 2<br />
emissions in Europe. 2<br />
Meteorological services tracked the resulting smoke<br />
<strong>and</strong> haze, which adversely affected the <strong>health</strong> <strong>of</strong><br />
populations <strong>of</strong> Indonesia <strong>and</strong> neighbouring countries.<br />
In Indonesia, among the 12 360 000 people exposed<br />
to the haze, it was estimated that there were over<br />
1 800 000 cases <strong>of</strong> bronchial asthma, bronchitis <strong>and</strong><br />
acute respiratory infection. <strong>Health</strong> surveillance in<br />
Singapore from August to November 1997 showed a<br />
30 per cent increase in hospital outpatient attendance<br />
for haze-related conditions, as well as an increase in<br />
“accident <strong>and</strong> emergency” attendances. 3<br />
The image shows the pollution over Indonesia<br />
<strong>and</strong> the Indian Ocean on October 22, 1997.<br />
White represents the aerosols (smoke) that<br />
remained in the vicinity <strong>of</strong> the fires. Green,<br />
yellow, <strong>and</strong> red pixels represent increasing<br />
amounts <strong>of</strong> tropospheric ozone (smog) being<br />
carried to the west by high-altitude winds. 4<br />
34
Red areas show global distribution <strong>of</strong> fire occurrences over a<br />
10-day period from 08/08/2012 - 17/08/2012. 5<br />
CASE STUDY: CHERNOBYL NUCLEAR ACCIDENT<br />
On 26 April 1986 a nuclear accident at the Chernobyl<br />
Nuclear Power Plant in the former Union <strong>of</strong> Soviet<br />
Socialist Republics (in what is now Ukraine) released<br />
large quantities <strong>of</strong> radioactive materials<br />
which were carried in the atmosphere over<br />
much <strong>of</strong> Eastern <strong>and</strong> Western Europe. These<br />
releases caused radiation exposure <strong>of</strong> the<br />
workers involved in the emergency <strong>and</strong><br />
clean-up operations after the accident, those<br />
evacuated from nearby settlements, <strong>and</strong><br />
people living in contaminated areas outside<br />
the immediate vicinity <strong>of</strong> Chernobyl. A<br />
substantial increase in thyroid cancer was<br />
recorded among children due to radioactive<br />
iodine exposure during the first few months<br />
following the accident. 6<br />
The Chernobyl accident was the main reason<br />
for the development <strong>of</strong> modelling systems to<br />
Incidence, per 100,000<br />
forecast atmospheric transport <strong>of</strong> radioactivity <strong>and</strong> to<br />
start the Emergency Response Activities programme<br />
<strong>of</strong> WMO.<br />
9<br />
8<br />
7<br />
6<br />
5<br />
4<br />
3<br />
2<br />
1<br />
0<br />
Belarus<br />
Ukraine<br />
1986 1988 1990 1992 1994 1996 1998 2000 2002<br />
Years<br />
The graph illustrates the number <strong>of</strong> cases <strong>of</strong> thyroid<br />
cancer, per 100 000 population, for children <strong>and</strong><br />
adolescents in Belarus <strong>and</strong> Ukraine who were<br />
exposed to radiation after the Chernobyl accident 7<br />
35
METEOROLOGICAL SERVICES<br />
National Meteorological Services can provide information<br />
on the dispersion <strong>and</strong> spread <strong>of</strong> the fire <strong>and</strong> smoke<br />
plumes to support <strong>health</strong> <strong>and</strong> emergency management<br />
authorities in taking decisions on, for example, the<br />
evacuation <strong>of</strong> neighbourhoods, the closing <strong>of</strong> roads or<br />
advising the population <strong>of</strong> water <strong>and</strong> foods likely to be<br />
contaminated. The occurrence <strong>of</strong> wildfires is strongly<br />
determined by the incidence <strong>of</strong> drought <strong>and</strong> heat waves.<br />
weather forecasts support local <strong>and</strong> regional emergency<br />
response operations <strong>and</strong> meteorological modelling <strong>and</strong><br />
mapping systems can assess <strong>and</strong> predict the movement,<br />
spread <strong>and</strong> concentration <strong>of</strong> airborne hazardous<br />
substances from the location <strong>of</strong> sudden release. The<br />
meteorological services provide an analysis <strong>of</strong> how<br />
wind, rain <strong>and</strong> other meteorological phenomena will<br />
affect the dispersion <strong>of</strong> the hazardous substances.<br />
Meteorology can play an important role in reducing the<br />
<strong>health</strong> effects <strong>of</strong> hazardous material suddenly released<br />
into the environment. Meteorological information such as<br />
SHUTTERSTOCK.COM / PETER J. WILSON<br />
36
CASE STUDY: MAJOR FIRE AT BUNCEFIELD, UNITED KINGDOM<br />
On 11 December 2005, there was a major explosion<br />
at the Buncefield Oil Depot in Hemel Hempstead,<br />
United Kingdom, resulting in the largest peacetime<br />
fire in Europe to date. The fire burned for four days<br />
before it was extinguished. 1<br />
The Met Office Operations Centre in the United Kingdom<br />
provided immediate <strong>and</strong> hourly data as well as<br />
forward-looking modelling on the smoke plume to<br />
government departments across the United Kingdom,<br />
including the <strong>Health</strong> Protection Agency. Data on<br />
the composition <strong>of</strong> the smoke was compiled with<br />
information from the modelling <strong>of</strong> the plume spread<br />
<strong>and</strong> dispersal. The areas at risk from grounding <strong>of</strong> the<br />
smoke plume were thus identified <strong>and</strong> the high-level<br />
comm<strong>and</strong> decisions on evacuation <strong>and</strong> emergency<br />
response were facilitated. 9<br />
In summary 244 individuals attended hospital in<br />
the aftermath <strong>of</strong> the fire, 43 were directly injured by<br />
the blast but there were no fatalities. The incident<br />
demonstrates the value <strong>of</strong> an integrated <strong>health</strong> protection<br />
service, informed by the meteorology service,<br />
able to work across different sectors <strong>and</strong> provide<br />
comprehensive advice <strong>and</strong> support to emergency<br />
responders <strong>and</strong> the population at risk. 9<br />
Air concentration<br />
<strong>of</strong> particulates<br />
Lowest<br />
Medium<br />
High<br />
Highest<br />
The dispersion model mapping the density <strong>of</strong> the plume across the south-east <strong>of</strong><br />
the UK from the Buncefield fire, 2005 8<br />
37
Vehicles clog a major<br />
thoroughfare as smog shrouds<br />
the skyline in Beijing, China<br />
38<br />
CLARO CORTES / REUTERS
SECTION 3<br />
EMERGING ENVIRONMENTAL<br />
CHALLENGES<br />
Current development patterns, <strong>and</strong> individual behavioural<br />
choices, are bringing a range <strong>of</strong> new challenges<br />
to public <strong>health</strong>. Many <strong>of</strong> the most important relate to<br />
environmental changes.<br />
The clearest example is <strong>climate</strong> change. The accumulation<br />
<strong>of</strong> greenhouse gases in the atmosphere, driven mainly<br />
by the use <strong>of</strong> fossil fuels, is increasing temperatures<br />
<strong>and</strong> exposing populations to more frequent <strong>and</strong> intense<br />
weather extremes as well as undermining environmental<br />
determinants <strong>of</strong> <strong>health</strong>, such as clean water <strong>and</strong> adequate<br />
nutrition. Similarly, the accumulation <strong>of</strong> Chlor<strong>of</strong>luorocarbons<br />
(CFCs) <strong>and</strong> other industrial chemicals in the<br />
atmosphere has degraded the stratospheric ozone layer,<br />
increasing levels <strong>of</strong> ultraviolet radiation – the major risk<br />
factor for developing skin cancers.<br />
The <strong>health</strong> impacts <strong>of</strong> these environmental changes,<br />
however, are strongly mediated by local factors. Air<br />
pollution, both inside <strong>and</strong> outside the home, is caused<br />
by a combination <strong>of</strong> global development patterns,<br />
<strong>and</strong> weak control <strong>of</strong> polluting energy sources at the<br />
national <strong>and</strong> local level, making it one <strong>of</strong> the largest,<br />
<strong>and</strong> fastest growing, contributors to global ill <strong>health</strong>.<br />
The <strong>health</strong> issues related to the increasing frequency<br />
<strong>of</strong> heat waves is compounded by a rapid increase in the<br />
size <strong>of</strong> the most vulnerable populations: older people,<br />
particularly those living in large cities in the tropics<br />
<strong>and</strong> subtropics. The hazard <strong>of</strong> ultraviolet radiation has<br />
combined with a tendency over recent decades for fairskinned<br />
populations to spend increasing amounts <strong>of</strong><br />
time in the sun. In some cases, such as with the rapid<br />
rise in asthma <strong>and</strong> other respiratory conditions associated<br />
with pollen exposure the mechanisms are poorly<br />
understood – but the early evidence suggests that the<br />
rise in observed cases is also caused by a combination<br />
<strong>of</strong> more conducive <strong>climate</strong> <strong>and</strong> environmental conditions,<br />
more active surveillance by <strong>health</strong> services, <strong>and</strong><br />
individual susceptibility.<br />
A combined response to emerging environmental challenges<br />
is needed from the individual up to the local,<br />
national <strong>and</strong> international levels. A close collaboration<br />
between <strong>climate</strong> <strong>and</strong> <strong>health</strong> services can make an<br />
important contribution to all <strong>of</strong> these efforts. At the<br />
local level, weather forecasts in many parts <strong>of</strong> the world<br />
now routinely provide information on levels <strong>of</strong> ozone<br />
<strong>and</strong> particulate air pollutants, <strong>of</strong> pollen, <strong>of</strong> exposure to<br />
ultraviolet radiation, <strong>and</strong> warnings <strong>of</strong> when high temperatures<br />
may become hazardous to <strong>health</strong>. When this<br />
service is properly connected with guidance or plans for<br />
preventive action, it can enable individuals, <strong>and</strong> <strong>health</strong><br />
services, to avoid or limit harm to <strong>health</strong>.<br />
Meteorological <strong>and</strong> other environmental monitoring<br />
services also provide information on environmental<br />
hazards over wider spatial scales, <strong>and</strong> over longer<br />
time periods. This includes, for example, monitoring<br />
<strong>of</strong> the dispersal <strong>of</strong> particulate air pollution within <strong>and</strong><br />
across national boundaries over weeks or months, <strong>and</strong><br />
<strong>of</strong> the condition <strong>of</strong> the ozone layer over years. Perhaps<br />
most fundamentally, meteorological services provide<br />
the essential data allowing us to track, <strong>and</strong> to predict,<br />
the progress <strong>of</strong> global <strong>climate</strong> change over decades to<br />
centuries. <strong>Health</strong> services can use this information to<br />
ensure that <strong>health</strong> protection services adapt as much as<br />
possible to changing conditions. They can also use it to<br />
advocate for environmental protection, <strong>and</strong> sustainable<br />
development, as fundamental contributions to sustain<br />
<strong>health</strong>y human lives.<br />
39
SECTION 3 | EMERGING ENVIRONMENTAL CHALLENGES<br />
HEAT STRESS<br />
Alaska/N.W. Canada<br />
E. Canada/Greenl<strong>and</strong>/Icel<strong>and</strong><br />
16<br />
16<br />
8<br />
8<br />
4<br />
4<br />
2<br />
2<br />
1<br />
1<br />
W. North America<br />
C. North America<br />
E. North America<br />
16<br />
16<br />
16<br />
8<br />
8<br />
8<br />
4<br />
4<br />
4<br />
2<br />
2<br />
2<br />
1<br />
1<br />
1<br />
THE DANGERS OF THE SUN<br />
Excessive heat is a growing public <strong>health</strong> threat – for<br />
every degree Centigrade above a threshold level, deaths<br />
can increase by 2 – 5 per cent. Prolonged, intense heat<br />
waves heighten the risks. Elderly, chronically-ill <strong>and</strong><br />
socially-isolated individuals, people working in exposed<br />
environments <strong>and</strong> children are particularly vulnerable. 1, 2<br />
Central America/Mexico<br />
16<br />
8<br />
4<br />
2<br />
1<br />
16<br />
8<br />
4<br />
2<br />
1<br />
Amazon<br />
16<br />
N.E. Brazil<br />
While extreme heat affects populations around the<br />
world in both developing <strong>and</strong> developed countries,<br />
some <strong>of</strong> the most dramatic heat waves have occurred<br />
in relatively wealthy regions <strong>of</strong> the world with cooler<br />
average temperatures <strong>and</strong> mid-latitude <strong>climate</strong>s. The<br />
extended heat <strong>of</strong> the European summer <strong>of</strong> 2003 caused<br />
a rise in death rates that was 4 to 5 times expected levels<br />
at the peak <strong>of</strong> the event in some cities, eventually causing<br />
over 70 000 additional deaths across twelve countries. 3,4<br />
Heat stress affects rural areas but is particularly severe<br />
in cities, where the urban heat-isl<strong>and</strong> effect can raise<br />
temperatures by more than 5°C, 5 <strong>and</strong> high temperatures<br />
exacerbate the harmful effects <strong>of</strong> ozone <strong>and</strong> particulate<br />
air pollution.<br />
Climate change – which is expected to increase the<br />
intensity <strong>and</strong> frequency <strong>of</strong> such extremes – will worsen<br />
the hazards to human <strong>health</strong>. By the 2050s, heat events<br />
that would currently occur only once every 20 years will<br />
be experienced on average every 2 – 5 years. 6 Population<br />
growth, ageing <strong>and</strong> urbanization are also expected to<br />
increase the numbers <strong>of</strong> people at high risk. By 2050, it<br />
is estimated that there will be at least 3 times as many<br />
people aged over 65 living in cities around the world,<br />
with developing regions seeing the greatest increases. 7<br />
The combined effects <strong>of</strong> escalating hazards <strong>and</strong> growing<br />
vulnerable populations will make heat stress a <strong>health</strong><br />
priority for the coming decades.<br />
Urban Pop. > 65 yrs (Millions)<br />
Population<br />
increase factor<br />
(2010 to 2050)<br />
1 - 2.99<br />
3 - 4.99<br />
5 - 6.99<br />
7 - 9.99<br />
>10<br />
Data not available<br />
Not applicable<br />
2010 2050<br />
500<br />
400<br />
300<br />
200<br />
100<br />
0<br />
W. Coast South America<br />
Africa<br />
Americas<br />
Eastern Mediterranean<br />
Europe<br />
South-East Asia<br />
16<br />
8<br />
4<br />
2<br />
1<br />
Western Pacific<br />
S.E. South America<br />
16<br />
8<br />
4<br />
2<br />
1<br />
8<br />
4<br />
2<br />
1<br />
Older people living in cities are at particular<br />
risk; <strong>and</strong> their number is expected to increase<br />
dramatically by the middle <strong>of</strong> the Century 7<br />
40
16<br />
N. Europe<br />
N. Asia<br />
8<br />
16<br />
4<br />
8<br />
2<br />
4<br />
1<br />
2<br />
C. Europe<br />
1<br />
16<br />
8<br />
4<br />
2<br />
1<br />
W. Asia<br />
C. Asia Tibetan Plateau E. Asia<br />
16<br />
16<br />
16<br />
16<br />
S. Europe/Mediterranean<br />
8<br />
8<br />
8<br />
8<br />
16<br />
4<br />
4<br />
4<br />
4<br />
8<br />
2<br />
2<br />
2<br />
2<br />
4<br />
1<br />
1<br />
1<br />
1<br />
2<br />
1<br />
Sahara<br />
16<br />
8<br />
4<br />
S. Asia<br />
2<br />
16<br />
1<br />
8<br />
4<br />
2<br />
1<br />
S.E. Asia<br />
16<br />
8<br />
W. Africa E. Africa<br />
4<br />
2<br />
16<br />
16<br />
1<br />
8<br />
8<br />
4<br />
4<br />
2<br />
2<br />
1<br />
1<br />
N. Australia<br />
16<br />
8<br />
S. Africa<br />
4<br />
2<br />
16<br />
8<br />
4<br />
1<br />
S. Australia/New Zeal<strong>and</strong><br />
16<br />
2<br />
8<br />
1<br />
4<br />
2<br />
1<br />
Increasingly frequent heatwaves will combine with growing vulnerable populations. Bar graphs show<br />
how frequently a heat event that would have occurred only once in 20 years in the late 20 th Century,<br />
is expected to occur in the mid 21 st Century, under different <strong>climate</strong> change scenarios. 6 Lower numbers<br />
indicate more frequent events. Countries are shaded according to the expected proportional increase in<br />
urban populations aged over 65 8<br />
250 45.0<br />
200<br />
40.0<br />
150<br />
35.0<br />
30.0<br />
100<br />
25.0<br />
50<br />
20.0<br />
0<br />
25.07 26.07 27.07 28.07 29.07 30.07 31.07 1.08 2.08 3.08 4.08 5.08 6.08 7.08 8.08 9.08 10.08 11.08 12.08 13.08 14.08 15.08 16.08 17.08 18.08<br />
15.0<br />
Deaths in hospitals<br />
Deaths reported by fire brigades<br />
Daily min. temperature<br />
Daily max. temperature<br />
Extreme heat is lethal in developed <strong>and</strong> developing countries: Daily maximum <strong>and</strong> minimum<br />
temperatures, <strong>and</strong> number <strong>of</strong> deaths: Paris, Summer 2003 9<br />
41
PROTECTING POPULATIONS FROM HEAT STRESS<br />
Protection from extreme heat requires a range <strong>of</strong> actions,<br />
from providing early warning, surveillance <strong>and</strong> treatment<br />
for vulnerable populations through to long-term urban<br />
planning to reduce the heat-isl<strong>and</strong> effect as well as<br />
initiatives to reduce greenhouse gas emissions to limit<br />
the severity <strong>of</strong> global <strong>climate</strong> change.<br />
Collaboration between <strong>health</strong> <strong>and</strong> <strong>climate</strong> services is<br />
critical to implement all <strong>of</strong> these actions. For example,<br />
following the devastating 2003 heat wave, 17 countries<br />
across Europe established heat-<strong>health</strong> action plans.<br />
The essential components <strong>of</strong> such action plans are<br />
the identification <strong>of</strong> weather situations that adversely<br />
affect human <strong>health</strong>, the monitoring <strong>of</strong> meteorological<br />
forecasts, mechanisms to disseminate warnings, <strong>and</strong><br />
public <strong>health</strong> activities to reduce or prevent heat related<br />
illness <strong>and</strong> death. Hence, a pre-defined meteorological<br />
forecast will trigger a series <strong>of</strong> pre-defined actions, such<br />
as the broadcasts <strong>of</strong> <strong>health</strong> warnings, targeted care for<br />
vulnerable population groups, real-time surveillance<br />
<strong>and</strong> evaluation, <strong>and</strong> the preparation <strong>of</strong> the <strong>health</strong> <strong>and</strong><br />
social care services. Such systems provide accurate <strong>and</strong><br />
timely alerts <strong>and</strong> are also cost-effective as European <strong>and</strong><br />
North American experience shows. Broader use could<br />
be made <strong>of</strong> such actions in other regions <strong>of</strong> the world. 1,10<br />
Through observation <strong>and</strong> study <strong>of</strong> essential data recorded<br />
over years, meteorologists are also providing a clearer<br />
underst<strong>and</strong>ing <strong>of</strong> how the combination <strong>of</strong> energy use,<br />
changes in l<strong>and</strong> use <strong>and</strong> global warming are modifying<br />
the pattern <strong>of</strong> extreme temperatures over the long-term.<br />
Meteorological data provide essential inputs to develop<br />
<strong>climate</strong> scenarios, <strong>and</strong> allow verification <strong>of</strong> how weather<br />
eventually changes over time. Such information is critical<br />
to planning local <strong>health</strong> adaptation, <strong>and</strong> monitoring the<br />
progress <strong>of</strong> global <strong>climate</strong> change.<br />
ANDREY SMIRNOV, AFP / GETTY IMAGES<br />
Countries with<br />
operational heat-<strong>health</strong><br />
action plans<br />
National plans<br />
Sub national plans<br />
A large number <strong>of</strong> European countries now have<br />
operational heat-heath action plans 11<br />
42
Heat-wave<br />
probability (%)<br />
0%<br />
0.01 - 9.99%<br />
10.0 - 19.9%<br />
20.0 - 29.9%<br />
30.0 - 39.9%<br />
40.0 - 49.9%<br />
50.0 - 59.9%<br />
60.0 - 69.9%<br />
70.0 - 79.9%<br />
80.0 - 89.9%<br />
90.0 - 99.9%<br />
Temperature forecasts can be automatically converted into the probability <strong>of</strong> exceeding<br />
a pre-defined threshold for a heat wave 12<br />
Real-time<br />
surveillance system<br />
Historical data/<br />
experience<br />
Selection <strong>of</strong><br />
heat event definition<br />
Priority actors: <strong>Health</strong>,<br />
Local Government, social<br />
services, others.<br />
Weather forecast<br />
Warning criteria<br />
Alert<br />
Media<br />
No<br />
Criteria fulfilled<br />
Yes<br />
General public, vulnerable<br />
population groups<br />
The information generated by meteorological agencies needs to be connected to preventive actions<br />
by <strong>health</strong> <strong>and</strong> other sectors to form a heat-<strong>health</strong> action plan 13<br />
43
SECTION 3 | EMERGING ENVIRONMENTAL CHALLENGES<br />
UV RADIATION<br />
THE DANGERS OF THE SUN<br />
While small doses <strong>of</strong> ultraviolet (UV) radiation from the<br />
sun help the body produce vitamin D, excessive exposure<br />
is damaging to human <strong>health</strong>. Excessive exposure may<br />
have consequences ranging from premature ageing <strong>of</strong><br />
the skin to skin cancer. The number <strong>of</strong> cases <strong>of</strong> malignant<br />
melanoma has doubled every 7 to 8 years over the<br />
last 40 years – mostly due to a marked increase in the<br />
incidence <strong>of</strong> skin cancers in fair-skinned populations<br />
since the early 1970s. This is strongly associated with<br />
personal habits: the societal view is that a tan is desirable<br />
<strong>and</strong> <strong>health</strong>y. Children are most at risk, as exposure to<br />
the sun during childhood appears to set the stage for<br />
the development <strong>of</strong> skin cancer later in life.<br />
UV radiation can also severely damage the cornea, lens<br />
<strong>and</strong> retina <strong>of</strong> the human eye – long exposures can result<br />
in photo keratitis <strong>and</strong> a lifetime <strong>of</strong> cumulative exposure<br />
contributes to the risk <strong>of</strong> cataracts <strong>and</strong> other forms <strong>of</strong><br />
ocular damage. In addition to the above risks, a growing<br />
body <strong>of</strong> evidence suggests that levels <strong>of</strong> UV radiation<br />
in the environment may enhance the risk <strong>of</strong> infectious<br />
diseases <strong>and</strong> limit the efficacy <strong>of</strong> vaccinations.<br />
Melanoma incidence<br />
per 100,000 population<br />
< 0.4<br />
0.5 - 0.7<br />
0.8 - 1.5<br />
1.6 - 3.8<br />
3.9 - 36.7<br />
Data not available<br />
Not applicable<br />
Aggravating the situation is the hole in the ozone layer<br />
over Antarctica, which was discovered in 1985. Chlor<strong>of</strong>luorocarbons<br />
(CFCs), <strong>and</strong> other industrial chemicals<br />
released into the atmosphere, are destroying the stratospheric<br />
ozone, which shields the Earth from harmful<br />
UV radiation. That hole has now exp<strong>and</strong>ed to about<br />
25 million km 2 .<br />
ANDREAS G. KARELIAS / SHUTTERSTOCK.COM<br />
44
Estimated age-st<strong>and</strong>ardized incidence rate <strong>of</strong> melanoma, per 100,000 population 1<br />
300<br />
25<br />
250<br />
Age<br />
20<br />
rate per 100,000<br />
200<br />
150<br />
80+<br />
70-79<br />
60-69<br />
50-59<br />
40-49<br />
30-39<br />
20-29<br />
10-19<br />
0-9<br />
rate per 100,000<br />
15<br />
10<br />
Black : Male<br />
Black : Female<br />
Non-Hispanic White : Male<br />
Non-Hispanic White : Female<br />
100<br />
50<br />
5<br />
0<br />
0<br />
1983 1988 1993 1998<br />
year<br />
1973 1983 1993<br />
year<br />
Incidence rates <strong>of</strong> skin melanoma in Australia, for different age groups (left h<strong>and</strong> side)<br />
<strong>and</strong> Los Angeles, USA for different skin types (right h<strong>and</strong> side) 2<br />
45
ENJOYING THE SUN WISELY<br />
Awareness on how to behave in the sun is important for<br />
curbing the rapid increase in skin cancer observed in<br />
many populations. The Global Solar UV Index is a daily<br />
reminder to stay alert in the sun. It is a simple measure<br />
<strong>of</strong> the solar UV radiation level received at a particular<br />
time on the Earth’s surface <strong>and</strong> an indicator <strong>of</strong> the<br />
potential for skin damage. It was introduced in 1995 as<br />
a harmonized measure to monitor long-term changes in<br />
UV irradiation <strong>and</strong> UV spectrum on the Earth’s surface<br />
caused, for example, by ozone depletion.<br />
The UV Index also serves as a vehicle to raise public<br />
awareness <strong>and</strong> to alert people about the need to adopt<br />
protective measures when exposed to UV. It is reported<br />
along with the weather forecast during the summer<br />
months in many countries. Encouraging individuals<br />
to protect themselves – by seeking shade <strong>and</strong> wearing<br />
suitable clothes – remains the key to preventing the<br />
66 000 deaths from skin cancer every year.<br />
Environmental protection is also necessary. WMO <strong>and</strong><br />
UNEP played a leading role in setting up the 1985 Vienna<br />
Convention for the Protection <strong>of</strong> the Ozone Layer. The<br />
Montreal Protocol, signed in 1987, controls the use <strong>of</strong><br />
substances that could damage the ozone layer. WMO <strong>and</strong><br />
the scientific community monitor the development <strong>of</strong><br />
ozone worldwide by using meteorological data obtained<br />
from the ground, balloons, aircraft <strong>and</strong> satellites. With<br />
the prospect <strong>of</strong> global <strong>climate</strong> change compounding the<br />
skin cancer risk through systemic <strong>and</strong> unprecedented<br />
influences on stratospheric ozone, hopefully, the lessons<br />
learnt can help us meet even greater challenges<br />
to preserve our planet’s <strong>and</strong> our <strong>health</strong>.<br />
0 0.5 1.5 2.5 3.5<br />
Daily maximum <strong>of</strong> U<br />
THE BASIC SUN PROTECTION MESSAGES 3<br />
• Limit exposure during midday hours.<br />
• Seek shade.<br />
• Wear protective clothing.<br />
• Wear a broad-brimmed hat to protect the eyes, face <strong>and</strong> neck.<br />
• Protect the eyes with wrap-around-design sunglasses or sunglasses with side panels.<br />
• Use <strong>and</strong> reapply broad-spectrum sunscreen <strong>of</strong> sun protection factor (SPF) 15+ liberally.<br />
• Avoid tanning beds.<br />
• Protect babies <strong>and</strong> young children: this is particularly important.<br />
46
0 0.5 1.5 2.5 3.5 4.5 5.5 6.5 7.5 8.5 9.5 10.5 12.5 14.5 UVI<br />
4.5 5.5 6.5Daily maximum<br />
7.5<br />
<strong>of</strong> UV<br />
8.5Index cloudy,<br />
9.5<br />
15.08.12<br />
10.500:0012.5 UTC period=<br />
14.5<br />
+12 h<br />
UVI<br />
Global UV index under cloudy conditions<br />
V Index cloudy, 15.08.12 00:00 UTC period= 4<br />
+12 h<br />
How to read the SUNSMART UV ALERT<br />
UV INDEX<br />
20<br />
15<br />
11<br />
8<br />
6<br />
3<br />
EXTREME<br />
VERY HIGH<br />
HIGH<br />
MOD<br />
LOW<br />
UV Alert: 10.10 am to 3.30 pm<br />
MAX UV Index:<br />
9<br />
6am 8 10 12 2 4 6 8pm<br />
Example <strong>of</strong> Global UV index incorporating information on time <strong>of</strong> day 5<br />
WHO / DIARMID CAMPBELL-LENDRUM<br />
47
SECTION 3 | EMERGING ENVIRONMENTAL CHALLENGES<br />
POLLENS Ambrosia Pollen 2011<br />
none<br />
very low<br />
low<br />
medium<br />
high<br />
very high<br />
THE IMPACT OF NATURAL ALLERGENS<br />
WHO estimates that around 235 million people currently<br />
suffer from asthma worldwide. It is the most prevalent<br />
chronic childhood disease. Asthma can be caused by<br />
many factors, including poor air quality <strong>and</strong> the presence<br />
<strong>of</strong> strong airborne allergens. Asthma costs Europe an<br />
estimated 17.7 billion per year, including the cost <strong>of</strong> lost<br />
productivity estimated at €10 billion per year.<br />
The European Federation <strong>of</strong> Allergy <strong>and</strong> Airway Diseases<br />
Patients Associations estimates that 80 million (over<br />
24 per cent) adults living in Europe suffer from various<br />
allergies, while the prevalence in children is 30 – 40<br />
per cent <strong>and</strong> increasing. One <strong>of</strong> the most widespread<br />
types <strong>of</strong> allergies is related to the presence <strong>of</strong> allergenic<br />
pollen in air. Its seasonal outbreaks cause a quick rise<br />
<strong>of</strong> symptoms <strong>and</strong> an increase in the consumption <strong>of</strong><br />
antihistamines.<br />
The reasons for the increase in susceptibility to allergens,<br />
in particular to pollen allergens, remain elusive;<br />
however, environment <strong>and</strong> life-style factors appear to<br />
be the driving forces. Evidence shows that chemical<br />
air pollutants <strong>and</strong> anthropogenic aerosols can alter the<br />
impact <strong>of</strong> allergenic pollen by changing the amount<br />
<strong>and</strong> features <strong>of</strong> the allergens thereby simultaneously<br />
increasing human susceptibility to them.<br />
Climate change is also affecting natural allergens in<br />
several ways. Over most <strong>of</strong> Europe, the growing season<br />
<strong>of</strong> many trees <strong>and</strong> grasses starts earlier <strong>and</strong> lasts longer<br />
than 10 – 20 years ago. The total amount <strong>of</strong> pollen<br />
observed in the air is also growing, probably due to the<br />
interaction between changing l<strong>and</strong> use, temperature<br />
<strong>and</strong> CO 2<br />
concentrations, although how they correlate<br />
is not yet fully understood. However, experiments in<br />
<strong>climate</strong> chambers with controlled CO 2<br />
showed that pollen<br />
productivity <strong>of</strong> ragweed increases by 60 per cent when<br />
CO 2<br />
concentration is doubled.<br />
Annual observed ambrosia<br />
pollen count in 2011 1<br />
48
Pollen/m 3<br />
0 200 400 600 800 1000<br />
1 2 3 4 5 6<br />
mean maximum symptom score<br />
01jan2010 01apr2010 01jul2010 01oct2010 01jan2011<br />
date<br />
Pollen/m 3<br />
0 200 400 600 800 1000<br />
1 2 3 4 5 6<br />
Percentage <strong>of</strong> particpants using medication<br />
01jan2010 01apr2010 01jul2010 01oct2010 01jan2011<br />
date<br />
■ Birch ■ Hazel ■ Grass ■ Alder ■ Mugwort<br />
Correlation between the presence <strong>of</strong> several types <strong>of</strong> pollen<br />
in the air with allergy symptom score (upper panel) <strong>and</strong><br />
medication intensity (lower panel) in the Netherl<strong>and</strong>s 2<br />
49
MITIGATING THE IMPACT OF<br />
NATURAL ALLERGENS<br />
Pollen concentrations in air change strongly over time<br />
<strong>and</strong> space. A single plant usually pollinates only for<br />
a few hours or days, mainly releasing pollen during<br />
daytime, but pollen can remain suspended in air several<br />
tens <strong>of</strong> hours, causing allergy outbreaks far away from<br />
their source at any time <strong>of</strong> the day. However, pollen<br />
concentration decreases rapidly with distance from<br />
the source, so that a single tree in a garden can have<br />
stronger <strong>health</strong> impact than a large forest 10 km away.<br />
70N<br />
Aerobiological networks undertake systematic observations<br />
<strong>of</strong> pollen concentrations in many parts <strong>of</strong> the<br />
world. Modern atmospheric composition models can<br />
also forecast pollen distribution. This information, if<br />
available to allergic people, would allow for short-term<br />
adjustments <strong>of</strong> their planned outdoor activities <strong>and</strong>,<br />
possibly, application <strong>of</strong> pre-emptive medication, thus<br />
reducing the <strong>health</strong> impact.<br />
Cities where allergy prevalence has increased most,<br />
owing to chemical <strong>and</strong> aerosol air contamination <strong>and</strong>,<br />
possibly, to more aggressive pollen released by stressed<br />
plants, must pay particular attention to mitigation measures.<br />
The selection <strong>of</strong> low-allergenicity ornamental<br />
plants for streets <strong>and</strong> gardens can significantly reduce<br />
allergen exposure. The timely mowing <strong>of</strong> certain types<br />
<strong>of</strong> grass can prevent pollen release, thus almost completely<br />
eliminating the corresponding allergens from<br />
the air. These measures can significantly reduce allergy<br />
prevalence <strong>and</strong> improve the quality <strong>of</strong> life <strong>of</strong> a large<br />
fraction <strong>of</strong> the global population.<br />
65N<br />
60N<br />
55N<br />
50N<br />
45N<br />
40N<br />
35N<br />
30N<br />
15W 10W 5W<br />
SHUTTERSTOCK.COM<br />
50
CASE STUDY: RAGWEED<br />
More than 10 per cent <strong>of</strong> the German population suffers<br />
from pollinosis, <strong>and</strong> its prevalence is increasing. The<br />
main allergenic pollens are from hazelnut, birch, alder,<br />
grasses, rye <strong>and</strong> mugwort. The regionalized daily pollen<br />
forecast is based on the weather forecast <strong>of</strong> the Deutscher<br />
Wetterdienst (DWD, the German Weather Service),<br />
particularly on wind flow <strong>and</strong> precipitation, data from the<br />
50 pollen-measuring stations <strong>of</strong> the Foundation Pollen<br />
Information Service <strong>and</strong> on up-to-date phenological data.<br />
Forecast texts are automatically generated.<br />
0 5E 10E 15E 20E 25E 30E 35E 40E 45E<br />
0.1 1 5 10 25 50 100 500 1000<br />
Ragweed pollen concentration (grain / m 3 )<br />
72-hours-long ragweed forecast 3<br />
51
SECTION 3 | EMERGING ENVIRONMENTAL CHALLENGES<br />
AIR POLLUTION<br />
AIR POLLUTION: A GROWING GLOBAL PROBLEM<br />
Air pollution <strong>and</strong> <strong>climate</strong> change are closely linked. 1<br />
The greenhouse gas CO 2<br />
is the major cause <strong>of</strong> humaninduced<br />
<strong>climate</strong> change, <strong>and</strong> is emitted from the use<br />
<strong>of</strong> carbon-based fuels for power generation, transport,<br />
building <strong>and</strong> industry, <strong>and</strong> from household cooking <strong>and</strong><br />
heating. Additional <strong>climate</strong> change is caused by some<br />
<strong>of</strong> the air pollutants arising from inefficient use <strong>of</strong> these<br />
fuels. These include methane <strong>and</strong> carbon monoxide,<br />
which interact with other volatile organic pollutants<br />
in the environment to form ozone, as well as various<br />
forms <strong>of</strong> particulate matter such as black carbon. It is<br />
these non-CO 2<br />
air pollutants that also have direct <strong>and</strong><br />
sometimes severe consequences for <strong>health</strong>. For example,<br />
in 2008, exposure to unsafe levels <strong>of</strong> outdoor air pollution<br />
in the form <strong>of</strong> fine particulate matter (PM 10<br />
) accounted<br />
for 1.3 million premature deaths in urban areas. 2 This<br />
is a major concern as urban population is rising – from<br />
50 per cent <strong>of</strong> the world’s total population today, it is<br />
expected to reach 70 per cent by 2050.<br />
% <strong>of</strong> total<br />
childhood mortality<br />
10<br />
Data not available<br />
Not applicable<br />
Air pollution in <strong>and</strong> around the home carries an even<br />
heavier disease burden. Close to two million premature<br />
deaths annually, mostly in women <strong>and</strong> children in developing<br />
countries, are attributed to household air pollution<br />
due to the inefficient use <strong>of</strong> solid fuels for cooking. 3<br />
Controlling air pollution through improvements in both<br />
the efficiency <strong>and</strong> renewability <strong>of</strong> energy supplies <strong>and</strong><br />
use, as well as monitoring <strong>and</strong> modelling air quality,<br />
holds substantial benefits now <strong>and</strong> in the future for both<br />
<strong>health</strong> <strong>and</strong> <strong>climate</strong>. 4<br />
WHO<br />
52
Approximately 677 000 deaths in children under five each year (over 8% <strong>of</strong> the global total)<br />
are due to pneumonia caused by household air pollution 5<br />
77% 14% 35% 7% 61% 46%<br />
■ Africa ■ Americas ■ Eastern Mediterranean ■ Europe ■ South-East Asia ■ Western Pacific<br />
160<br />
140<br />
120<br />
µg/m3<br />
100<br />
80<br />
60<br />
40<br />
91 µg/m 3<br />
36 µg/m 3 141 µg/m 3 34 µg/m 3 52 µg/m 3 81 µg/m 3<br />
WHO Air<br />
Quality<br />
Guideline Value<br />
20<br />
0<br />
Regional means <strong>of</strong> percentage <strong>of</strong> population using solid fuels (pie charts), <strong>and</strong> annual mean<br />
urban air pollution levels (bar charts), by WHO region 6<br />
53
DEALING WITH AIR POLLUTION<br />
Better use <strong>of</strong> available technologies, policies <strong>and</strong> measures<br />
to reduce short-lived air pollutants could generate<br />
immediate, significant benefits in human well-being,<br />
the <strong>climate</strong> system <strong>and</strong> the environment. 7 For example,<br />
switching to cleaner <strong>and</strong> more efficient energy sources<br />
can markedly reduce the level <strong>of</strong> <strong>climate</strong>-changing pollutants<br />
released from millions <strong>of</strong> households as well as<br />
improve <strong>health</strong>. 8<br />
Globally around 2.8 billion people 9 rely on solid fuels for<br />
cooking, <strong>of</strong>ten using rudimentary stoves or open fires<br />
that generate high levels <strong>of</strong> short-lived pollutants that<br />
are harmful to the environment <strong>and</strong> <strong>health</strong>. 10 The risks<br />
<strong>of</strong> respiratory <strong>and</strong> cardiovascular diseases, cataract<br />
formation <strong>and</strong> various cancers are in particular increased.<br />
Replacing rudimentary stoves globally with cleaner<br />
technologies such as advanced combustion stoves could<br />
avert over 8 per cent <strong>of</strong> all childhood mortality annually. 11<br />
WHO tracks the use <strong>of</strong> polluting fuels <strong>and</strong> technologies,<br />
<strong>and</strong> their <strong>health</strong> impacts, <strong>and</strong> monitors the <strong>health</strong> benefits<br />
from shifts to less polluting alternatives. Together with<br />
WHO’s Air Quality Guidelines, 12 these resources support<br />
policies <strong>and</strong> interventions for improving air quality <strong>and</strong><br />
<strong>health</strong>. The WMO – through its Members – gathers,<br />
disseminates <strong>and</strong> assesses information on the chemical<br />
composition <strong>of</strong> the atmosphere <strong>and</strong> its relation to <strong>climate</strong><br />
change <strong>and</strong> to air pollution. 13 Capacity development for<br />
air quality modelling <strong>and</strong> forecasting services provides<br />
authorities with information to take appropriate actions<br />
to avert <strong>health</strong> risks. 14 The evidence-based knowledge<br />
provided by WHO <strong>and</strong> WMO is used for the design <strong>and</strong><br />
implementation <strong>of</strong> effective policies <strong>and</strong> interventions.<br />
0.5 1 2<br />
WHO<br />
54
0.5 1 2 5 10 20 50<br />
Global Black Carbon Emissions from combustion, in Gigagrams (Gg). This includes emissions from fossil<br />
fuels <strong>and</strong> bi<strong>of</strong>uels such as household biomass (i.e. wood, charcoal, dung, crop waste) used for cooking 15<br />
5 10 20 50<br />
600<br />
400<br />
200<br />
-158<br />
78<br />
84<br />
199<br />
132<br />
Carbon Dioxide<br />
Nitrous Oxide<br />
Methane*<br />
0<br />
Aerosol Indirect Effect<br />
Organic Carbon<br />
-200<br />
Black Carbon<br />
Nitrate<br />
-400<br />
Sulfate<br />
Ozone**<br />
-600<br />
Industry<br />
Power<br />
HH Fossil<br />
Fuel Use<br />
On-road<br />
transport<br />
HH Biomass<br />
Use<br />
Expected contributions <strong>of</strong> different sectors to Radiative Forcing (warming effect) by 2020. Interventions to<br />
reduce black carbon in transport <strong>and</strong> household (HH) energy sectors also have substantial potential for<br />
<strong>climate</strong> change mitigation 16<br />
55
56<br />
SHUTTERSTOCK.COM
ACKNOWLEDGEMENTS<br />
EDITORIAL AND PRODUCTION TEAM<br />
Jonathan Abrahams (WHO)<br />
Diarmid Campbell-Lendrum (WHO)<br />
Haleh Kootval (WMO)<br />
Ge<strong>of</strong>frey Love (WMO)<br />
Mariam Otmani del Barrio (WHO)<br />
GIS PRODUCTION<br />
Steeve Ebener (Gaia GeoSystems)<br />
EDITOR<br />
Sylvie Castonguay (WMO)<br />
AUTHORS<br />
Malaria<br />
Steve Connor<br />
Diarrhoea<br />
Rifat Hossain<br />
Meningitis<br />
Emily Firth<br />
Stéphane Hugonnet<br />
Dengue<br />
Raman Velayudhan<br />
Diarmid Campbell-Lendrum<br />
Floods <strong>and</strong> cyclones<br />
Jonathan Abrahams<br />
Ashton Barnett-Vanes<br />
Ge<strong>of</strong>f Love<br />
Jennifer Post<br />
Drought<br />
Jonathan Abrahams<br />
Ashton Barnett-Vanes<br />
Jennifer Post<br />
Airborne dispersion <strong>of</strong> hazardous materials<br />
Jonathan Abrahams<br />
Ashton Barnett-Vanes<br />
Jennifer Post<br />
Heat stress<br />
Diarmid Campbell-Lendrum<br />
Mariam Otmani del Barrio<br />
Bettina Menne<br />
UV radiation<br />
Emilie van Deventer<br />
Air pollution<br />
Heather Adair-Rohani<br />
Annette Pruss-Ustün<br />
Sophie Bonjour<br />
Liisa Jalkanen<br />
Pollen<br />
Mikhail S<strong>of</strong>iev<br />
Uwe Berger<br />
Siegfried Jaeger<br />
Letty De Weger<br />
We extend our gratitude to the following for<br />
contribution <strong>of</strong> data <strong>and</strong> images:<br />
Malaria<br />
Peter Gething, Simon Hay, Jane Messina<br />
Diarrhoea<br />
Karolin Eichler, Omar Baddour, Juli Trtanj, Antarpreet<br />
Jutla, Cary Lopez, Claire-Lise Chaignat<br />
Meningitis<br />
Rajul P<strong>and</strong>ya, Thomas Hopson, Madeleine Thomson,<br />
Pascal Yaka, Sara Basart, Slobodan Nickovic, Ge<strong>of</strong>f<br />
Love, Carlos Perez, John del Corral<br />
57
Dengue<br />
Oliver Brady, Simon Hay, Jane Messina, Joshua Nealon,<br />
Chantha Ngan, Huy Rekol, Sorany Luch<br />
Floods <strong>and</strong> cyclones<br />
Ellen Egan, Ariel Anwar, Omar Baddour, Karolin Eichler,<br />
Qudsia Huda, Jorge Martinez, Robert Stefanski, Ge<strong>of</strong>f<br />
Stewart, Jeff Wilson<br />
Drought<br />
Stella Anyangwe, Monika Bloessner, Cynthia Boschi<br />
Pinto, Michael Budde, Karolin Eichler, Chantal Gegout,<br />
Andre Griekspoor, Ge<strong>of</strong>f Love, Robert Stefanski<br />
Airborne dispersion <strong>of</strong> hazardous materials<br />
Zhanat Carr, Wayne Elliott, Kersten Gutschmidt, Liisa<br />
Jalkanen, Virginia Murray, Robert Stefanski, Helen Webster<br />
Heat stress<br />
Christina Koppe-Schaller, Tanja Wolf, Carsten Iversen,<br />
Hans-Martin Füssel<br />
UV radiation<br />
Craig Sinclair, Jacques Ferlay, Isabelle Soerjomataram,<br />
Matthieu Boniol, Adèle Green, Liisa Jalkanen<br />
Air pollution<br />
Tami Bond<br />
Pollen<br />
Karl Christian-Bergmann<br />
We extend our gratitude to the following for<br />
review comments:<br />
Jochen Bläsing, Pietro Ceccato, Carlos Corvalan, Frank<br />
Dentener, Kristie L. Ebi , Simon Hales, Uwe Kaminski, Sari<br />
Kovats , Qiyong Liu, Tony McMichael, Mazen Malkawi,<br />
Gilma Mantilla, Franziska Matthies, Virginia Murray,<br />
Helfried Scheifinger, Madeleine Thomson.<br />
58
NOTES AND REFERENCES<br />
Malaria<br />
1. <strong>World</strong> <strong>Health</strong> <strong>Organization</strong>, 2011. <strong>World</strong> Malaria<br />
Report. Geneva: <strong>World</strong> <strong>Health</strong> <strong>Organization</strong>.<br />
2. Methods described in Gething, P.W. <strong>and</strong> others 2011.<br />
Modelling the global constraints <strong>of</strong> temperature on<br />
transmission <strong>of</strong> Plasmodium falciparum <strong>and</strong> P. vivax.<br />
Parasites & vectors; 4: 92. Data source: Peter Gething,<br />
Oxford University. Map production: WHO-WMO.<br />
Copyright: WHO-WMO.<br />
3. <strong>World</strong> <strong>Health</strong> <strong>Organization</strong>, 2012. Global <strong>Health</strong><br />
Observatory. Available from: http://www.who.int/<br />
gho/child_<strong>health</strong>/mortality/causes/en/index.html/.<br />
Comparison between the two maps provides insight<br />
into the extent <strong>of</strong> control success over the past<br />
century. Data source: WHO. Map production: WHO-<br />
WMO. Copyright: WHO-WMO.<br />
4. Grover-Kopec, E.K. <strong>and</strong> others, 2006. Web-based<br />
<strong>climate</strong> information resources for malaria control<br />
in Africa. Malaria Journal; 5: 38.<br />
5. Thomson, M.C. <strong>and</strong> others, 2006. Malaria early<br />
warnings based on seasonal <strong>climate</strong> forecasts from<br />
multi-model ensembles. Nature; 439(7076): 576-9.<br />
6. Dinku, T. <strong>and</strong> others, 2011. Improving availability, access<br />
<strong>and</strong> use <strong>of</strong> <strong>climate</strong> information. WMO Bulletin 60(2).<br />
7. DaSilva, J. <strong>and</strong> others, 2004. Improving epidemic<br />
malaria planning, preparedness <strong>and</strong> response in<br />
Southern Africa. Malaria Journal; 3(1): 37.<br />
8. Ghebreyesus, T.A. <strong>and</strong> others, 2008. Public <strong>health</strong><br />
<strong>and</strong> weather services-Climate information for the<br />
<strong>health</strong> sector. WMO Bulletin 57(4 ): 257.<br />
9. Enhanced CSMT using local data supplied by the<br />
Ethiopian NMHS. http://iridl.ldeo.columbia.edu/<br />
expert/home/.remic/.maproom/.NMA/.Regional/.<br />
Climate_<strong>and</strong>_<strong>Health</strong>/. Production <strong>and</strong> copyright <strong>of</strong><br />
Ethiopia map : WHO, http://www.who.int/countries/<br />
eth/en/<br />
10. Continental Map <strong>of</strong> Climate Suitability for Malaria<br />
Transmission in Africa shows the number <strong>of</strong> months<br />
where the combination <strong>of</strong> temperature, rainfall <strong>and</strong><br />
humidity are considered sufficient to support malaria<br />
transmission. http://iridl.ldeo.columbia.edu/maproom/.<strong>Health</strong>/.Regional/.Africa/.Malaria/.CSMT.<br />
Data<br />
source: Steven Connor, University <strong>of</strong> Columbia. Map<br />
production: WHO-WMO. Copyright: WHO-WMO.<br />
Diarrhoea<br />
1. JMP biennial report (www.wssinfo.org): Progress on<br />
Drinking water <strong>and</strong> Sanitation, 2012 update, UNICEF<br />
<strong>and</strong> WHO, New York <strong>and</strong> Geneva 2012.<br />
2. Data sources: WHO <strong>and</strong> NOAA as follows:<br />
a. Access to water <strong>and</strong> sanitation: average <strong>of</strong> the<br />
percentages for improved water <strong>and</strong> improved sanitation<br />
as published by WHO/UNICEF Joint Monitoring<br />
Programme for Water supply <strong>and</strong> Sanitation. For<br />
definition <strong>of</strong> improved water <strong>and</strong> sanitation <strong>and</strong> data<br />
see: Progress on Drinking water <strong>and</strong> Sanitation, 2012<br />
update, UNICEF <strong>and</strong> WHO, New York <strong>and</strong> Geneva 2012.<br />
b. Cholera cases (in logarithmic scale): as reported<br />
by WHO member states, extracted from WHO Global<br />
<strong>Health</strong> Observatory (June 2012): http://www.who.<br />
int/gho/en/, Countries showing no cholera case<br />
incidence are not necessarily not having cholera<br />
but not reported by the countries.<br />
c. Precipitation anomaly: these calculated by subtracting<br />
annual means <strong>and</strong> dividing by st<strong>and</strong>ard<br />
deviation. For example a value for Jan 2010 is calculated<br />
by subtracting 60-year mean <strong>and</strong> st<strong>and</strong>ard<br />
deviation <strong>of</strong> the month. Data source NOAA precl 2.5<br />
x2.5, Time period 1950-2010.<br />
Map production <strong>and</strong> copyright: WHO-WMO<br />
59
3. Onda et al, 2012 http://www.mdpi.com/1660-<br />
4601/9/3/880/pdf<br />
4. This work is possible with generous support from US<br />
National Oceanic <strong>and</strong> Atmospheric Administration<br />
to WHO project GIMS.<br />
Meningitis<br />
1. Colombini, A. <strong>and</strong> others, 2009. Costs for households<br />
<strong>and</strong> community perception <strong>of</strong> meningitis epidemics<br />
in Burkina Faso. Clinical Infectious Diseases;<br />
49(10):1520-5.<br />
2. Epidemiological data: WHO African Sub-Regional<br />
Office, Intercountry Support Team West Africa,<br />
Ouagadougou Burkina Faso. Climate data: Ge<strong>of</strong>f<br />
Love, <strong>World</strong> Meteorological <strong>Organization</strong>.<br />
3. Data source: Earth Sciences Department, Barcelona<br />
Supercomputing Center-Centro Nacional de Supercomputación<br />
(BSC-CNS), Spain. Map production<br />
<strong>and</strong> copyright: WHO-WMO.<br />
4. Source, map production <strong>and</strong> copyright: WHO-WMO.<br />
5. Source: WHO African Sub-Regional Office, Intercountry<br />
Support Team West Africa, Ouagadougou<br />
Burkina Faso.<br />
6. The development <strong>of</strong> the meningitis A conjugate vaccine<br />
was achieved through a successful partnership<br />
lead by the “Meningitis vaccine Project” (http://<br />
www.meningvax.org/).<br />
7. Source: Adapted from Yaka, P. <strong>and</strong> others, 2008. For<br />
further information please see Relationships between<br />
<strong>climate</strong> <strong>and</strong> year-to-year variability in meningitis<br />
outbreaks: a case study in Burkina Faso <strong>and</strong> Niger.<br />
International Journal <strong>of</strong> <strong>Health</strong> Geography; 7:34.<br />
8. Source, map production <strong>and</strong> copyright: WHO-WMO<br />
9. Leake, JA. <strong>and</strong> others, 2002. Early detection <strong>and</strong><br />
response to meningococcal disease epidemics in<br />
sub-Saharan Africa: appraisal <strong>of</strong> the WHO strategy.<br />
Bulletin <strong>of</strong> the <strong>World</strong> <strong>Health</strong> <strong>Organization</strong>; 80 (5):<br />
342-9.<br />
Dengue fever<br />
1. Methods described in Simmons, C.P. <strong>and</strong> others,<br />
2012. Dengue. New Engl<strong>and</strong> Journal <strong>of</strong> Medicine;<br />
366(15): 1423-32.<br />
2. <strong>World</strong> <strong>Health</strong> <strong>Organization</strong> 2012. Global strategy for<br />
dengue prevention <strong>and</strong> control, 2012–2020. Geneva,<br />
<strong>World</strong> <strong>Health</strong> <strong>Organization</strong>.<br />
3. Van Kleef, E., Bambrick, H., Hales, S. 2010. The geographic<br />
distribution <strong>of</strong> dengue fever <strong>and</strong> the potential<br />
influence <strong>of</strong> global <strong>climate</strong> change. TropIKAnet.<br />
4. Methods described in Brady, O.J. <strong>and</strong> others 2012.<br />
Refining the global spatial limits <strong>of</strong> dengue virus<br />
transmission by evidence-based consensus. Public<br />
Library <strong>of</strong> Science neglected tropical diseases.6(8):<br />
e1760. Data source: Oliver Brady, Oxford University.<br />
Map production <strong>and</strong> copyright: WHO-WMO.<br />
5. Adapted from Arunachalam, N. <strong>and</strong> others 2010. Ecobio-social<br />
determinants <strong>of</strong> dengue vector breeding:<br />
a multicountry study in urban <strong>and</strong> periurban Asia.<br />
Bulletin <strong>of</strong> the <strong>World</strong> <strong>Health</strong> <strong>Organization</strong>; 88(3):<br />
173-84.<br />
6. Data source: Simon Hay, Oxford University. Map<br />
production : WHO-WMO, Copyright: Massachusetts<br />
Medical Society (2012). Reprinted with permission<br />
from Massachusetts Medical Society.<br />
7. Data supplied by Ministry <strong>of</strong> <strong>Health</strong> <strong>and</strong> Ministry<br />
<strong>of</strong> Water Resources <strong>and</strong> Meteorology, Kingdom <strong>of</strong><br />
Cambodia.<br />
Emergencies introduction<br />
1. Centre for Research on the Epidemiology <strong>of</strong> Disasters<br />
(CRED) ( 2012): Annual disaster statistical review<br />
2011: the numbers <strong>and</strong> trends, Université Catholique<br />
de Louvain, Brussels. http://www.emdat.be<br />
2. <strong>World</strong> <strong>Health</strong> <strong>Organization</strong> <strong>and</strong> others (2009): WHO/<br />
International Strategy for Disaster Reduction thematic<br />
platform on disaster risk reduction for <strong>health</strong>, WHO.<br />
http://www.who.int/hac/events/thematic_platfom_<br />
risk_reduction_<strong>health</strong>_12oct09.pdf<br />
3. UNISDR-United Nations Office for Disaster Risk<br />
Reduction <strong>and</strong> others (2011): Global Assessment<br />
Report for Disaster Risk Reduction 2011, UNISDR.<br />
http://www.preventionweb.net/english/hyogo/<br />
gar/2011/en/home/index.html<br />
4. Hsiang S.M. <strong>and</strong> others (2011): Civil conflicts are associated<br />
with the global <strong>climate</strong>. Nature 476: 438–441.<br />
5. UNISDR-United Nations Office for Disaster Risk<br />
Reduction (2011): Chair’s Summary Third Session <strong>of</strong><br />
60
the Global Platform for Disaster Risk Reduction <strong>and</strong><br />
<strong>World</strong> Reconstruction Conference Geneva, 8-13 May<br />
2011, UNISDR. http://www.unisdr.org/we/inform/<br />
publications/19947.<br />
Floods <strong>and</strong> cyclones<br />
1. Inter-Agency St<strong>and</strong>ing Committee (IASC) (2007):<br />
IASC Guidelines on Mental <strong>Health</strong> <strong>and</strong> Psychological<br />
Support in Emergency Settings, IASC. www.who.int/<br />
entity/mental_<strong>health</strong>/emergencies/IASC_guidelines.<br />
pdf<br />
2. <strong>World</strong> <strong>Health</strong> <strong>Organization</strong> (2009): Save Lives, Make<br />
Hospitals Safe in Emergencies, WHO. http://www.who.<br />
int/world-<strong>health</strong>-day/2009/whd2009_brochure_en.pdf<br />
3. <strong>World</strong> <strong>Health</strong> <strong>Organization</strong> & United Kingdom <strong>Health</strong><br />
Protection Agency (2011): Disaster Risk Management<br />
for <strong>Health</strong>: Climate Risk Management Factsheet,<br />
WHO. http://www.who.int/hac/events/drm_fact_<strong>climate</strong>_risk_management.pdf<br />
4. <strong>World</strong> <strong>Health</strong> <strong>Organization</strong> Regional Office for<br />
Southeast Asia WHO-SEARO (2010): Community<br />
Resilience in Disasters, WHO. (http://www.searo.<br />
who.int/LinkFiles/EHA_CRD.pdf)<br />
5. Data source: National Oceanic <strong>and</strong> Atmospheric<br />
Administration (NOAA). Map production <strong>and</strong> copyright:<br />
WHO-WMO.<br />
6. Source, production <strong>and</strong> copyright: Intergovernmental<br />
Panel on Climate Change (IPCC), 2012. Managing<br />
the risks <strong>of</strong> extreme events <strong>and</strong> disasters to advance<br />
<strong>climate</strong> change adaptation. Special report <strong>of</strong> Working<br />
Groups I <strong>and</strong> II <strong>of</strong> the Intergovernmental Panel<br />
on Climate Change. Cambridge, UK <strong>and</strong> New York,<br />
USA: Cambridge University Press.<br />
7. UNISDR-United Nations Office for Disaster Risk<br />
Reduction <strong>and</strong> others (2009): Hospitals Safe from<br />
Disasters, UNISDR (http://www.unisdr.org/2009/<br />
campaign/pdf/wdrc-2008-2009-information-kit.pdf).<br />
8. Data source: NOAA International Best Track Archive<br />
for Climate Stewardship (IBTrACS). Map production<br />
<strong>and</strong> copyright: WHO-WMO.<br />
9. <strong>World</strong> <strong>Health</strong> <strong>Organization</strong> (2010): WHO Response<br />
to the Pakistan Floods in 2010, WHO.<br />
10. <strong>World</strong> <strong>Health</strong> <strong>Organization</strong> (2008): WHO e-atlas <strong>of</strong><br />
disaster risk for the Eastern Mediterranean Region:<br />
http://www.who-eatlas.org/eastern-mediterranean/.<br />
Data source: WHO, MoH Pakistan. Map production<br />
<strong>and</strong> copyright: WHO-WMO.<br />
11. <strong>World</strong> <strong>Health</strong> <strong>Organization</strong> Country Office for Pakistan<br />
(WHO-Pakistan) (2011): <strong>Health</strong> e-<strong>Atlas</strong>: Pakistan<br />
Floods 2010-2011, Volume 1. Data source: WHO,<br />
MoH Pakistan. Map production <strong>and</strong> copyright:<br />
WHO-WMO.<br />
12. <strong>World</strong> <strong>Health</strong> <strong>Organization</strong> (2008): WHO e-atlas <strong>of</strong><br />
disaster risk for the Eastern Mediterranean Region:<br />
http://www.who-eatlas.org/eastern-mediterranean/.<br />
Data source: WHO, MoH Pakistan. Map production<br />
<strong>and</strong> copyright: WHO-WMO.<br />
Drought<br />
1. <strong>World</strong> <strong>Health</strong> <strong>Organization</strong>, Drought technical hazard<br />
sheet (accessed September 2012): http://www.who.<br />
int/hac/techguidance/ems/drought/en/<br />
2. UNISDR-United Nations Office for Disaster Risk<br />
Reduction (2011): Global Assessment Report on<br />
Disaster Risk Reduction 2011, UNISDR. http://www.<br />
preventionweb.net/english/hyogo/gar/2011/en/<br />
home/index.html<br />
3. <strong>World</strong> <strong>Health</strong> <strong>Organization</strong> (2012):<strong>World</strong> <strong>Health</strong><br />
Statistics 2012, WHO. http://www.who.int/gho/<br />
publications/world_<strong>health</strong>_statistics/2012/en/<br />
4. Data source: National Oceanic <strong>and</strong> Atmospheric<br />
Administration (NOAA). Map production <strong>and</strong> copyright:<br />
WHO-WMO.<br />
5. Liu L. <strong>and</strong> others (2012). Global, regional, <strong>and</strong> national<br />
causes <strong>of</strong> child mortality: an updated systematic<br />
analysis for 2010 with time trends since 2000. Lancet<br />
379:2151-61.<br />
6. <strong>World</strong> <strong>Health</strong> <strong>Organization</strong>, Global <strong>Health</strong> Observatory<br />
http://www.who.int/gho/mdg/poverty_hunger/<br />
underweight/en/index.html (accessed October 2012.)<br />
Data source WHO. Map production <strong>and</strong> copyright<br />
WHO/WMO.<br />
7. Interagency St<strong>and</strong>ing Committee (2012): IASC<br />
Real-Time Evaluation <strong>of</strong> the Humanitarian Response<br />
to the Horn <strong>of</strong> Africa Drought Crisis in Somalia,<br />
Ethiopia <strong>and</strong> Kenya - Synthesis Report, IASC.<br />
http://reliefweb.int/report/somalia/iasc-real-timeevaluation-humanitarian-response-horn-africadrought-crisis-somalia<br />
61
8. Sida H <strong>and</strong> Darcy J. (2012): East Africa Crisis Appeal:<br />
Ethiopia real-time evaluation report, Disasters Emergency<br />
Committee.<br />
9. Kenya Red Cross Society (accessed October 2012):<br />
Food Security Projects in Tana River, Kenya Red<br />
Cross Society. https://www.kenyaredcross.org/<br />
index.phpoption=com_content&view=article&id<br />
=326&Itemid=124<br />
10. Office for the Coordination <strong>of</strong> Humanitarian Assistance<br />
(OCHA) (2012): Special Humanitarian Bulletin:<br />
Sahel Food Security <strong>and</strong> Nutrition Crisis, 15 June<br />
2012, OCHA.<br />
11. Food Security <strong>and</strong> Nutrition Working Group (Central<br />
<strong>and</strong> Eastern Africa) (2010): FSNWG Update Central<br />
<strong>and</strong> Eastern Africa, October 2010, FSNWG. Data<br />
source: IGAD Climate Prediction <strong>and</strong> Application<br />
Centre (ICPAC) Update Central & Eastern Africa<br />
October 2010. Map production <strong>and</strong> copyright: WHO-<br />
WMO.<br />
12. Adapted from Panafrican Training Centre <strong>and</strong> <strong>World</strong><br />
<strong>Health</strong> <strong>Organization</strong> (1998): Drought <strong>and</strong> the <strong>Health</strong><br />
Sector. Unpublished. WHO<br />
13. Office for the Coordination <strong>of</strong> Humanitarian Affairs<br />
(OCHA) (2012): Special Humanitarian Bulletin: Sahel<br />
Food Security <strong>and</strong> Nutrition Crisis, 15 June 2012,<br />
OCHA.<br />
14. Data source: Famine Early Warning Systems Network,<br />
(accessed September 2012), http://sahelresponse.<br />
org. Map production <strong>and</strong> copyright: WHO-WMO.<br />
15. Data source: United States Geological Survey<br />
(USGS) crop water balance model, data provided<br />
by the US Agency for International Development<br />
(USAID)-funded Famine Early Warning Systems<br />
Network (FEWS NET) program. Water requirement<br />
satisfaction index – WRSI. Defining drought as end<br />
<strong>of</strong> season WRSI value < 80. The model uses satellite<br />
rainfall <strong>and</strong> crop water use coefficients to model<br />
the degree to which specific crop water needs are<br />
being met. WRSI values are provided as percent<br />
<strong>of</strong> the requirement met with < 50 being failure <strong>and</strong><br />
100 being excellent crop growing conditions. Map<br />
production: WHO-WMO. Public domain.<br />
Airborne Dispersion <strong>of</strong> Hazardous Materials<br />
1. <strong>World</strong> Meteorological <strong>Organization</strong> (2006): Environmental<br />
Emergency response WMO activities. WMO<br />
ftp://ftp.wmo.int/Documents/PublicWeb/www/era/<br />
ERA-WMO_Bulletin_Jan2006.pdf<br />
2. <strong>World</strong> Meteorological <strong>Organization</strong> (2004): Working<br />
together for a safer world, WMO. http://www.wmo.int/<br />
pages/prog/www/WIS/Publications/WMO976e.pdf<br />
3. <strong>World</strong> <strong>Health</strong> <strong>Organization</strong> (2007): <strong>World</strong> <strong>Health</strong><br />
Report 2007: A safer future: global public <strong>health</strong><br />
security in the 21st century, WHO. http://www.who.<br />
int/whr/2007/07_chap2_en.pdf<br />
4. Source: NASA. Map production: NASA. Public<br />
domain. http://earthobservatory.nasa.gov/IOTD/<br />
view.phpid=1260<br />
5. Fire maps created by Jacques Descloitres. Fire<br />
detection algorithm developed by Louis Giglio. Blue<br />
Marble background image created by Reto Stokli.<br />
Data source: NASA FIRMS MODIS Rapid Response<br />
System. Map production: NASA/GSFC, MODIS Rapid<br />
Response. Public domain.<br />
6. The Chernobyl Forum (2006): Chernobyl’s Legacy:<br />
<strong>Health</strong>, Environmental <strong>and</strong> Socio-Economic Impacts<br />
<strong>and</strong> Recommendations to the Governments <strong>of</strong><br />
Belarus, the Russian Federation <strong>and</strong> Ukraine Second<br />
revised version. The Chernobyl Forum.<br />
7. IAEA, after Jacob, P. <strong>and</strong> others (2006): Thyroid cancer<br />
among Ukrainians <strong>and</strong> Belarusians who were children<br />
or adolescents at the time <strong>of</strong> the Chernobyl accident.<br />
Journal <strong>of</strong> Radiation Protection Mar; 26(1):51-67.<br />
8. Data Source: United Kingdom Meteorological Office<br />
(UK MET)(2012). Map production: UK MET. Copyright:<br />
Contains Ordnance Survey data © Crown copyright<br />
<strong>and</strong> database right.<br />
9. <strong>Health</strong> Protection Agency (2006): The Public <strong>Health</strong><br />
Impact <strong>of</strong> the Buncefield Fire, HPA, United Kingdom<br />
http://www.hpa.org.uk/webc/HPAwebFile/<br />
HPAweb_C/1194947375551<br />
Heat stress<br />
1. <strong>World</strong> <strong>Health</strong> <strong>Organization</strong> Regional Office for Europe<br />
(WHO-EURO), 2008: Heat <strong>Health</strong> Action Plans. Copenhagen,<br />
WHO Regional Office for Europe.<br />
2. Kjellstrom, T. <strong>and</strong> others, 2008: Workplace heat stress,<br />
<strong>health</strong> <strong>and</strong> productivity - an increasing challenge for<br />
low <strong>and</strong> middle-income countries during <strong>climate</strong><br />
change. Global <strong>health</strong> action; 2.<br />
62
3. D’Ippoliti, D. <strong>and</strong> others, 2010: The impact <strong>of</strong> heat<br />
waves on mortality in 9 European cities: results from<br />
the EuroHEAT project. Environmental <strong>Health</strong>; 9: 37.<br />
4. Robine, J.M. <strong>and</strong> others , 2008: Death toll exceeded<br />
70,000 in Europe during the summer <strong>of</strong> 2003. Comptes<br />
Rendus Biologies; 331(2): 171-8.<br />
5. Witte, J.C. <strong>and</strong> others, 2011. NASA A-Train <strong>and</strong> Terra<br />
observations <strong>of</strong> the 2010 Russian wildfires. Atmospheric<br />
Chemistry <strong>and</strong> Physics; 11(17): 9287-301.<br />
6. Intergovernmental Panel on Climate Change (IPCC),<br />
2012. Managing the risks <strong>of</strong> extreme events <strong>and</strong><br />
disasters to advance <strong>climate</strong> change adaptation.<br />
Special report <strong>of</strong> Working Groups I <strong>and</strong> II <strong>of</strong> the Intergovernmental<br />
Panel on Climate Change. Cambridge,<br />
UK <strong>and</strong> New York, USA: Cambridge University Press.<br />
7. Population estimates for the map “Increasingly<br />
frequent heatwaves will combine with growing<br />
vulnerable populations “ <strong>and</strong> Figure “Older people<br />
living in cities are at particular risk” are based on<br />
estimates (2010), <strong>and</strong> projections (2050) for age<br />
specific population sizes at national level, multiplied<br />
by national urbanization rates, all from the<br />
UN Population Division. http://www.un.org/esa/<br />
population/. Regional aggregations for the figure<br />
are based on WHO regions - see WHO 2012, <strong>World</strong><br />
<strong>Health</strong> Report. Geneva, <strong>World</strong> <strong>Health</strong> <strong>Organization</strong>.<br />
http://www.who.int/whr/en/.<br />
8. Bar charts show results for 3 different “SRES”<br />
scenarios, as described in the IPCC Special Report<br />
on Emissions Scenarios, <strong>and</strong> based on 12 global<br />
<strong>climate</strong> models. Coloured boxes show range in<br />
which 50% <strong>of</strong> the model projections are contained,<br />
<strong>and</strong> whiskers show the maximum <strong>and</strong> minimum<br />
projections from all models. See reference 6 for<br />
more details. Data source: IPCC <strong>and</strong> UN population<br />
division. Map production: WHO-WMO. Copyright:<br />
WHO-WMO.<br />
9. Reproduced based on data in European Environment<br />
Agency (2009): Number <strong>of</strong> reported deaths<br />
<strong>and</strong> minimum <strong>and</strong> maximum temperature in Paris<br />
during the heatwave in summer 2003. http://www.<br />
eea.europa.eu/data-<strong>and</strong>-maps/figures/. Created:<br />
Nov 12, 2009. Accessed 15th October 2012.<br />
10. Ebi, K.L. <strong>and</strong> others, 2004. Heat watch/warning<br />
systems save lives - Estimated costs <strong>and</strong> benefits<br />
for Philadelphia 1995-98. Bulletin <strong>of</strong> the American<br />
Meteorological Society; 85(8): 1067.<br />
11. The map shows countries with a pre-defined heat-<strong>health</strong><br />
action plan, including eight key components defined<br />
by the WHO Regional Office for Europe (see Reference<br />
1). The plan in the United Kingdom <strong>of</strong> Great Britain<br />
<strong>and</strong> Northern Irel<strong>and</strong> covers only Engl<strong>and</strong>. The plans<br />
in Germany, Hungary <strong>and</strong> Switzerl<strong>and</strong> are operational<br />
at the sub national level. Kosovo is not covered by the<br />
plan developed for Serbia, but does some work in the<br />
area. The reference to Kosovo is without prejudice<br />
on position <strong>of</strong> the sides for the status, in accordance<br />
with UNSC Resolution 1244 <strong>and</strong> the opinion <strong>of</strong> the<br />
lnternational Court <strong>of</strong> Justice on the Declaration <strong>of</strong><br />
Kosovo’s Independence. Data source: WHO-EURO.<br />
Map production <strong>and</strong> copyright: WHO-WMO.<br />
12. Forecast heatwave probability automatically generated<br />
by the German Meteorological Weather Service<br />
(Deutscher Wetterdienst) for subregions <strong>of</strong> Europe,<br />
for the week beginning 18 th August 2012 . http://www.<br />
euroheat-project.org/dwd/index.php. Data source:<br />
Deutscher Wettherdienst. © EuroGeographics for<br />
the administrative boundaries. Map production:<br />
WHO-WMO. Copyright: WHO-WMO.<br />
13. The figure combines components specified in WMO-<br />
WHO guidance on heat <strong>health</strong> warning systems<br />
(in press), with those <strong>of</strong> heat <strong>health</strong> action plans<br />
specified in Reference 1.<br />
UV radiation<br />
1. Ferlay J <strong>and</strong> others, 2010: Cancer Incidence in Five<br />
Continents, Volumes I to IX: IARC CancerBase No.<br />
9 [Internet]. Lyon, France: International Agency for<br />
Research on Cancer; 2010. Available from: http://<br />
ci5.iarc.fr. Data source: IARC. Map production <strong>and</strong><br />
copyright: WHO-WMO.<br />
2. Ferlay J. <strong>and</strong> others, 2010: GLOBOCAN 2008 v1.2,<br />
Cancer Incidence <strong>and</strong> Mortality <strong>World</strong>wide: IARC CancerBase<br />
No. 10 [Internet]. Lyon, France: International<br />
Agency for Research on Cancer; 2010. Available from:<br />
http://globocan.iarc.fr, accessed on 20/08/2012.<br />
3. <strong>World</strong> <strong>Health</strong> <strong>Organization</strong>, 2002: Global Solar UV<br />
Index: A practical guide. A joint recommendation<br />
<strong>of</strong> <strong>World</strong> <strong>Health</strong> <strong>Organization</strong>, <strong>World</strong> Meteorological<br />
<strong>Organization</strong>, United Nations Environment<br />
Programme <strong>and</strong> the International Commission on<br />
Non-Ionizing Radiation Protection. WHO, Geneva.<br />
4. Global UV index under cloudy conditions. Data source:<br />
Deutscher Wetterdienst, http://www.dwd.de. Map<br />
production <strong>and</strong> copyright: Deutscher Wetterdienst.<br />
63
5. Courtesy <strong>of</strong> Australian Government Bureau <strong>of</strong> Meteorology.<br />
Pollens<br />
1. Observed data from European Aeroallergen Network<br />
for 2011 (http://www.ean-net.org. Data source:<br />
Medical University <strong>of</strong> Vienna, coordinator <strong>of</strong> EAN<br />
Network. Map production: EAN adapted by WHO-<br />
WMO. Copyright © Ean.<br />
2. Data from http://www.allergieradar.nl<br />
3. Right h<strong>and</strong> panel: 72-hours-long ragweed forecast<br />
by SILAM model for 10.08.2012 http://silam.fmi.fi.<br />
Data source: FMI. Map production FMI modified by<br />
WHO. Copyright: WHO-WMO.<br />
Air pollution<br />
1. Brasseur, G., 2009. Implications <strong>of</strong> <strong>climate</strong> change<br />
for air quality, WMO Bulletin 58(1), p 10-15.<br />
2. <strong>World</strong> <strong>Health</strong> <strong>Organization</strong>, http://www.who.int/phe/<br />
<strong>health</strong>_topics/outdoorair/databases/burden_disease/<br />
en/index.html<br />
3. <strong>World</strong> <strong>Health</strong> <strong>Organization</strong>, 2009: Global Risks:<br />
mortality <strong>and</strong> burden disease attributable to selected<br />
major risks. Geneva, <strong>World</strong> <strong>Health</strong> <strong>Organization</strong>.<br />
4. Wilkinson, P. <strong>and</strong> others, 2009. Public <strong>health</strong> benefits<br />
<strong>of</strong> strategies to reduce greenhouse-gas emissions:<br />
household energy. Lancet, 374(9705):1917-29.<br />
5. Data source: WHO. Map production <strong>and</strong> copyright:<br />
WHO-WMO.<br />
6. Pie graphs show the percentage <strong>of</strong> the population<br />
relying mainly on solid fuels for cooking by WHO<br />
region, which approximates the percentage <strong>of</strong> the<br />
population exposed to household air pollution. Bar<br />
graphs show population weighted annual means <strong>of</strong><br />
particulate matter with aerodynamic diameter <strong>of</strong> 10<br />
micrograms or less per meter-cubed (PM 10<br />
) in cities<br />
over 100,000 population. Data was not available<br />
for all cities <strong>and</strong> a weighted average was used to<br />
approximate the regional averages. The dashed line<br />
indicates the WHO air quality guideline <strong>of</strong> annual<br />
mean <strong>of</strong> 20µg/m 3 <strong>of</strong> PM 10<br />
. Regional aggregations<br />
for the figure are based on WHO regions - see WHO<br />
2012, <strong>World</strong> <strong>Health</strong> Report. Geneva, <strong>World</strong> <strong>Health</strong><br />
<strong>Organization</strong>.<br />
7. UNEP <strong>and</strong> WMO 2011 – Integrated Assessment <strong>of</strong><br />
Black Carbon <strong>and</strong> Tropospheric Ozone: Summary<br />
for Decision Makers (http://www.unep.org/dewa/<br />
Portals/67/pdf/Black_Carbon.pdf).<br />
8. Smith, K.R., <strong>and</strong> others, 2005 Household Fuels <strong>and</strong> Ill<strong>health</strong><br />
in Developing Countries: What improvements<br />
can be brought by LP gas Paris, <strong>World</strong> LP Gas<br />
Association.<br />
9. <strong>World</strong> <strong>Health</strong> <strong>Organization</strong>. http://www.who.int/<br />
gho/en/<br />
10. Bond, T. <strong>and</strong> others, 2004. Global Atmospheric<br />
impacts <strong>of</strong> residential fuels. Energy for Sustainable<br />
Development, 8(3):20-32.<br />
11. Smith, K.R., <strong>and</strong> others, 2004. Indoor air pollution<br />
from household use <strong>of</strong> solid fuels. In: Ezzati M et<br />
al., eds. Comparative Quantification <strong>of</strong> <strong>Health</strong> Risks:<br />
Global <strong>and</strong> Regional Burden <strong>of</strong> Disease Attribution to<br />
Selected Major Risk Factors. Geneva, <strong>World</strong> <strong>Health</strong><br />
<strong>Organization</strong>: 1432-93.<br />
12. <strong>World</strong> <strong>Health</strong> <strong>Organization</strong>, 2006. WHO air quality<br />
guidelines – global update 2005. Copenhagen: <strong>World</strong><br />
<strong>Health</strong> <strong>Organization</strong>.<br />
13. <strong>World</strong> Meteorological <strong>Organization</strong>. http://www.<br />
wmo.int/pages/prog/arep/gaw/gaw_home_en.html<br />
14. Jalkanen, L., 2007: Air Quality: meteorological services<br />
for safeguarding public <strong>health</strong>, in Elements for<br />
Life, Tudor Rose. WMO. http://mce2.org/wmogurme/<br />
15. Estimates are based on 2000 emissions. Data source<br />
<strong>and</strong> map production:Dr Tami Bond. This product<br />
was developed using materials from the United<br />
States National Imagery <strong>and</strong> Mapping Agency <strong>and</strong><br />
are reproduced with permission.<br />
16. The combined global warming effect <strong>of</strong> long-lived<br />
<strong>and</strong> short-lived pollutants can be described in terms<br />
<strong>of</strong> “radiative forcing”. A net positive RF indicates a<br />
net ‘warming’ effect <strong>and</strong> a net negative RF indicates<br />
a net ‘cooling’ effect. The RF values for methane<br />
include both direct <strong>and</strong> indirect chemical effects<br />
<strong>of</strong> short-lived species, <strong>and</strong> the RF values for ozone<br />
include both primary & secondary ozone. Data<br />
adapted from Unger, N. <strong>and</strong> others, 2010. Attribution<br />
<strong>of</strong> <strong>climate</strong> forcing to economic sectors. Proceedings<br />
<strong>of</strong> the National Academy <strong>of</strong> Sciences <strong>of</strong> the United<br />
States <strong>of</strong> America, 107(8):3382-7.<br />
64
<strong>World</strong> <strong>Health</strong> <strong>Organization</strong> (WHO)<br />
20 Avenue Appia – 1211 Geneva 27 – Switzerl<strong>and</strong><br />
Tel.: +41 (0) 22 791 32 64 – Fax: +41 (0) 22 791 48 57<br />
www.who.int<br />
<strong>World</strong> Meteorological <strong>Organization</strong> (WMO)<br />
7 bis, avenue de la Paix – P.O. Box 2300 – CH-1211 Geneva 2 – Switzerl<strong>and</strong><br />
Tel.: +41 (0) 22 730 84 03 – Fax: +41 (0) 22 730 80 40 – E-mail: cpa@wmo.int<br />
www.wmo.int<br />
P-WDS_121265