Tagging and Graffiti - Victoria University of Wellington
Tagging and Graffiti - Victoria University of Wellington
Tagging and Graffiti - Victoria University of Wellington

Create successful ePaper yourself
Turn your PDF publications into a flip-book with our unique Google optimized e-Paper software.
<strong>Tagging</strong> <strong>and</strong> <strong>Graffiti</strong>: attitudes <strong>and</strong> experiences <strong>of</strong> New Zeal<strong>and</strong>ers<br />
<strong>and</strong> drugs in order to focus on graffiti, or even that writing is an alternative to these<br />
activities:<br />
Alcohol <strong>and</strong> drugs sort <strong>of</strong> put you in that…mood. (Focus group participant)<br />
No, I know heaps <strong>of</strong> people who do it just for fun. (Focus group participant)<br />
Instead <strong>of</strong> taking drugs or getting drunk they tag. (Focus group participant).<br />
Some survey respondents also highlighted that ‘to damage something’ or ‘to destroy<br />
something’ was an unpopular reason for doing graffiti <strong>and</strong> were highly critical <strong>of</strong> the<br />
researchers for including it as a category. More on the relation between illegality <strong>and</strong> graffiti<br />
follows further in the discussion section <strong>of</strong> this report.<br />
The commissioning <strong>of</strong> graffiti <strong>and</strong> tagging<br />
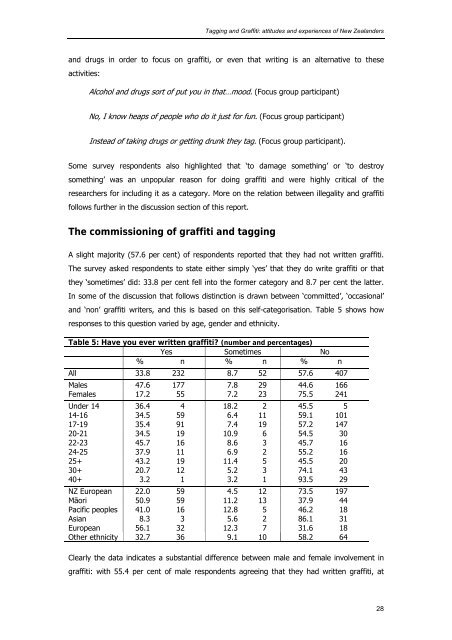
A slight majority (57.6 per cent) <strong>of</strong> respondents reported that they had not written graffiti.<br />
The survey asked respondents to state either simply ‘yes’ that they do write graffiti or that<br />
they ‘sometimes’ did: 33.8 per cent fell into the former category <strong>and</strong> 8.7 per cent the latter.<br />
In some <strong>of</strong> the discussion that follows distinction is drawn between ‘committed’, ‘occasional’<br />
<strong>and</strong> ‘non’ graffiti writers, <strong>and</strong> this is based on this self-categorisation. Table 5 shows how<br />
responses to this question varied by age, gender <strong>and</strong> ethnicity.<br />
Table 5: Have you ever written graffiti (number <strong>and</strong> percentages)<br />
Yes Sometimes No<br />
% n % n % n<br />
All 33.8 232 8.7 52 57.6 407<br />
Males 47.6 177 7.8 29 44.6 166<br />
Females 17.2 55 7.2 23 75.5 241<br />
Under 14 36.4 4 18.2 2 45.5 5<br />
14-16 34.5 59 6.4 11 59.1 101<br />
17-19 35.4 91 7.4 19 57.2 147<br />
20-21 34.5 19 10.9 6 54.5 30<br />
22-23 45.7 16 8.6 3 45.7 16<br />
24-25 37.9 11 6.9 2 55.2 16<br />
25+ 43.2 19 11.4 5 45.5 20<br />
30+ 20.7 12 5.2 3 74.1 43<br />
40+ 3.2 1 3.2 1 93.5 29<br />
NZ European 22.0 59 4.5 12 73.5 197<br />
Māori 50.9 59 11.2 13 37.9 44<br />
Pacific peoples 41.0 16 12.8 5 46.2 18<br />
Asian 8.3 3 5.6 2 86.1 31<br />
European 56.1 32 12.3 7 31.6 18<br />
Other ethnicity 32.7 36 9.1 10 58.2 64<br />
Clearly the data indicates a substantial difference between male <strong>and</strong> female involvement in<br />
graffiti: with 55.4 per cent <strong>of</strong> male respondents agreeing that they had written graffiti, at<br />
28