Report - Geoscience BC
Report - Geoscience BC Report - Geoscience BC
from geosciencebc.com
More from this publisher
30.01.2015
Views
Figure 20. Graph showing relationship between measured values of resistivity and wet S-wave velocity. Symbols distinguish samples from specific stratigraphic units.
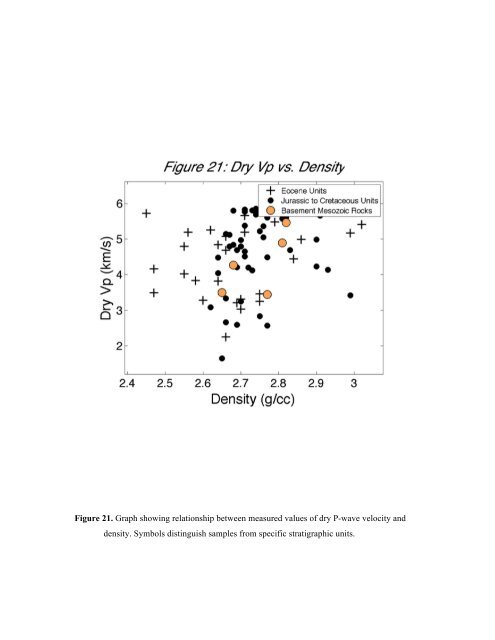
Figure 21. Graph showing relationship between measured values of dry P-wave velocity and density. Symbols distinguish samples from specific stratigraphic units.
- Page 2 and 3: Rock physical property measurements
- Page 4 and 5: 2.0 Geology of the Nechako Basin Th
- Page 6 and 7: surveys and distinguish the prospec
- Page 8 and 9: wave velocities. These measurements
- Page 10 and 11: Magnetic Susceptibility Magnetic su
- Page 12 and 13: made on all samples after being vac
- Page 14 and 15: Table 6. Maximum and minimum values
- Page 16 and 17: Figures Figure 1. Geologic map (wit
- Page 18 and 19: idealized stratigraphy of the Necha
- Page 20 and 21: Figure 4. Graph showing relationshi
- Page 22 and 23: Figure 6. Graph showing relationshi
- Page 24 and 25: Figure 8. Graph showing relationshi
- Page 26 and 27: Figure 10. Graph showing relationsh
- Page 28 and 29: Figure 12. Graph showing relationsh
- Page 30 and 31: Figure 14. Graph showing relationsh
- Page 32 and 33: Figure 16. Graph showing relationsh
- Page 34 and 35: Figure 18. Graph showing relationsh
- Page 38 and 39: Figure 22. Graph showing relationsh
- Page 40: Figure 24. Graph showing relationsh
Figure 21. Graph showing relationship between measured values of dry P-wave velocity and<br />
density. Symbols distinguish samples from specific stratigraphic units.


