Report - Geoscience BC
Report - Geoscience BC Report - Geoscience BC
from geosciencebc.com
More from this publisher
30.01.2015
Views
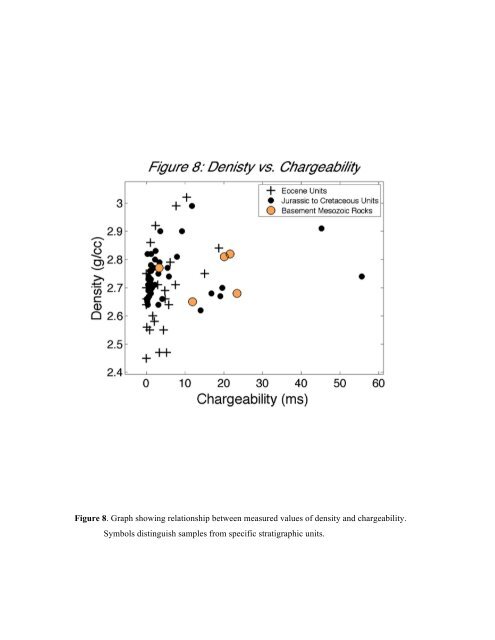
Figure 8. Graph showing relationship between measured values of density and chargeability. Symbols distinguish samples from specific stratigraphic units.
Figure 9. Graph showing relationship between measured values of porosity and resistivity. Symbols distinguish samples from specific stratigraphic units.
- Page 2 and 3: Rock physical property measurements
- Page 4 and 5: 2.0 Geology of the Nechako Basin Th
- Page 6 and 7: surveys and distinguish the prospec
- Page 8 and 9: wave velocities. These measurements
- Page 10 and 11: Magnetic Susceptibility Magnetic su
- Page 12 and 13: made on all samples after being vac
- Page 14 and 15: Table 6. Maximum and minimum values
- Page 16 and 17: Figures Figure 1. Geologic map (wit
- Page 18 and 19: idealized stratigraphy of the Necha
- Page 20 and 21: Figure 4. Graph showing relationshi
- Page 22 and 23: Figure 6. Graph showing relationshi
- Page 26 and 27: Figure 10. Graph showing relationsh
- Page 28 and 29: Figure 12. Graph showing relationsh
- Page 30 and 31: Figure 14. Graph showing relationsh
- Page 32 and 33: Figure 16. Graph showing relationsh
- Page 34 and 35: Figure 18. Graph showing relationsh
- Page 36 and 37: Figure 20. Graph showing relationsh
- Page 38 and 39: Figure 22. Graph showing relationsh
- Page 40: Figure 24. Graph showing relationsh
Figure 8. Graph showing relationship between measured values of density and chargeability.<br />
Symbols distinguish samples from specific stratigraphic units.


