Report - Geoscience BC
Report - Geoscience BC
Report - Geoscience BC

Create successful ePaper yourself
Turn your PDF publications into a flip-book with our unique Google optimized e-Paper software.
Rock physical property measurements to aid geophysical surveys<br />
in the Nechako Basin oil and gas region, central British Columbia<br />
Graham Andrews 1 , Steve Quane 2 , Randolph J. Enkin 3 , Kelly Russell 1 , Alexandra Kushnir 4 , Lori<br />
Kennedy 4 , Nathan Hayward 5 , Michael Heap 6 ,<br />
1 Volcanology and Petrology Lab, Department of Earth and Ocean Sciences, University of British<br />
Columbia, Vancouver, British Columbia, V6T 1Z4; 2 Quest University Canada, 3200 University<br />
Boulevard, Squamish, British Columbia, V8B O8N; 3 Geological Survey of Canada, P.O. Box<br />
6000, Sidney, British Columbia, V8L 4B2, 250-363-6431, Randy.Enkin@NRCan.gc.ca; 4 Centre<br />
for Experimental Studies of the Lithosphere, Department of Earth and Ocean Sciences,<br />
University of British Columbia, Vancouver, British Columbia, V6T 1Z4, 5 Geological Survey of<br />
Canada, 625 Robson Street, Vancouver, British Columbia, V6B 5J3; 6 Laboratoire de<br />
Géophisique Expérimentale, Institut de Physique de Globe de Strasbourg (UMR 7516 CNRS,<br />
Université de Strasbourg/EOST) 5 rue René Déscartes, 67084 Strasbourg cédex, France<br />
Executive Summary<br />
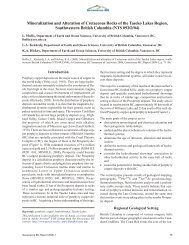
Miocene and younger basalts (e.g., Chilcotin Group) and Eocene to Jurassic age volcanic and<br />
sedimentary rocks (e.g., Endako Group, Ootsa Lake Group, Taylor Creek Group) underlie<br />
significant portions of the Interior Plateau and Nechako Basin of central British Columbia (Fig.<br />
1). There is potential for unexploited hydrocarbon and base metal resources underlying these<br />
younger volcanic and sedimentary successions, making this area of significant economic interest.<br />
Geophysical surveys (both seismic reflection and magnetotellurics), funded by <strong>Geoscience</strong> <strong>BC</strong><br />
and the Geological Survey of Canada, have concentrated on (1) portions of the Nechako Basin<br />
for hydrocarbon potential within Jurassic and Cretaceous sedimentary rocks (Ferri & Riddell;<br />
2006; Riddell, 2006; Riddell et. al 2007) and (2) portions of the Interior Plateau for base metal<br />
exploration. To help interpret variations in geophysical signals, we have measured the<br />
geophysical properties (density, porosity, magnetic susceptibility and remanence, electrical<br />
resistivity and chargeability, and seismic velocity) for 107 samples of the key lithologies of the<br />
Nechako Basin. This report was funded by <strong>Geoscience</strong> <strong>BC</strong> to aid in processing raw seismic and<br />
magnetotelluric data with the intention of extracting more accurate geophysical images of the<br />
subsurface and delineation of exploration targets.
1.0 Introduction<br />
The Mesozoic Nechako Basin in south-central British Columbia has under explored<br />
potential for oil and gas deposits hosted in Cretaceous strata (Hayes, 2002). First-order<br />
geological interpretations of the subsurface are hampered by the Nechako Basin’s structural<br />
complexity, which results from extensive poly-phase deformation and partial burial beneath<br />
significant extents of Cenozoic volcanic, volcaniclastic, and sedimentary rocks. The lack of<br />
continuity in outcrop and stratigraphy has hindered reconstructions of the basin and efforts to<br />
identify potential hydrocarbon traps. In an effort to address this, <strong>Geoscience</strong> <strong>BC</strong> and the<br />
Geological Survey of Canada have funded multi-million dollar geophysical survey programs<br />
(including seismic reflection, gravimetric, and magnetotelluric studies) and a reassessment of<br />
existing geophysical data sets across portions of the Interior Plateau (e.g., Spratt et al., 2007;<br />
2009; Hayward, 2008; Idowu et al., 2009; Kim et al., 2009). Interpretation of these surveys is<br />
made difficult by a lack of physical rock property data from the corresponding rocks within the<br />
Nechako Basin and a fragmentary understanding of even the near-surface geology. Establishing<br />
the extent of buried Cenozoic volcanic rocks and distinguishing them from buried and deformed<br />
Mesozoic successions is particularly challenging.<br />
<strong>Geoscience</strong> <strong>BC</strong> funded an investigation of the rock physical properties of the Nechako<br />
Basin to provide physical and geophysical measurements on rock samples representative of the<br />
geological formations underlying the Nechako Basin. These measurements include bulk density,<br />
connected porosity, magnetic susceptibility, magnetic remanence, Koenigsberger ratio, electrical<br />
resistivity, chargeability and seismic velocity. All measurements were performed at the Centre<br />
for Experimental Study of the Lithosphere, under the guidance of Dr. J.K. Russell and Dr. Lori<br />
Kennedy at the University of British Columbia; at the Paleomagnetism and Petrophysics<br />
Laboratory at the Geological Survey of Canada – Pacific under the guidance of Dr. Randolph<br />
Enkin; and at la Laboratoire de Géophysique Expérimentale under the guidance of Dr. Michael<br />
Heap at l’Université de Strasbourg, France. The complete dataset of physical and geophysical<br />
measurements is compiled in the spreadsheet G<strong>BC</strong>Rpt2011-10-Nechako_RxPhys_Database.xls.<br />
The purpose of this document is to provide explanatory notes and information on the methods<br />
used at each laboratory to make the physical measurements and is intended strictly as a<br />
supplement to the measurement database; it is not a stand-alone document, nor is it intended to<br />
provide any scientific analysis of the dataset.
2.0 Geology of the Nechako Basin<br />
The Interior Plateau is underlain by rocks belonging to the Intermontane Belt and, at its<br />
western boundary, is underlain mostly by the Coast Belt. The Plateau is predominantly ‘covered’<br />
by young volcanic rocks (i.e., Chilcotin Basalts) and Quaternary deposits. Beneath this cover, an<br />
inferred Jurassic-Cretaceous marine basin assemblage (i.e., the Nechako Basin) is overlain by<br />
Eocene volcanic and sedimentary successions deposited into a complex array of transtensional<br />
basins. The Jurassic-Cretaceous sequence has been a suspected hydrocarbon reserve since the<br />
1960s (Hannigan et al., 1994; Ferri & Riddell, 2006).<br />
The Nechako Basin is an approximately 75,000 km 2 area bounded to the south and west<br />
by the Coast Mountains, to the north by the Skeena Arch, and to the east by the Bonaparte<br />
Plateau and Cariboo Mountains (Fig. 1; Hayes, 2002; Riddell, 2006). It underlies much of the<br />
Present-day Fraser River Basin, including important tributaries such as the Chilcotin, Chilko, and<br />
Taseko Rivers. It is interpreted to have developed as a foreland basin during the Late Jurassic to<br />
Middle Cretaceous on basement comprised of integral parts of the Intermontane superterrane,<br />
namely the Cache Creek and Stikine terranes. Stikine terrane basement is present at the surface<br />
in the west and north of the Basin (Riddell, 2006) where it is represented by the Early-Middle<br />
Jurassic Hazelton volcanic arc (Hazelton Group). Oceanic rocks of the Cache Creek terrane rocks<br />
outcrop in the east and northeast.<br />
The Nechako Basin was filled by clastic sedimentary rocks in the Middle Jurassic<br />
(Ladner Group) and into the Early Cretaceous (Relay Mountain Group). Clastic marine<br />
sedimentation continued through the Cretaceous: the Hauterivian-Cenomanian Jackass Mountain<br />
Group, the Albian Taylor Creek and Skeena Groups, and the Albian-Cenomanian Silverquick<br />
Formation. Clastic sedimentation was interspersed with deposition of volcanic and volcaniclastic<br />
rocks of the Albian to Santonian Spences Bridge and Kasalka Groups, and the Turonian-<br />
Campanian Powell Creek volcanics and informally named Taseko River strata. All appreciable<br />
hydrocarbon potential is within the Cretaceous succession. Fig. 2 provides a generalized and<br />
schematic stratigraphic summary of the Nechako Basin.<br />
The Nechako Basin is extensively buried beneath 0 to 4000 m of Eocene, Miocene and<br />
Pliocene volcanic, volcaniclastic and sedimentary rocks belonging, chiefly, to the Endako, Ootsa<br />
Lake and Chilcotin Groups (Riddell, 2006). A diverse range of mafic and felsic volcanic and<br />
volcaniclastic rocks occur, including ash-flow tuffs indicative of caldera-forming eruptions. The
Pliocene to Holocene Anahim volcanic belt extends from west to east across the centre of the<br />
Basin. There are numerous Mesozoic and Cenozoic plutons intruded into the Basin. The Nechako<br />
Basin and overlying Cenozoic rocks are extensively buried beneath a 1 to 100 m thick veneer of<br />
glacial sediments (including till), glaciolacustrine and glaciofluvial successions. There is no<br />
inferred hydrocarbon resource in the Cenozoic succession.<br />
The structural geology of the Nechako Basin is not understood and, therefore, the<br />
architecture of potential hydrocarbon traps has not been established. Preliminary geophysical<br />
surveys have identified sub-basins, high- and low-angle faults, folds, and unconformities;<br />
however a lack of stratigraphic control due to the paucity of boreholes in the Basin makes lateral<br />
correlation and section-balancing impossible. A dedicated rock property suite from the known<br />
Nechako Basin stratigraphy will allow for improved geophysical imaging of the sub-surface<br />
geology.<br />
3.0 Previous Work<br />
During the 1980s, Canadian-Hunter exploration conducted a seismic reflection and<br />
gravity survey in the Nechako Basin and drilled some additional exploration wells. The seismic<br />
datasets have been reprocessed by Hayward and Calvert (SFU) to provide clearer imaging of<br />
subsurface structure and stratigraphy (2007-09). In addition, new vibroseis seismic reflection<br />
datasets were collected in 2008. The quality of imaging of the old dataset is relatively poor. As<br />
such, there is a pressing need to have a better constraint on the velocity structure of the diverse<br />
suite of volcanic and sedimentary rocks in the Nechako Basin. The physical and seismic<br />
properties collected will find use in refining and modeling the newly acquired seismic datasets.<br />
At the informal Nechako Basin workshop hosted by Andy Calvert at Simon Fraser<br />
University in late February 2009, the importance of having high quality data on seismic<br />
velocities and electrical resistivities from a large, geographically extensive sample suite was<br />
identified as a critical element of the interpretation of geophysical datasets, particularly given<br />
some ambiguous results and uncertainties in the surface geology. Jim Craven’s (GSC Ottawa)<br />
and Jessica Spratt's (<strong>Geoscience</strong> <strong>BC</strong> and GSC Ottawa) magnetotelluric studies have highlighted<br />
the need for good resolution in electrical resistivities data to differentiate the widespread<br />
Cretaceous and Eocene sequences. Similarly, seismic inversions (Calvert) suggest non-intuitive<br />
variations in compressional wave velocities for individual formations, specifically overlap in<br />
inferred seismic velocities between the Eocene and Jurassic-Cretaceous successions.<br />
Quantitative experimental data from the provided dataset will aid the interpretations of these
surveys and distinguish the prospective, non-hydrocarbon Eocene basinal sequence from the<br />
Jurassic-Cretaceous basinal sequence.<br />
4.0 Methods for Measurement of Physical & Geophysical Rock Properties<br />
Our experimental program focused on stratigraphic units that are most important to the<br />
interpretation of seismic datasets and the delineation of exploration targets within the Nechako<br />
Basin. These stratigraphic packages include:<br />
A) Eocene Volcanic and Sedimentary Rocks: These deposits are highly variable in thickness<br />
(absent to greater than 1000 meters) and, in part, cover the Jurassic and Cretaceous rocks which<br />
form the Nechako Basin. These stratigraphic units blanket, obscure, and complicate the<br />
interpretation of structure and stratigraphy of the Jurassic source rocks and Cretaceous reservoir<br />
rocks. Specific lithological packages studied include:<br />
i) the Endako Group: coherent, mafic, volcanic lavas that need to be distinguished<br />
from Chilcotin group rocks;<br />
ii) the Ootsa Lake Group:<br />
a. Volcaniclastic facies: a series of felsic volcaniclastic rocks and associated<br />
sedimentary rocks that exhibit bedding, and are difficult to discriminate<br />
geophysically from older Cretaceous volcaniclastic and sedimentary<br />
successions;<br />
b. Coherent facies: intermediate to felsic lavas and lava domes, which need to<br />
be discriminated against Endako Group lavas.<br />
B) Upper Cretaceous Volcaniclastic and Sedimentary Rocks: These rocks represent the potential<br />
hydrocarbon reservoir rocks within the Nechako Basin and are strongly bedded, weakly<br />
deformed and of exceptionally variable thickness. The lateral continuity of stratigraphy has not<br />
yet been fully resolved (Ferri & Riddell, 2006) and, therefore, it is necessary to sample several<br />
units in different locations, acknowledging that they may represent lateral facies variations of<br />
each other. Our experimental program has characterized the geophysical properties of the<br />
following lithological packages:<br />
i) Jackass Mountain Group: coarse-grained clastic sedimentary rocks inferred to be the<br />
most likely surface correlative of the subsurface Skeena Assemblage, which has been identified<br />
as the most significant potential reservoir in the Nechako Basin (Mustard & Mahoney, 2007).
The Jackass Mountain Group is best exposed and studied along the southern margin of the<br />
Nechako Basin near Taseko Lake;<br />
ii) Taylor Creek Group & Skeena Group: clastic sedimentary rocks and minor volcanic<br />
rocks exposed along and encountered in the subsurface of the Nazko River area;<br />
iii) Spences Bridge Group: intermediate lavas and tuffs, and minor sedimentary rocks<br />
exposed in the southern Nechako Basin;<br />
iv) Kasalka Group, Powell Creek Group & “Taseko River Strata”: intermediate lavas and<br />
tuffs, associated clastic sedimentary rocks (including conglomerates and sandstones in “Taseko<br />
Rive Strata”) found in many areas across the Basin; this is likely a very extensive sequence.<br />
C) Middle-Late Jurassic Sedimentary Rocks: the likely source rocks for hydrocarbon reserves in<br />
the Nechako Basin; these units probably form the lowermost parts of the basinal sequence:<br />
i) Ladner Group: fine to coarse-grained calcareous clastic rocks and carbonates. These<br />
are best exposed around Chilko Lake in the southern Nechako Basin;<br />
ii) Relay Mountain Group: fine to coarse-grained clastic and carbonaceous rocks<br />
underlying the Jackass Mountain Group, best exposed in the Nemaiah Valley and Chilko Lake<br />
areas of the southern Nechako Basin.<br />
D) Basement Rocks: Ultimately, the Nechako Basin is underlain by Permian, Triassic and<br />
Jurassic rocks of the Cache Creek and Stikine terranes, and Jurassic to Eocene age intrusions.<br />
These rocks tend to be more homogeneous in character and more easily differentiated against the<br />
overlying Cretaceous and Eocene stratigraphy. The more abundant of these stratigraphic units<br />
include:<br />
i) Jurassic-Cretaceous intrusive rocks (e.g., Taseko River);<br />
ii) Lower/Mid-Jurassic Hazelton Group: intermediate to felsic lavas and tuffs, minor<br />
clastic and carbonate sedimentary rocks (e.g., Puntzi Lake & west of Nechako), and;<br />
iii) Mid-Triassic Cache Creek Group: limestone, chert, clastic sediments, metamorphic,<br />
basalt (e.g., Blackwater River, Hanceville).<br />
A suite of more than 100 rock samples from formations representing the key Mesozoic<br />
and Eocene lithologies/stratigraphic units within the Nechako Basin was collected and from this<br />
collection 107 samples were chosen for experimental work to be performed at U<strong>BC</strong>, GSC-Pacific<br />
Centre and EOST Strasbourg. Our database of geophysical properties includes: density, porosity,<br />
magnetic susceptibility, remanent magnetization, electrical resistivity, chargeability and seismic
wave velocities. These measurements are made available through <strong>Geoscience</strong> <strong>BC</strong> in tabulated<br />
and map-based formats and are intended to aid in the reduction and interpretation of data from<br />
seismological, magnetotelluric, and airborne geophysical surveys. This database will, in turn, be<br />
able to be integrated into other provincial and national rock property databases (e.g., Parsons et<br />
al., 2009).<br />
The Nechako sample suite comprises rock samples of various lithologies, sampled from<br />
11 distinct stratigraphic units distributed across the Nechako Basin. In total, 107 samples were<br />
collected. A 25mm diameter cylindrical core was taken from each sample. The ends of each core<br />
were ground and polished at right angles to the cylinder side to create a perfectly smooth<br />
(~0.02mm precision) end surface. The polished ends are particularly important to the<br />
experimental measurement of seismic velocity because: i) they provide a perfect sample<br />
geometry, and ii) they ensure that there is good contact between the seismic velocity transducer<br />
endcaps and the sample.<br />
All sample preparation (e.g., cleaning, trimming, coring, drying) was done at U<strong>BC</strong> with<br />
some modification at EOST, Strasbourg. Different sets of geophysical properties were measured<br />
on the same sample cores by both J.K. Russell’s team at CESL (U<strong>BC</strong>) and EOST, Strasbourg<br />
and by Randy Enkin’s team at the GSC-Pacific (GSC-P). Specifically, for each sample measured:<br />
1) bulk density (EOST),<br />
2) porosity (EOST),<br />
3) magnetic susceptibility (U<strong>BC</strong> & GSC-P),<br />
4) remanent magnetization (GSC-P),<br />
5) electrical resistivity (GSC-P),<br />
6) induced polarization chargeability (GSC-P) and<br />
7) seismic wave velocities (EOST).<br />
Density and Porosity<br />
Bulk densities ( ! d<br />
) involve the direct measurement of sample mass and volume and are<br />
calculated using the following expression:<br />
(1)<br />
! d<br />
= m d<br />
V
where m d<br />
is the mass of the vacuum dried sample measured in air and V is the sample volume.<br />
The values of ! d<br />
are the density of the total sample (i.e. rock plus pores). The framework<br />
density ( ! f<br />
) is the density of the rock and isolated pore space alone and is computed using the<br />
wet/dry method for determining density. The method is also known as the Hydrostatic Weighing<br />
(Displacement method) and is derived from Archimedes’ Buoyancy law. After the dry masses<br />
were determined, all samples were vacuum saturated for a minimum of 15 hours to allow water<br />
to fill any pore spaces within the sample. The mass of the water-saturated sample was then<br />
weighed in air ( m w<br />
) and after it was fully submerged in water ( m b<br />
). ‘Wet’ bulk densities ( ! w<br />
)<br />
were calculated for all water-saturated samples using m w<br />
and reflect the density of the rock,<br />
isolated pore space and water saturated pore space. These values are necessary for determination<br />
of ‘wet’ seismic velocity.<br />
The density of the rock framework (plus any remaining isolated pores) was then<br />
computed using the following relationship:<br />
(2)<br />
m d<br />
! f<br />
= ! H 2 O<br />
m d<br />
" m b<br />
where ! H2 O is the density of the water at lab conditions. These two values of density ( ! d and<br />
! f<br />
) allow an indirect estimation of porosity (%):<br />
(3)<br />
! = m w " m d<br />
m w<br />
" m b<br />
*100<br />
Table 1. Maximum and minimum values of density and porosity for the Nechako Basin sample<br />
suite.<br />
Maximum Value<br />
Minimum Value<br />
Bulk Density (Dry) (g/m 3 ) 2.89 1.87<br />
Bulk Density (Wet) (g/m 3 ) 2.90 2.16<br />
Wet/Dry Density (g/m 3 ) 3.02 2.45<br />
Porosity (%) 30.06 0.19
Magnetic Susceptibility<br />
Magnetic susceptibility was measured on hand samples in the lab using a GF Instruments<br />
SM-20 pocket magnetic susceptibility meter, with a sensitivity of 10 -6 SI volume units. The<br />
measurement coil has a 5 cm diameter, and ~90% of the measured response comes from the top 2<br />
cm of the sample. We investigated the effect of small sample size on the measurements and<br />
found that samples more than 3 cm thick allow accurate magnetic susceptibility determinations.<br />
Usually 3 measurements were taken on different surfaces of the sample and the average is<br />
reported. The standard deviation of the 3 measurements is typically 10% due to spatial variations<br />
of magnetite concentration. Susceptibility measurements on cores were measured with a<br />
Sapphire SI2B susceptibility meter, accurate to 10 -7 SI. These measurements were used in<br />
preference to the SM-20 measurements.<br />
Table 2. Maximum and minimum values of magnetic susceptibility for the Nechako Basin<br />
sample suite.<br />
Maximum Value<br />
Minimum Value<br />
Magnetic Susceptibility (SI) 5.40 x 10 -2 2.79 x 10 -5<br />
Magnetic remanence and Koenigsberger ratio<br />
Magnetic remanence was measured using an AGICO JR5-A spinner magnetometer<br />
(sensitivity 10 -5 A/m). The full vector was measured, but only the total vector magnitude of the<br />
remanence is reported in the database.<br />
The Koenigsberger ratio (K N ) compares the relative strength of the natural remanent<br />
magnetization (NRM) to the induced magnetism in the geomagnetic field: K N = NRM / ( H 0 χ 0 ),<br />
where χ 0 is the magnetic susceptibility and the geomagnetic field strength (H 0 ) is approximated<br />
as a constant 40 A/m (or µ 0 H 0 = 50 µT = 50000 γ). When K N is above 1, then magnetic anomaly<br />
interpretation will be incorrect if magnetic remanence is not taken into consideration.<br />
Table 3. Maximum and minimum values of magnetic remanence and Koenigsberger ratio for the<br />
Nechako Basin.<br />
Maximum Value<br />
Minimum Value<br />
NRM (A/m) 27.7 2.57 x 10 -4<br />
K N 45.4 9.99 x 10 -3
Electrical Resistivity and Chargeability<br />
Complex electrical impedance frequency spectra were measured using a Solartron 1260<br />
Impedance Spectrum Analyser, based on the method of Katsube (2001). Sample cylinders were<br />
vacuum impregnated in distilled water and allowed to soak for at least 24 hours, to allow original<br />
ground water solutes precipitated in the sample porosity to dissolve and approximate original<br />
ground water conductivity. The impedance was measured with 5 frequencies per decade from 1<br />
MHz to 0.03 Hz. The scalar resistance was picked as the real impedance at the frequency which<br />
displays minimum imaginary impedance, typically around 1000 Hz. Resistivity [Ohm.m] is this<br />
resistance times the sample geometric factor, the cross section area divided by the length.<br />
Conductivity [Mho/m] is the reciprocal of the resistivity.<br />
Induced Polarization Chargeability is calculated after converting the frequency domain<br />
impedance spectrum to the time domain response to a step function, V (t)<br />
. Using the Newmont<br />
Standard, the chargeability (Sumner, 1976) is:<br />
t 1100ms<br />
(4) m = V ( t)<br />
dt V (0)<br />
T ∫ = t=<br />
440ms<br />
Table 4. Maximum and minimum values of electrical resistivity for the Nechako Basin sample<br />
suite.<br />
Maximum Value<br />
Minimum Value<br />
Electrical Resistivity (Ohm.m) 4.99 x 10 4 36.8<br />
Chargeability (ms) 55.6 1.44 x 10 -2<br />
Wet/Dry Seismic Wave Velocity Determination<br />
The values of V P are most important to the ongoing seismic surveys because the inversions<br />
of the seismic survey data are based on V P alone; values of shear wave velocities (V S ) are more<br />
difficult to invert for. It is unknown what the pore fluid pressures magnitudes are within the<br />
Nechako Basin, however, pore fluid pressure exerts a significant influence on geophysical<br />
seismic reflection and thus we feel that these measurements will be relevant.<br />
Dry and wet ultrasonic measurements were made on all cores. ‘Dry’ samples were dried<br />
under vacuum at 40°C for at least 24 hours. Subsequently, ‘wet’ ultrasonic measurements were
made on all samples after being vacuum saturated with agitated, deionized, distilled water for at<br />
least 15 hours.<br />
Two fundamental body wave types travel through material: P- (compressional) waves and<br />
S- (shear) waves. For P-waves, material moves parallel to the direction of propagation, while for<br />
S-waves, material moves in a plane perpendicular to the direction of wave propagation. For<br />
energy to travel through a given elastic material, there must be a resulting restoring force that<br />
resists deformation. For instance, when a material experiences strain, strain must be<br />
accommodated by a change in shape of the material. Because fluids cannot sustain a shear force,<br />
S-waves do not propagate through fluids. P-wave arrivals are always precursory to S-wave<br />
arrivals and are therefore easiest to identify. Knowing the P- and S-wave velocities,<br />
V and V<br />
P S<br />
,<br />
respectively, passing through a given rock sample, one can characterize the material in terms of<br />
its elastic moduli: Poisson’s ratio and Young’s modulus. Measurements on both wet and dry<br />
samples were performed to return acoustic wave velocities in wet and dry materials.<br />
P- and S-wave arrival times were measured using a bench top apparatus at the<br />
Laboratoire de Géophysique Expérimentale (l’Université de Strasbourg, France). Measurements<br />
were made using an Agilent Technologies DSO5012A digital storage oscilloscope, an Agilent<br />
Technologies 33210A, 10 MHz function/waveform generator and two broadband PZT<br />
piezoelectric transducer crystals (100 kHz to 1 MHz frequency) located at the top and bottom of<br />
the sample. Measurements were made under a force of 600 N to ensure a good contact between<br />
the endcaps and the sample ends. P-wave measurements were made on samples using a<br />
frequency of 700 kHz; S-wave measurements were made at a frequency of 300 kHz.<br />
Table 5. Maximum and minimum values of seismic velocities for the Nechako Basin sample<br />
suite under wet and dry laboratory conditions.<br />
Maximum Value<br />
Minimum Value<br />
Vp (Dry) (km/s) 6.17 1.65<br />
Vs (Dry) (km/s) 4.04 1.04<br />
Vp (Wet) (km/s) 6.63 3.02<br />
Vs (Wet) (km/s) 4.10 1.47<br />
P-wave arrivals were chosen as the first easily identified signal following the triggering<br />
pulse from the function generator. S-wave arrivals were more difficult to identify, but<br />
significantly easier for wet samples. A significant change in signal amplitude or a distinct<br />
inflection point in the slope of the signal identified S-wave arrivals.
Elastic Moduli Calculation<br />
Hooke’s Law describes elastic extension:<br />
(5) ! = E"<br />
where ! is the normal stress and ! is the elongation or normal strain. Young’s modulus, E, is<br />
the coefficient of proportionality and is the ratio of uniaxial stress to uniaxial strain; for most<br />
rocks, E has values between 10 and 80 GPa.<br />
Poisson’s ratio is the ratio between the extension and contraction of a material under<br />
uniaxial tension. Most rocks have Poisson’s ratios less than 0.5, generally 0.1 to 0.3.<br />
Incompressible materials exhibit conservation of volume, therefore, for these materials Poisson’s<br />
ratio equals 0.5.<br />
Using calculated P- and S-wave velocities, dynamic Poisson’s ratio (! d<br />
) and Young<br />
modulus ( E d<br />
) are computed:<br />
(6)<br />
and<br />
(7)<br />
!<br />
E d<br />
" d<br />
= V 2 2<br />
p<br />
# 2V s<br />
2(V 2 p<br />
# V 2 s<br />
)<br />
= " V 2 s<br />
(3V 2 p<br />
# 4V 2 s<br />
)<br />
V 2 2<br />
p<br />
# V s<br />
where ! is the bulk density of the sample (g/m 3 ).<br />
!
Table 6. Maximum and minimum values of the elastic moduli for the Nechako Basin sample<br />
suite under wet and dry laboratory conditions.<br />
Maximum Value<br />
Minimum Value<br />
Poisson’s Ratio (Dry) 0.41 -0.16<br />
Poisson’s Ration (Wet) 0.45 0.03<br />
Young’s Modulus (Dry) (GPa) 96.54 5.21<br />
Young’s Modulus (Wet) (GPa) 94.08 13.87<br />
V P /V S (Dry) 2.53 1.33<br />
V P /V S (Wet) 3.30 1.43<br />
Results<br />
Values from all the rock physical property measurements made in this study are<br />
compiled in the spreadsheet G<strong>BC</strong>Rpt2011-10-Nechako_rxPhys_Database.xls. As expected,<br />
different geologic units show different absolute values and different amounts of variance in each<br />
property. For example, the diverse volcanic and volcaniclastic Eocene Ootsa Lake unit (basalt<br />
lava flows to volcaniclastic sediments) shows a much greater scatter in rock physical properties<br />
than the much more uniform Ladner formation (sandstones and shales). These extensive and<br />
high-quality datasets will be incorporated into <strong>Geoscience</strong> <strong>BC</strong>’s digital database and promise to<br />
aid geophysical interpretation of these key exploration targets in central British Columbia.<br />
Multi-parameter plots featuring data from each stratigraphic unit are presented to demonstrate<br />
significant correlations (Figs. 3 through 23).<br />
Acknowledgements<br />
This study was supported by <strong>Geoscience</strong> <strong>BC</strong> project grant 2008-028 and GSC Contract #23254-<br />
096844-001-VAN awarded to JKR. We thank Janet Riddell, Bert Struik, Mitch Mihalynuk, Kate<br />
MacLaurin, and Peter Mustard, for providing us with their archived samples. Sample preparation<br />
at U<strong>BC</strong> was conducted by Peter Van de Reep and Harmanpreet Dhillon. Hayley Linton and<br />
Ashley Tkachyk performed the lab-work at the Geological Survey of Canada. Figure 1 was<br />
created by Fion Ma of <strong>Geoscience</strong> <strong>BC</strong>.
References Cited<br />
Hayes, B.J., 2002. Petroleum exploration potential of the Nechako Basin, British Columbia. B.C.<br />
Ministry of Energy, Mines and Petroleum Resources, Petroleum Geology Special Paper 2002-3.<br />
Katsube, T.J., 2001. An analytical procedure for determining spectral induced polarization<br />
characteristics of anisotropic rocks, Yellowknife mining district, Northwest Territories.<br />
Geological Survey of Canada, Current Research 2001-E3, 2001; 29 pages<br />
Riddell, J.M., 2006. Geology of the southern Nechako Basin. British Columbia Ministry of<br />
Energy, Mines and Petroleum Resources, Oil and Gas Division, Petroleum Geology Map 2006-1,<br />
scale 1:400 000.<br />
Sumner, J.S. 1976. Principles of Induced Polarization for Geophysical Exploration. Elsevier<br />
Scientific Publishing company, Amsterdam., 277 pp.
Figures<br />
Figure 1. Geologic map (with legend) of the Nechako Basin, (adapted from Riddell, 2006)<br />
showing the locations of samples analysed in this study.
Neogene<br />
Paleogene<br />
Cretaceous<br />
Stratified Rocks<br />
Qal: Quaternary cover<br />
Qv: Quaternary volcanics<br />
LTQAn: Anahim volcanics;;<br />
LTQGb: Garibaldi volcanics<br />
LTQCh: Chilcotin Group volcanics;;<br />
OlPiFr: Fraser Bend/Australian Creek<br />
Formation;; Miv: Miocene volcanics<br />
ETKm: Kamloops Group;;<br />
ETPr: Princeton Group<br />
ETEn: Endako Group;;<br />
ETOo: Ootsa Lake Group<br />
uKTa: Taseko River strata (informal)<br />
uKKs: Kasalka Group;;<br />
uKPo: Powell Creek volcanics<br />
KSq: Silverquick Fm<br />
KJa: Jackass Mountain Group<br />
KTc: Taylor Creek Group;;<br />
lKSk: Skeena Group<br />
lKSb: Spences Bridge Group<br />
lKGa: Gambier Group<br />
Jurassic to Cretaceous<br />
uJKRe: Relay Mountain Group<br />
Lower Middle Jurassic<br />
lmJAh: Ashcroft formation<br />
lmJHz: Hazelton Group<br />
(includes Hotnarko volcanics)<br />
Early to Middle Jurassic<br />
lmJLd: Ladner Creek, includes<br />
Last Creek, Huckleberry Mountain,<br />
Nemaiah formation<br />
Triassic to Jurassic<br />
uTrJNc: Nicola Group;;<br />
TrJTk: Takla Group<br />
Upper Triassic<br />
uTrTy: Tyaughton Group<br />
uTrCd: Cadwallader Group<br />
uTrS: Stuhini Group<br />
Permian to Triassic<br />
PJKu: Kutcho Group,<br />
including Sitlika assemblage<br />
Carboniferous to Jurassic<br />
CJBr: Bridge River Group<br />
Mississippian to Triassic<br />
MTrCc: Cache Creek Group<br />
Carboniferous to Permian<br />
CPSm: Slide Mountain Group<br />
to Triassic<br />
Ultramafic Rocks<br />
Pzus;; Pzum;; CTrus;; Pum;;<br />
Pus;; Cpus;; us<br />
Intrusive and<br />
High-grade Metamorphic Rocks<br />
Paleogene to Pliocene<br />
Ltgd<br />
ETfp;; ETg;; ETgb;; ETgd;; ETgr;;<br />
ETmi;; ETqm;; ETqp;; ETto<br />
Cretaceous to Paleogene<br />
KTdr;; KTfp;; KTg;; KTgd;;<br />
KTmi;; KTqd;; KTqp;; KTto<br />
Cretaceous<br />
LKdr;; LKfp;; LKg;; LKgd;;<br />
LKog;; LKqd;; LKqm;; LKto<br />
Kg;; Kgr;; Kmi;; Kog<br />
mKgb;; mKgd;; mKgr;;<br />
mKqd;; mKto<br />
EKdr;; EKgd;; EKim;;<br />
EKto;; EKog<br />
Jurassic to Cretaceous<br />
Jurassic<br />
JKdr;; JKg;; JKgd;; JKml;; JKog;;<br />
JKqd;; JKqm;; JKqp;; JKto<br />
LJgd;; LJgr;; LJqd;;<br />
LJqm;; LJto<br />
MJdr;; MJfp;; MJg;;<br />
MJqd;; MJqm<br />
EMJdr<br />
Jgd;; Jgs;; Jml;; Jmy;; Jqd<br />
MLJdr;; MLJgb;;<br />
MLJgd;; MLJqd<br />
EJdr;; EJqd;; EJsy<br />
Triassic to Jurassic<br />
TrJdr;; Trqd;; Trto<br />
Permian to Jurassic<br />
PJml;; PJog<br />
Paleozoic to Mesozoic<br />
PzMzm;; PzMzog;; PzMzpg<br />
Permian<br />
Pdr;; Pgb;; Pqm<br />
Age Unknown<br />
dr;; g;; gr;; hfs;; m;; ml;;<br />
og;; pg;; qd;; qm;; to<br />
Figure 1 (con’t). Geologic map (with legend) of the Nechako Basin, (adapted from Riddell,<br />
2006) showing the locations of samples analysed in this study.
idealized stratigraphy of the Nechako Basin<br />
Jurassic Cretaceous Eocene<br />
Endako Group<br />
basalt lavas<br />
and breccias (11)<br />
Ootsa Lake<br />
volcanic (9)<br />
Ootsa Lake<br />
sedimentary (9)<br />
Kasalka<br />
Group<br />
(8)<br />
Jackass Mtn.<br />
Group (17)<br />
Taylor Creek and<br />
Skeena Groups<br />
(10)<br />
Spences Bridge<br />
Group (9)<br />
Relay Mtn.<br />
Group (7)<br />
Hazelton Group<br />
(10)<br />
Ladner Creek<br />
Group (11)<br />
lithologies collected<br />
andesite, gabbro<br />
basalt to rhyolite<br />
lavas and tuffs<br />
greywacke, conglomerate,<br />
basalt breccia<br />
intermediate lava<br />
flows and breccias<br />
shales, sandstones,<br />
conglomerates, dacite<br />
porphyry<br />
siltstones, sandstones<br />
and conglomerates<br />
sandstones, conglomerates,<br />
dacite lava flows and tuffs<br />
sandstones and<br />
conglomerates<br />
shales, conglomerates,<br />
basalt lavas and breccias,<br />
felsic lavas and granites<br />
shales, siltstones<br />
and sandstones<br />
Mesozoic Plutonic Rocks<br />
(6)<br />
schists, gneisses<br />
and porphyry<br />
not to scale<br />
Figure 2. Andrews et al., 2010<br />
Not to scale<br />
Figure 2. Schematic representation of stratigraphic relationships within the Nechako basin.<br />
Number of samples collected from each stratigraphic unit is given in parentheses.
Figure 3. Graph showing relationship between measured values of density and porosity.<br />
Symbols distinguish samples from specific stratigraphic units.
Figure 4. Graph showing relationship between measured values of density and magnetic<br />
susceptibility. Symbols distinguish samples from specific stratigraphic units.
Figure 5. Graph showing relationship between measured values of density and NRM. Symbols<br />
distinguish samples from specific stratigraphic units.
Figure 6. Graph showing relationship between measured values of density and Koenigsberger<br />
ratio. Symbols distinguish samples from specific stratigraphic units.
Figure 7. Graph showing relationship between measured values of density and resistivity.<br />
Symbols distinguish samples from specific stratigraphic units.
Figure 8. Graph showing relationship between measured values of density and chargeability.<br />
Symbols distinguish samples from specific stratigraphic units.
Figure 9. Graph showing relationship between measured values of porosity and resistivity.<br />
Symbols distinguish samples from specific stratigraphic units.
Figure 10. Graph showing relationship between measured values of porosity and chargeability.<br />
Symbols distinguish samples from specific stratigraphic units.
Figure 11. Graph showing relationship between measured values of magnetic susceptibility and<br />
NRM. Symbols distinguish samples from specific stratigraphic units.
Figure 12. Graph showing relationship between measured values of magnetic susceptibility and<br />
Koenigsberger ratio. Symbols distinguish samples from specific stratigraphic units.
Figure 13. Graph showing relationship between measured values of magnetic susceptibility and<br />
resistivity. Symbols distinguish samples from specific stratigraphic units.
Figure 14. Graph showing relationship between measured values of magnetic susceptibility and<br />
chargeability. Symbols distinguish samples from specific stratigraphic units.
Figure 15. Graph showing relationship between measured values of Koenigsberger ratio and<br />
NRM. Symbols distinguish samples from specific stratigraphic units.
Figure 16. Graph showing relationship between measured values of resistivity and chargeability.<br />
Symbols distinguish samples from specific stratigraphic units.
Figure 17. Graph showing relationship between measured values of resistivity and dry P-wave<br />
velocity. Symbols distinguish samples from specific stratigraphic units.
Figure 18. Graph showing relationship between measured values of resistivity and dry S-wave<br />
velocity. Symbols distinguish samples from specific stratigraphic units.
Figure 19. Graph showing relationship between measured values of resistivity and wet P-wave<br />
velocity. Symbols distinguish samples from specific stratigraphic units.
Figure 20. Graph showing relationship between measured values of resistivity and wet S-wave<br />
velocity. Symbols distinguish samples from specific stratigraphic units.
Figure 21. Graph showing relationship between measured values of dry P-wave velocity and<br />
density. Symbols distinguish samples from specific stratigraphic units.
Figure 22. Graph showing relationship between measured values of wet P-wave velocity and<br />
density. Symbols distinguish samples from specific stratigraphic units.
Figure 23. Graph showing relationship between measured values of dry P-wave velocity and dry<br />
S-wave velocity. Symbols distinguish samples from specific stratigraphic units.
Figure 24. Graph showing relationship between measured values of wet P-wave velocity and wet<br />
S-wave velocity. Symbols distinguish samples from specific stratigraphic units.