HUMAN TRAFFICKING - National Crime Records Bureau
HUMAN TRAFFICKING - National Crime Records Bureau
HUMAN TRAFFICKING - National Crime Records Bureau

Create successful ePaper yourself
Turn your PDF publications into a flip-book with our unique Google optimized e-Paper software.
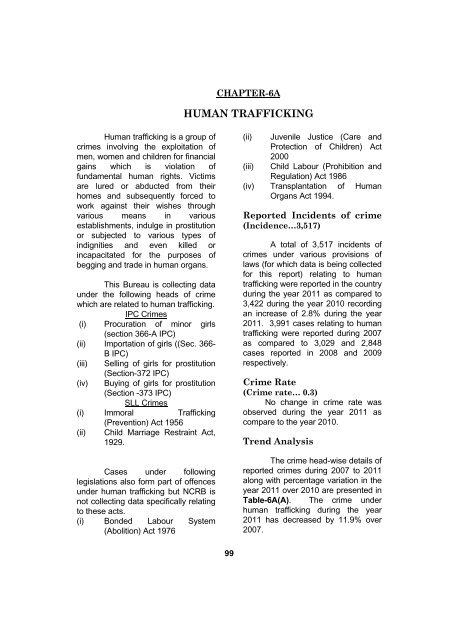
CHAPTER-6A<br />
<strong>HUMAN</strong> <strong>TRAFFICKING</strong><br />
Human trafficking is a group of<br />
crimes involving the exploitation of<br />
men, women and children for financial<br />
gains which is violation of<br />
fundamental human rights. Victims<br />
are lured or abducted from their<br />
homes and subsequently forced to<br />
work against their wishes through<br />
various means in various<br />
establishments, indulge in prostitution<br />
or subjected to various types of<br />
indignities and even killed or<br />
incapacitated for the purposes of<br />
begging and trade in human organs.<br />
This <strong>Bureau</strong> is collecting data<br />
under the following heads of crime<br />
which are related to human trafficking.<br />
IPC <strong>Crime</strong>s<br />
(i) Procuration of minor girls<br />
(section 366-A IPC)<br />
(ii) Importation of girls ((Sec. 366-<br />
B IPC)<br />
(iii) Selling of girls for prostitution<br />
(Section-372 IPC)<br />
(iv) Buying of girls for prostitution<br />
(Section -373 IPC)<br />
SLL <strong>Crime</strong>s<br />
(i) Immoral Trafficking<br />
(Prevention) Act 1956<br />
(ii) Child Marriage Restraint Act,<br />
1929.<br />
Cases under following<br />
legislations also form part of offences<br />
under human trafficking but NCRB is<br />
not collecting data specifically relating<br />
to these acts.<br />
(i) Bonded Labour System<br />
(Abolition) Act 1976<br />
(ii)<br />
(iii)<br />
Juvenile Justice (Care and<br />
Protection of Children) Act<br />
2000<br />
Child Labour (Prohibition and<br />
Regulation) Act 1986<br />
(iv) Transplantation of Human<br />
Organs Act 1994.<br />
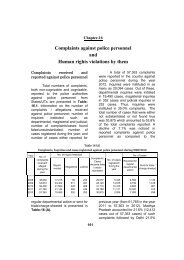
Reported Incidents of crime<br />
(Incidence…3,517)<br />
A total of 3,517 incidents of<br />
crimes under various provisions of<br />
laws (for which data is being collected<br />
for this report) relating to human<br />
trafficking were reported in the country<br />
during the year 2011 as compared to<br />
3,422 during the year 2010 recording<br />
an increase of 2.8% during the year<br />
2011. 3,991 cases relating to human<br />
trafficking were reported during 2007<br />
as compared to 3,029 and 2,848<br />
cases reported in 2008 and 2009<br />
respectively.<br />
<strong>Crime</strong> Rate<br />
(<strong>Crime</strong> rate… 0.3)<br />
No change in crime rate was<br />
observed during the year 2011 as<br />
compare to the year 2010.<br />
Trend Analysis<br />
The crime head-wise details of<br />
reported crimes during 2007 to 2011<br />
along with percentage variation in the<br />
year 2011 over 2010 are presented in<br />
Table-6A(A). The crime under<br />
human trafficking during the year<br />
2011 has decreased by 11.9% over<br />
2007.<br />
99
Importation of Girls (Sec. 366-B<br />
IPC)<br />
(Incidence…80)<br />
An increase of 122.2% has<br />
been observed in such cases as 80<br />
cases were reported during the year<br />
2011 as compared to 36 cases in the<br />
previous year (2010). Madhya Pradesh<br />
(45 cases), Karnataka (12 cases) and Bihar (10<br />
cases) altogether accounting for more than twothird<br />
(83.4%) of total such cases at the <strong>National</strong><br />
level.<br />
Procuration of Minor Girls<br />
(Sec. 366A IPC)<br />
(Incidence…862)<br />
862 cases were reported in<br />
the year 2011 as compared to 679<br />
such cases in 2010, accounting for<br />
27.0% increase over 2010. West<br />
Bengal has reported 298 such cases<br />
indicating a share of 34.6% at<br />
<strong>National</strong> level followed by Bihar (183<br />
cases) (21.2%) and Assam (142<br />
cases)(16.5%). An increasing trend<br />
was observed in these cases during<br />
the last four years. Details are given<br />
in Table 6A(C).<br />
Selling of Girls for Prostitution<br />
(Sec. 372 IPC)<br />
(Incidence…113)<br />
113 cases of ‘Selling of Girls<br />
for Prostitution’ were reported in the<br />
country during 2011 against 130<br />
such cases in 2010, thereby<br />
indicating a decrease of 13.1% over<br />
2010.<br />
West Bengal has accounted for 77.0% (87 cases<br />
out of 113 cases) of the total cases of ‘Selling<br />
of Girls for Prostitution' reported in the<br />
country.<br />
Buying of Girls for Prostitution<br />
(Sec. 373 IPC)<br />
(Incidence…27)<br />
27 cases of ‘Buying of Girls<br />
for Prostitution’ were reported in the<br />
country during the year 2011. This<br />
indicates a 65.4% decrease in the<br />
incidence over 2010 when 78 cases<br />
were reported in the country. 74.1%<br />
cases were reported in Maharashtra alone (20<br />
out of 27 cases).<br />
Immoral Traffic (Prevention)<br />
Act 1956<br />
(Incidence…2,435<br />
Rate…0.2)<br />
Cases under this Act have<br />
registered a decrease of 28.4% during<br />
the year 2011 as compared to the<br />
previous year (3,422 cases). 20.4%<br />
(497) cases were reported from Andhra Pradesh<br />
while Tamil Nadu has accounted for 17.2%<br />
(420) cases. Daman & Diu reported the highest<br />
crime rate of 2.5 as compared to the <strong>National</strong><br />
average of 0.2.<br />
100
Human Trafficking: Incidence of various crime during 2007-2011<br />
FIGURE 6.1A<br />
4000<br />
3500<br />
3000<br />
2500<br />
2000<br />
1500<br />
1000<br />
500<br />
0<br />
2007 2008 2009 2010 2011<br />
YEAR<br />
Buying of girls for Prostitution (Sec. 373 IPC) Procuration of Minor girls (Sec. 366-A) Importation of girls (Sec. 366-B IPC)<br />
Selling of girls for Prostitution (Sec. 372 IPC) Immoral Trafficking (Prevention) Act 1956
Human Trafficking:<br />
Percentage distribution during 2011<br />
Buying of Girls for<br />
Prostitution<br />
0.8%<br />
Immoral Trafficking<br />
(Prevention) Act 1956<br />
69.2%<br />
FIGURE 6.2A<br />
Procuration of<br />
Minor girls<br />
24.5%<br />
Importation of Girls<br />
2.3%<br />
Selling of Girls for<br />
Prostitution<br />
3.2%
Table-6A(A)<br />
<strong>Crime</strong> head-wise incidence of various crimes under Human Trafficking during 2007 - 2011<br />
and percentage variation in 2011 over 2010<br />
Sl.<br />
No.<br />
<strong>Crime</strong> Head<br />
Year<br />
2007 2008 2009 2010 2011<br />
Percentage<br />
variation in<br />
2011 over<br />
2010<br />
1.<br />
Procuration of Minor Girls (Sec. 366-A<br />
IPC)<br />
253 224 237 679 862 27.0<br />
2. Importation of Girls (Sec. 366-B IPC) 61 67 48 36 80 122.2<br />
3.<br />
4.<br />
5.<br />
Selling of Girls for Prostitution (Sec. 372<br />
IPC)<br />
Buying of Girls for Prostitution (Sec. 373<br />
IPC)<br />
Immoral Trafficking (Prevention) Act<br />
1956<br />
69 49 57 130 113 -13.1<br />
40 30 32 78 27 -65.4<br />
3,568 2,659 2,474 2,499 2,435 -2.6<br />
Total 3,991 3,029 2,848 3,422 3,517 2.8<br />
The total number of cases<br />
registered under these heads of<br />
human trafficking has shown a<br />
mixed trend during the last 5<br />
years. Details may be seen at<br />
Table-6A(B).<br />
States/UTs wise cases registered<br />
during 2011 are given at Table<br />
6A(C).<br />
Table-6A(B)<br />
IPC crimes, SLL crimes and crimes under Human Trafficking during 2007 - 2011<br />
Sl.<br />
No.<br />
Year<br />
Total IPC<br />
<strong>Crime</strong>s<br />
Total SLL<br />
<strong>Crime</strong>s<br />
Cases under<br />
Human Trafficking<br />
Rate of <strong>Crime</strong><br />
under Human<br />
Trafficking<br />
1. 2007 19,89,673 37,43,734 3,991 0.4<br />
2. 2008 20,93,379 38,44,725 3,029 0.3<br />
3. 2009 21,21,345 45,53,872 2,848 0.2<br />
4. 2010 22,24,831 45,25,917 3,422 0.3<br />
5. 2011 23,25,575 39,27,154 3,517 0.3<br />
103
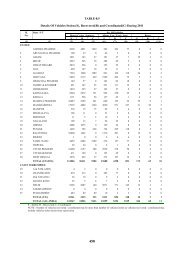
Table 6A(C)<br />
Cases Registered Under Human Trafficking During 2011<br />
Sl.<br />
No.<br />
State / UT<br />
Buying of<br />
Girls for<br />
Prostitution<br />
Selling of<br />
Girls for<br />
Prostitution<br />
Procuration<br />
of Minor<br />
Girls<br />
Importation<br />
of Girls<br />
Immoral<br />
Trafficking<br />
(Prevention)<br />
Act, 1956<br />
Total<br />
1 Andhra Pradesh 0 2 106 0 497 605<br />
2 Arunachal Pradesh 0 0 0 0 0 0<br />
3 Assam 0 0 142 2 21 165<br />
4 Bihar 1 1 183 10 23 218<br />
5 Chhattisgarh 0 1 15 2 15 33<br />
6 Goa 0 0 0 0 18 18<br />
7 Gujarat 0 0 4 0 46 50<br />
8 Haryana 2 2 0 0 57 61<br />
9 Himachal Pradesh 0 0 3 0 2 5<br />
10 Jammu & Kashmir 0 0 0 0 1 1<br />
11 Jharkhand 1 6 15 6 15 43<br />
12 Karnataka 0 1 8 12 351 372<br />
13 Kerala 0 0 9 0 197 206<br />
14 Madhya Pradesh 2 3 20 45 24 94<br />
15 Maharashtra 20 2 20 0 390 432<br />
16 Manipur 0 0 0 0 0 0<br />
17 Meghalaya 0 0 0 3 2 5<br />
18 Mizoram 0 0 0 0 8 8<br />
19 Nagaland 0 0 0 0 2 2<br />
20 Odisha 0 0 12 0 23 35<br />
21 Punjab 0 0 0 0 50 50<br />
22 Rajasthan 0 2 19 0 81 102<br />
23 Sikkim 0 0 0 0 1 1<br />
24 Tamil Nadu 0 0 0 0 420 420<br />
25 Tripura 0 0 5 0 2 7<br />
26 Uttar Pradesh 1 4 0 0 43 48<br />
27 Uttarakhand 0 0 0 0 3 3<br />
28 West Bengal 0 87 298 0 96 481<br />
Total (States) 27 111 859 80 2388 3465<br />
29 A & N Islands 0 0 0 0 3 3<br />
30 Chandigarh 0 0 0 0 1 1<br />
31 D & N Haveli 0 0 0 0 1 1<br />
32 Daman & Diu 0 0 0 0 6 6<br />
33 Delhi 0 2 3 0 33 38<br />
34 Lakshadweep 0 0 0 0 0 0<br />
35 Puducherry 0 0 0 0 3 3<br />
Total (UTs) 0 2 3 0 47 52<br />
Total (All-India) 27 113 862 80 2435 3517<br />
*****<br />
104