1998 Statistical Yearbook - pacificweb.org
1998 Statistical Yearbook - pacificweb.org
1998 Statistical Yearbook - pacificweb.org

You also want an ePaper? Increase the reach of your titles
YUMPU automatically turns print PDFs into web optimized ePapers that Google loves.
Chapter 1<br />
POPULATION
Page 2 <strong>1998</strong> CNMI <strong>Statistical</strong> <strong>Yearbook</strong>, Chapter 1<br />
Summary of Population Statistics<br />
The population in the Commonwealth of the Northern Mariana<br />
Islands increased tremendously between 1990 and 1995. This<br />
increase in population took place in the islands of Saipan, Rota,<br />
and Tinian, but not in the Northern Islands. Since 1935, Saipan’s<br />
population has increased proportionately more than Rota’s and<br />
Tinian’s population. By 1995, about 90 percent of the CNMI<br />
population lived on Saipan, 6 percent lived on Rota, about 5<br />
percent lived on Tinian, and less than one percent lived on the<br />
Northern Islands. Similarly, population density has increased in<br />
Saipan much faster than in Rota and in Tinian: by 1995, population<br />
density in Saipan was well over 1,133 persons per square mile; the<br />
same estimates showed that in Rota, population density was 107<br />
persons per square mile; and in Tinian, 67 persons per square<br />
mile.<br />
In Saipan, places of population concentration increased from<br />
1990 to 1995. In 1990, Garapan had 10 percent of Saipan’s total<br />
population and San Antonio had over 7 percent; by 1995,<br />
Garapan’s population had increased to about 13 percent, San<br />
Antonio area’s population increased to almost 12 percent, and<br />
Chalan Kanoa had over 11 percent of Saipan’s total population. In<br />
both Rota and Tinian, places of population centers, Songsong and<br />
San Jose, respectively remained the same in 1990 and 1995.<br />
Over 62 percent of the population in the CNMI were born<br />
elsewhere and migrated into the Commonwealth; most of them<br />
came into the CNMI in the second half of the 1980’s and into the<br />
Central Statistics Division, Department of Commerce
<strong>1998</strong> CNMI <strong>Statistical</strong> <strong>Yearbook</strong>, Chapter 1 Page 3<br />
1990’s. The majority of all immigrants were temporary residents<br />
who were residing in the Commonwealth under employment visas.<br />
The immigrant population’s age distribution was different from that<br />
of CNMI-born population: the immigrant population was older,<br />
mostly 20 to 44 year-olds. The CNMI born population is younger<br />
with a median age of 14.5 years.<br />
Major changes in population characteristics in the<br />
Commonwealth resulted from the huge migration into the CNMI<br />
between 1980 and 1995. The characteristics of these migrant<br />
workers combined with local population resulted in major shifts,<br />
such as (1) a significant difference in the number of married males<br />
and married females, (2) a high proportion of females employed,<br />
(3) a higher median age, and (4) a high male-female ratio.<br />
The population in the CNMI was relatively older in 1995,<br />
compared to prior census years: the mean age in 1995 was 28.0<br />
years, compared to 27.4 years in 1990 and 19.6 in 1980.<br />
In 1995, total males was almost even with the number of the<br />
total females: the male-female ratio in 1995 was 99 males to every<br />
100 females. By age group, females outnumbered males in age<br />
groups, 15-19, 20-24, 25-29, 70-74, and also 75 years and above.<br />
The majority of total population lived in households in 1995: over 19<br />
percent of population lived in group quarters in 1995, a decline<br />
from 26.4 percent of the total population in 1990.<br />
Over 63 percent of males were married, while only 50 percent of<br />
females were married in 1995. The disparity between the<br />
proportion of married males and married females reflected the<br />
different age distribution of male and female populations in the<br />
Commonwealth in 1995. A greater proportion of females, compared<br />
to males, were in age group 20-24, and 25-29; while a greater<br />
proportion of males were in age group 35-39, and 40-44. Hence,<br />
the likelihood of males being married was much higher than for<br />
females being married.<br />
About 38 percent of population in 1995 were born in the CNMI.<br />
The rest, a vast majority, of the population were born outside of the<br />
CNMI. Almost half were born in Asian countries (Philippines, Japan,<br />
Korea, China, Thailand)—over thirty percent were born in the<br />
Philippines alone. In comparison to 1990, over 38 percent of CNMI<br />
population were born in the Commonwealth. This shift in<br />
birthplaces of persons in the Commonwealth was more<br />
pronounced in Saipan than in Rota and Tinian.<br />
In 1995, the Filipino ethnic group was the largest single ethnic<br />
group in the Commonwealth; the Filipinos outnumbered the<br />
Chamorros in 1995. This phenomenal change was true in Saipan<br />
where the vast majority of CNMI population was (and still is)<br />
located. In Rota and in Tinian, Chamorro were still the most<br />
dominant ethnic group, although not as dominant as in previous<br />
years. In the Northern Islands, Carolinian were the most dominant<br />
ethnic group, although a very small population.<br />
The tables in the rest of this chapter show detailed population<br />
characteristics in the Commonwealth in recent years.<br />
Central Statistics Division, Department of Commerce
Page 4 <strong>1998</strong> CNMI <strong>Statistical</strong> <strong>Yearbook</strong>, Chapter 1<br />
Figure 1.1<br />
100<br />
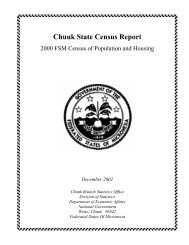
CNMI Population: Actual and<br />
Projected<br />
Ta ble 1.1 Popula tion by Island: 19 20 to 19 95<br />
Census Numbers Percent<br />
Year Total Saipan Rota Tinian N. Is. Total Saipan Rota Tinian N. Is.<br />
Persons in<br />
Thousands<br />
75<br />
50<br />
Actual<br />
Projected<br />
1995 58,846 52,698 3,509 2,631 8 100.0 89.6 6.0 4.5 0.0<br />
1990 43,345 38,896 2,295 2,118 36 100.0 89.7 5.3 4.9 0.1<br />
1980 16,780 14,549 1,261 866 104 100.0 86.7 7.5 5.2 0.6<br />
1973 14,333 12,382 1,104 714 133 100.0 86.4 7.7 5.0 0.9<br />
1967 10,986 9,035 1,078 610 263 100.0 82.2 9.8 5.6 2.4<br />
1958 8,290 6,654 969 405 262 100.0 80.3 11.7 4.9 3.2<br />
1935 4,297 3,194 788 24 291 100.0 74.3 18.3 0.6 6.8<br />
1930 3,829 2,915 644 43 227 100.0 76.1 16.8 1.1 5.9<br />
1925 3,493 2,639 487 180 187 100.0 75.6 13.9 5.2 5.4<br />
1920 3,398 2,449 651 112 186 100.0 72.1 19.2 3.3 5.5<br />
Source: Census reports for respective years; 1920-1935 for Natives only.<br />
25<br />
0<br />
Note: "0.0" means less than 1 percent.<br />
1920 '30 '58 '73 '90 2000 2010<br />
'25 '35 '67 '80 '95 2005<br />
Year<br />
Places of Population Concentration<br />
In Saipan, places of population concentration<br />
shifted between 1990 and 1995. In 1990,<br />
Garapan had 10 percent of Saipan’s total<br />
population and San Antonio had over 7<br />
percent. By 1995,<br />
• Garapan’s population had increased to<br />
about 13 percent,<br />
• Chalan Kanoa had almost 12 percent,<br />
• San Antonio area’s population increased to<br />
almost 12 percent,<br />
• and San Vicente’s population increased to 8<br />
percent of Saipan’s total population.<br />
• In both Rota and Tinian, places of<br />
population centers remained the same in<br />
Songsong and San Jose, respectively in<br />
1995 as in 1990.<br />
Table 1 .2 P opula tion by Isla nd a nd P lace: 1990 and 1995<br />
Island Percents<br />
and Numbers Percent CNMI Saipan<br />
Place 1995 1990 Change 1995 1990 1995 1990<br />
Total 58,846 43,345 35.8 100.0 100.0 ... ...<br />
Saipan 52,698 38,896 35.5 89.6 89.7 62.7 41.5<br />
San Roque 1,923 911 111.1 3.3 2.1 3.6 2.3<br />
Tanapag 1,747 1,602 9.1 3.0 3.7 3.3 4.1<br />
Garapan 6,636 3,904 70.0 11.3 9.0 12.6 10.0<br />
Oleai 3,944 839 370.1 6.7 1.9 7.5 2.2<br />
Susupe 2,091 1,776 17.7 3.6 4.1 4.0 4.6<br />
Chalan Kanoa 6,229 2,549 144.4 10.6 5.9 11.8 6.6<br />
San Antonio 6,256 2,887 116.7 10.6 6.7 11.9 7.4<br />
San Vicente 4,210 1,669 152.2 7.2 3.9 8.0 4.3<br />
Rota 3,509 2,295 52.9 6.0 5.3 ... ...<br />
Tinian 2,631 2,118 24.2 4.5 4.9 ... ...<br />
Northern Is. 8 36 -77.8 0.0 0.1 ... ...<br />
Source: 1990 CPH-6-CNMI Table 3, and 1995 CNMI Mid-Decade Census Table 28<br />
Central Statistics Division, Department of Commerce
<strong>1998</strong> CNMI <strong>Statistical</strong> <strong>Yearbook</strong>, Chapter 1 Page 5<br />
Ta ble 1.3 Popula tion Density by Isla nd: 192 0 to 19 95<br />
Numbers<br />
Persons Per Square Mile<br />
Census North. North.<br />
Year<br />
Area<br />
Total<br />
...<br />
Saipan<br />
...<br />
Rota<br />
...<br />
Tinian<br />
...<br />
Is.<br />
...<br />
Total<br />
176.5<br />
Saipan<br />
46.5<br />
Rota<br />
32.8<br />
Tinian<br />
39.2<br />
Is.<br />
55.3<br />
1995 58,846 52,698 3,509 2,631 8 333.4 1,133.3 107.0 67.1 0.1<br />
1990 43,345 38,896 2,295 2,118 36 245.6 836.5 70.0 54.0 0.7<br />
1980 16,780 14,549 1,261 866 104 95.1 312.9 38.4 22.1 1.9<br />
1973 14,333 12,382 1,104 714 133 81.2 266.3 33.7 18.2 2.4<br />
1967 10,986 9,035 1,078 610 263 62.2 194.3 32.9 15.6 4.8<br />
1958 8,290 6,654 969 405 262 47.0 143.1 29.5 10.3 4.7<br />
1935 4,297 3,194 788 24 291 24.3 68.7 24.0 0.6 5.3<br />
1930 3,829 2,915 644 43 227 21.7 62.7 19.6 1.1 4.1<br />
1925 3,493 2,639 487 180 187 19.8 56.8 14.8 4.6 3.4<br />
1920 3,398 2,449 651 112 186 19.3 52.7 19.8 2.9 3.4<br />
Source: Census reports for respective years; 1920-1935 for Natives only<br />
Figure 1.2<br />
Saipan<br />
86.7%<br />
Population Density Distribution by<br />
island, 1995<br />
N. Isl.<br />
0.0%<br />
Tinian<br />
5.1%<br />
Rota<br />
8.2%<br />
CNMI Population Density<br />
Table 1 .4 P opula tion by Ag e a nd Sex: 1980, 1990 a nd 1995<br />
Total Males Females<br />
Age Group 1995 1990 1980 1995 1990 1980 1995 1990 1980<br />
Total 58,846 43,345 16,780 29,276 22,802 8,817 29,570 20,543 7,963<br />
Less than 5 6,084 4,139 2,464 3,114 2,130 1,274 2,970 2,009 1,190<br />
5 to 9 4,619 3,275 2,148 2,355 1,686 1,040 2,264 1,589 1,108<br />
10 to 14 3,600 2,901 2,193 1,808 1,494 1,119 1,792 1,407 1,074<br />
15 to 19 3,335 2,773 1,703 1,616 1,215 842 1,719 1,558 861<br />
20 to 24 6,406 5,624 1,512 2,198 1,832 709 4,208 3,792 803<br />
25 to 29 8,914 6,140 1,463 3,631 3,134 753 5,283 3,006 710<br />
30 to 34 7,720 5,878 1,303 3,903 3,330 743 3,817 2,548 560<br />
35 to 39 6,465 4,330 864 3,625 2,635 520 2,840 1,695 344<br />
40 to 44 4,420 3,112 824 2,634 2,042 520 1,786 1,070 304<br />
45 to 49 3,040 1,921 660 1,872 1,352 404 1,168 569 256<br />
50 to 54 1,603 1,247 496 1,035 861 315 568 386 181<br />
55 to 59 1,053 771 388 656 466 225 397 305 163<br />
60 to 64 649 458 267 378 262 125 271 196 142<br />
65 to 69 401 349 228 221 195 119 180 154 109<br />
70 to 74 259 190 139 127 85 65 132 105 74<br />
75 and over 278 237 128 103 83 44 175 154 84<br />
Median 28.0 27.4 15.7 29.9 29.9 20.9 26.7 24.9 18.3<br />
Source: PC80-l-B57A Table 4a, CPH-6-CNMI Table 6, and 1995 CNMI Mid-Decade Census Table 6<br />
Population density has been increasing in<br />
Saipan much faster than in Rota and in<br />
Tinian: by 1995 estimates, population<br />
density in Saipan was 1,133 persons per<br />
square mile; the same estimates showed that<br />
in Rota, population density increased to<br />
about 107 persons per square mile; and in<br />
Tinian, to 67 persons per square mile.<br />
Figure 1.3<br />
Age Group<br />
75 and over<br />
70 to 74<br />
65 to 69<br />
60 to 64<br />
55 to 59<br />
50 to 54<br />
45 to 49<br />
40 to 44<br />
35 to 39<br />
30 to 34<br />
25 to 29<br />
20 to 24<br />
15 to 19<br />
10 to 14<br />
5 to 9<br />
Less than 5<br />
Population By Age Group and<br />
Sex, 1995<br />
Thousands<br />
0 1 2 3 4<br />
Males<br />
Female<br />
Central Statistics Division, Department of Commerce
Page 6 <strong>1998</strong> CNMI <strong>Statistical</strong> <strong>Yearbook</strong>, Chapter 1<br />
Median Age<br />
The population in the CNMI in 1995 were<br />
relatively older, compared to prior census<br />
years: the median age in 1995 was 28.0<br />
years, compared to 27.4 years in 1990 and<br />
19.6 in 1980.<br />
The main reason for this shift in the median<br />
age was the presence of a large migrant<br />
worker population.<br />
Table 1.5 Ag e Distribution by Island: 1995<br />
Number<br />
Percent<br />
Age Group Total Saipan Rota Tinian N. Is. Saipan Rota Tinian N. Is.<br />
Total 58,846 52,698 3,509 2,631 8 100.0 100.0 100.0 100.0<br />
0 to 4 6,084 5,311 393 379 1 10.1 11.2 14.4 12.5<br />
5 to 9 4,619 4,004 312 303 ... 7.6 8.9 11.5 0.0<br />
10 to 14 3,600 3,128 262 210 ... 5.9 7.5 8.0 0.0<br />
15 to 19 3,335 2,955 205 175 ... 5.6 5.8 6.7 0.0<br />
20 to 24 6,406 5,886 325 194 1 11.2 9.3 7.4 12.5<br />
25 to 29 8,914 8,126 476 311 1 15.4 13.6 11.8 12.5<br />
30 to 34 7,720 7,005 411 302 2 13.3 11.7 11.5 25.0<br />
35 to 39 6,465 5,826 368 270 1 11.1 10.5 10.3 12.5<br />
40 to 44 4,420 3,964 266 190 ... 7.5 7.6 7.2 0.0<br />
45 to 49 3,040 2,705 201 134 ... 5.1 5.7 5.1 0.0<br />
50 to 54 1,603 1,457 92 53 1 2.8 2.6 2.0 12.5<br />
55 to 59 1,053 959 56 38 ... 1.8 1.6 1.4 0.0<br />
60 to 64 649 578 45 25 1 1.1 1.3 1.0 12.5<br />
65 to 69 401 343 37 21 ... 0.7 1.1 0.8 0.0<br />
70 to 74 259 227 17 15 ... 0.4 0.5 0.6 0.0<br />
75 and over 278 224 43 11 ... 0.4 1.2 0.4 0.0<br />
Median 28.0 28.1 27.7 25.9 32.5 ... ... ... ...<br />
Source: 1995 CNMI Mid-Decade Census Table 6<br />
Male-Female Ratio<br />
Ta ble 1 .6 Ma les per 100 Fema les by Isla nd: 1995<br />
In 1995, the number of total males were<br />
almost even with the number of total<br />
females: the male-female ratio in 1995 was<br />
99 males to every 100 females. By age<br />
group, however, females outnumbered<br />
males in age group 15-19 through age group<br />
25-29, and in age group 70 years and over.<br />
The male-female ratio was lowest in Saipan<br />
in age group 20 to 24 years old.<br />
In Rota, females outnumbered males only in<br />
age group 20-24, 60-64, and in 75 years and<br />
over.<br />
The male-female ratio was highest in Tinian<br />
in age group 45 to 49 years old.<br />
1995 1990<br />
Age Group Total Saipan Rota Tinian Total<br />
Total 99 97 136 108 111<br />
0 to 4 105 105 115 97 106<br />
5 to 9 104 106 109 80 106<br />
10 to 14 101 100 110 110 106<br />
15 to 19 94 92 107 111 78<br />
20 to 24 52 49 99 92 48<br />
25 to 29 69 64 169 94 104<br />
30 to 34 102 99 194 103 131<br />
35 to 39 128 125 161 139 155<br />
40 to 44 147 147 146 150 191<br />
45 to 49 160 158 168 198 238<br />
50 to 54 182 187 171 112 223<br />
55 to 59 165 170 143 100 153<br />
60 to 64 139 143 88 178 134<br />
65 to 69 123 127 118 75 127<br />
70 to 74 96 91 183 114 81<br />
75 and over 59 51 87 175 54<br />
Source: 1995 CNMI Mid-Decade Census Table 6<br />
Central Statistics Division, Department of Commerce
<strong>1998</strong> CNMI <strong>Statistical</strong> <strong>Yearbook</strong>, Chapter 1 Page 7<br />
Table 1 .7 Household Rela tionship by Island: 1995<br />
Island<br />
Relationship Total Saipan Rota Tinian North. Is<br />
All persons 58,846 52,698 3,509 2,631 8<br />
In households 47,656 42,060 3,075 2,513 8<br />
Percent 81.0 79.8 87.6 95.5 100.0<br />
Family householder 8,257 7,388 462 406 1<br />
Male 6,527 5,825 367 334 1<br />
Female 1,730 1,563 95 72 0<br />
Non-family householder 3,801 3,457 228 116 0<br />
Male non-family 2,716 2,431 195 90 0<br />
Female non-family 1,085 1,026 33 26 0<br />
Spouse 6,159 5,508 323 327 1<br />
Child 16,072 14,010 1,091 968 3<br />
Parent 257 219 29 9 0<br />
Other relatives 5,077 4,506 309 260 2<br />
Nonrelatives 8,033 6,972 633 427 1<br />
Source: 1995 CNMI Mid-Decade Census Table 7<br />
Total Households Composition<br />
Of the 47,656 persons who lived in<br />
households in 1995, over 17 percent were<br />
family householders (of these, about 1 of 4<br />
were females); almost 8 percent were<br />
nonfamily householders of which 1 of 4<br />
were females; over 12 percent were<br />
spouses; over 33 percent were chlidren; less<br />
than 1 (.05) percent were parents; over 10<br />
percent were relatives; and interestingly,<br />
about 17 percent were persons not related<br />
to the household.<br />
Table 1 .8 Marital Sta tus by Sex a nd P la ce of Birth: 1995<br />
Marital Status<br />
All Guam/ Else-<br />
Marital Status persons CNMI Belau FSM Asia US where<br />
Males, 15 yrs & over 21,999 5,567 581 740 13,381 1,559 171<br />
Never married 7,265 2,040 212 293 4,185 488 47<br />
Now married 13,949 3,240 353 425 8,871 943 117<br />
Separated/Divorced 591 194 15 16 243 116 7<br />
Widowed 194 93 1 6 82 12 0<br />
Females, 15 yrs & over 22,544 5,286 660 836 14,506 1,097 159<br />
Never married 9,774 1,823 207 303 7,002 390 49<br />
Now married 11,283 2,843 352 453 6,934 609 92<br />
Separated/Divorced 712 256 38 35 296 76 11<br />
Widowed 775 364 63 45 274 22 7<br />
Source: 1995 CNMI Mid-Decade Census Table 72<br />
Sixty three percent of males were married,<br />
while only 50 percent of females were<br />
married in 1995. The disparity between the<br />
proportion of married males and married<br />
females reflected the different age<br />
distribution of male and female populations<br />
in the Commonwealth in 1995. A greater<br />
proportion of females, compared to males,<br />
were in age group 20-24 and age group 25-<br />
29; while a greater proportion of males<br />
were in age group 30-44. Hence, the<br />
likelihood of males being married was much<br />
higher than that of females.<br />
Central Statistics Division, Department of Commerce
Page 8 <strong>1998</strong> CNMI <strong>Statistical</strong> <strong>Yearbook</strong>, Chapter 1<br />
Table 1 .9 Fema les by Age Gr oup and by Marita l Sta tus, CNMI : 1995<br />
Never Now Sepa-<br />
Age Group Total married married rated Widowed Divorced<br />
Total 22,544 9,774 11,283 351 775 361<br />
15 to 19 years 1,719 1,578 138 1 2 0<br />
20 to 24 years 4,208 3,301 870 19 7 11<br />
25 to 29 years 5,283 2,514 2,687 41 9 32<br />
30 to 34 years 3,817 1,168 2,481 73 32 63<br />
35 to 39 years 2,840 646 1,996 77 61 60<br />
40 to 44 years 1,786 268 1,311 59 90 58<br />
45 to 49 years 1,168 148 832 39 84 65<br />
50 to 54 years 568 54 389 18 80 27<br />
55 to 59 years 397 44 256 8 68 21<br />
60 to 64 years 271 19 159 7 71 15<br />
65 to 69 years 312 22 129 8 145 8<br />
75 yrs. & over 175 12 35 1 126 1<br />
Source: 1995 CNMI Mid-Decade Census, Table<br />
Ta ble 1 .1 0 Wom en with Children by Age Group, CNMI, 199 5<br />
15 to 20 to 25 to 30 to 35 to 40 to 45 to 50 to 55 to 65 yrs<br />
Fertility Total 19 yrs 24 yrs 29 yrs 34 yrs 39 yrs 44 yrs 49 yrs 54 yrs 64 yrs & over<br />
Females 15 years and over 23,699 1,719 4,208 5,283 3,817 2,840 1,786 1,168 568 668 487<br />
Children ever born 42,409 325 1,531 4,353 5,430 5,982 4,972 3,939 2,195 3,735 3,106<br />
No children 10,575 1,492 3,266 2,818 1,323 740 335 197 88 87 71<br />
One child 4,277 167 560 1,482 1,044 518 237 107 40 34 27<br />
Two child 2,663 50 238 453 640 547 309 175 85 51 32<br />
Three child 1,949 7 100 292 400 421 280 170 83 70 28<br />
Four children 1,398 0 31 163 237 283 262 178 72 58 28<br />
Five children 840 0 10 40 112 168 157 120 63 51 34<br />
Six children 551 1 2 21 41 93 100 87 32 60 27<br />
Seven children 359 0 0 8 13 37 54 52 29 50 33<br />
Eight children 279 0 0 2 4 19 27 29 28 44 41<br />
Nine children 212 1 1 2 2 9 15 23 13 40 33<br />
Ten of more children 596 1 0 2 1 5 10 30 35 123 133<br />
Children still alive 37,098 300 1,521 4,303 5,365 5,871 4,870 3,821 2,129 3,494 965<br />
No children 10,616 1,494 3,269 2,829 1,329 744 338 197 90 87 76<br />
One child 4,318 168 560 1,478 1,048 521 243 112 42 39 34<br />
Two child 2,699 48 237 456 640 555 312 180 89 52 39<br />
Three child 1,981 7 99 292 402 422 287 170 80 79 32<br />
Four children 1,410 0 31 156 232 280 257 185 73 62 36<br />
Five children 834 0 9 40 111 162 158 117 63 51 36<br />
Six children 546 1 2 19 41 95 95 84 33 60 28<br />
Seven children 387 0 0 9 11 31 54 52 26 56 46<br />
Eight children 268 0 0 1 2 17 22 28 28 39 46<br />
Nine children 218 1 1 2 1 9 11 21 18 45 32<br />
Ten of more children 422 0 0 1 0 4 9 22 26 98 82<br />
Source: 1995 Mid-Decade Census, Table 58<br />
Central Statistics Division, Department of Commerce
<strong>1998</strong> CNMI <strong>Statistical</strong> <strong>Yearbook</strong>, Chapter 1 Page 9<br />
Table 1 .11 Fer tility by Age Group a nd P la ce of Bir th: 1995<br />
Phil-<br />
Guam/<br />
Fertility Total CNMI Palau FSM ippines Korea U.S.<br />
Women 15 to 19 yrs 1,719 914 65 105 159 78 153<br />
Children ever born 325 249 11 16 21 3 21<br />
Children still alive 300 224 11 16 21 3 21<br />
Children born in last yr 134 99 5 8 12 0 10<br />
Women 20 to 24 yrs 4,208 784 75 144 858 97 158<br />
Children ever born 1,531 930 55 92 202 11 111<br />
Children still alive 1,521 925 55 91 201 11 109<br />
Children born in last yr 347 192 14 19 72 3 24<br />
Women 25 to 29 yrs 5,283 722 105 151 1,784 113 171<br />
Children ever born 4,353 1,587 151 250 1,075 79 221<br />
Children still alive 4,303 1,573 151 250 1,056 77 212<br />
Children born in last yr 487 140 26 34 194 24 20<br />
Women 30 to 34 yrs 3,817 595 93 133 1,706 110 169<br />
Children ever born 5,430 1,617 199 324 2,105 142 302<br />
Children still alive 5,365 1,594 198 316 2,081 142 295<br />
Children born in last yr 378 61 11 11 217 13 24<br />
Women 35 to 39 yrs 2,840 607 84 107 1,317 126 126<br />
Children ever born 5,982 2,083 239 376 2,390 219 281<br />
Children still alive 5,871 2,053 237 359 2,336 218 278<br />
Children born in last yr 158 23 8 12 87 4 11<br />
Women 40 to 44 yrs 1,786 476 73 59 818 93 110<br />
Children ever born 4,972 1,878 286 237 1,947 172 290<br />
Children still alive 4,870 1,825 280 233 1,918 172 283<br />
Children born in last yr 31 6 0 1 19 1 4<br />
Women 45 to 49 yrs 1,168 407 57 40 482 52 75<br />
Children ever born 3,939 1,862 247 216 1,245 121 154<br />
Children still alive 3,821 1,779 244 205 1,235 120 146<br />
Children born in last yr 2 2 0 0 0 0 0<br />
Source: 1995 Mid-Decade Census Table 73<br />
Note: FSM means Federated States of Micronesia<br />
Figure 1.4 Places of Birth in 1990 and 1995<br />
100<br />
United States<br />
Palau<br />
FSM<br />
United States<br />
Palau<br />
FSM<br />
Table 1.12 Selected Pla ces of Birth: 1 990 a nd 1995<br />
80<br />
Elsewhere<br />
Elsewhere<br />
Percent<br />
60<br />
Change<br />
Number 1990 to Percent<br />
Philippines<br />
Birthplace 1995 1990 1995 1995 1990<br />
40<br />
Total 58,846 43,345 35.8 100.0 100.0<br />
Northern Marianas 22,208 16,752 32.6 37.7 38.6<br />
Philippines 17,870 13,563 31.8 30.4 31.3<br />
CNMI<br />
FSM 1,961 1,817 7.9 3.3 4.2<br />
20<br />
Palau 1,409 1,407 0.1 2.4 3.2<br />
United States 2,442 1,271 92.1 4.1 2.9<br />
Elsewhere 12,956 8,535 51.8 22.0 19.7<br />
0<br />
Source: 1990 CPH-6-CNMI Table 9, and 1995 CNMI Mid-Decade Census Table 11 1990 1995<br />
Census Year<br />
Percent of Population<br />
Philippines<br />
CNMI0<br />
Central Statistics Division, Department of Commerce
Page 10 <strong>1998</strong> CNMI <strong>Statistical</strong> <strong>Yearbook</strong>, Chapter 1<br />
Place of Birth<br />
In 1995, 38 percent of population were<br />
born in the CNMI. The rest, a vast majority,<br />
of the population were born outside of the<br />
CNMI. Almost half were born in Asian<br />
countries (Philippines, Japan, Korea, China,<br />
Thailand)—thirty percent were born in the<br />
Philippines alone.<br />
Table 1.13 Bir thplace by Island: 1995<br />
Island<br />
Percent<br />
No.<br />
No.<br />
Place of Birth Total Saipan Rota Tinian Is. Total Saipan Rota Tinian Is.<br />
All persons 58,846 52,698 3,509 2,631 8 100 100 100 100 100<br />
Northern Mariana Islands 22,246 19,084 1,683 1,434 7 38 36 48 55 88<br />
Guam 1,608 1,187 290 128 0 3 2 8 5 0<br />
Palau 1,411 1,385 10 14 0 2 3 0 1 0<br />
FSM 1,964 1,872 37 51 1 3 4 1 2 13<br />
Chuuk 1,044 1,020 18 3 1 2 2 1 0 13<br />
Kosrae 48 45 2 1 0 0 0 0 0 0<br />
Pohnpei 563 541 16 5 0 1 1 0 0 0<br />
Yap 295 251 1 42 0 1 0 0 2 0<br />
Marshall Islands 122 119 3 0 0 0 0 0 0 0<br />
Other Pacific Islands 88 86 1 1 0 0 0 0 0 0<br />
Asia 28,841 26,543 1,357 892 0 49 50 39 34 0<br />
Japan 956 922 25 7 0 2 2 1 0 0<br />
Korea 1,912 1,859 4 46 0 3 4 0 2 0<br />
China 6,731 6,675 8 37 0 11 13 0 1 0<br />
Philippines 17,900 15,913 1,168 789 0 30 30 33 30 0<br />
Bangladesh 460 315 143 1 0 1 1 4 0 0<br />
Thailand 558 554 3 0 0 1 1 0 0 0<br />
Other Asia 324 305 6 12 0 1 1 0 0 0<br />
United States 2,446 2,210 123 109 0 4 4 4 4 0<br />
Other US Insular Areas 15 15 0 0 0 0 0 0 0 0<br />
Elsewhere 204 197 5 2 0 0 0 0 0 0<br />
Source: 1995 CNMI Mid-Decade Census Table 11<br />
Male-Female Proportion by<br />
Birthplace<br />
The male-female proportion by birthplace<br />
varied in 1995,<br />
• 79% of those born in China were female<br />
• 60% of those born in the United States<br />
were male<br />
• 57% of those born in the Philippines were<br />
male<br />
• 55% of those born in Chuuk, FSM were<br />
female<br />
Figure 1.5<br />
Population by Sex Distribution, 1995<br />
Birthplace<br />
N. Marianas<br />
Guam<br />
Asia<br />
United States<br />
Palau<br />
Marshall Islands<br />
Other Pac. Isl.<br />
Fed. States Mic.<br />
Elsewhere<br />
Percent Distribution<br />
0 20 40 60 80 100<br />
Male<br />
Female<br />
Table 1 .14 P lace of Birth by Sex: 1995<br />
Number<br />
Percent<br />
Birthplace Total Males Females Total Males Females<br />
Total 58,846 29,276 29,570 100.0 100.0 100.0<br />
Northern Marianas 22,208 11,346 10,862 37.7 38.8 36.7<br />
Guam 1,605 807 798 2.7 2.8 2.7<br />
Asia 28,792 13,844 14,948 48.9 47.3 50.6<br />
Philippines 17,870 10,112 7,758 30.4 34.5 26.2<br />
China 6,720 1,390 5,330 11.4 4.7 18.0<br />
Korea 1,909 998 911 3.2 3.4 3.1<br />
United States 2,442 1,458 984 4.1 5.0 3.3<br />
Palau 1,409 663 746 2.4 2.3 2.5<br />
Marshall Islands 122 56 66 0.2 0.2 0.2<br />
Other Pac. Islanders 88 45 43 0.1 0.2 0.1<br />
Fed. States Micronesia 1,961 929 1,032 3.3 3.2 3.5<br />
Kosrae 48 25 23 0.1 0.1 0.1<br />
Pohnpei 562 271 291 1.0 0.9 1.0<br />
Chuuk 1,042 473 569 1.8 1.6 1.9<br />
Yap 294 153 141 0.5 0.5 0.5<br />
Elsewhere 219 128 91 0.4 0.4 0.3<br />
Source: 1995 CNMI Mid-Decade Census Table 11<br />
Central Statistics Division, Department of Commerce
<strong>1998</strong> CNMI <strong>Statistical</strong> <strong>Yearbook</strong>, Chapter 1 Page 11<br />
Ta ble 1 .15 Ag e by P la ce of Birth: 1995<br />
CNMI Asia Guam/<br />
Phili- Ko- United Else-<br />
Age Group Total Total Saipan Tinian Rota Palau FSM Total ppines rea States where<br />
All persons 58,846 22,220 18,832 1,258 1,861 1,409 1,961 28,781 17,866 1,909 4,061 414<br />
Less than 5 years 6,084 5,452 4808 325 311 36 63 190 99 48 328 15<br />
5 to 9 years 4,619 3,542 3092 243 193 63 136 316 173 93 525 37<br />
10 to 14 years 3,600 2,361 2029 145 179 69 186 399 206 149 553 32<br />
15 to 19 years 3,335 1,940 1676 121 137 140 210 715 300 140 303 27<br />
20 to 24 years 6,406 1,533 1309 86 132 157 258 4132 1,345 164 295 31<br />
25 to 29 years 8,914 1,471 1217 87 147 201 294 6522 3,360 231 379 47<br />
30 to 34 years 7,720 1,283 1046 72 125 181 239 5584 3,856 236 370 63<br />
35 to 39 years 6,465 1,252 995 76 147 168 185 4476 3,399 264 334 50<br />
40 to 44 years 4,420 1,007 783 63 130 119 121 2850 2,287 197 290 33<br />
45 to 49 years 3,040 827 660 27 122 98 80 1768 1,466 133 239 28<br />
50 to 54 years 1,603 354 260 2 50 61 71 908 722 107 190 19<br />
55 to 59 years 1,053 351 287 1 47 41 50 478 358 69 121 12<br />
60 to 64 years 649 313 255 2 49 25 23 231 172 29 49 8<br />
65 to 69 years 401 214 166 4 33 15 18 117 74 22 35 2<br />
70 to 74 years 259 144 117 4 17 16 18 52 28 15 23 6<br />
75 to 79 years 144 90 66 0 22 14 7 21 9 7 11 1<br />
80 to 84 years 86 54 45 0 9 3 2 16 8 4 8 3<br />
85 years and over 48 32 21 0 11 2 0 6 4 1 8 0<br />
Median Age 28.0 14.5 13.7 12.1 24.2 31.1 27.2 31.9 34.5 32.7 25.3 31.4<br />
Source: 1995 CNMI Mid-Decade Census Table 72<br />
Figure 1.6<br />
Age Group<br />
Percent Born within and Born<br />
Outside CNMI By Age Group in<br />
1995<br />
65 years and over<br />
55 to 64 years<br />
45 to 54 years 1,181<br />
35 to 44 years 2,259<br />
30 to 34 years 1,283<br />
25 to 29 years 1,471<br />
20 to 24 years 1,533<br />
15 to 19 years<br />
10 to 14 years<br />
5 to 9 years<br />
Less than 5 years<br />
Percentage<br />
0 20 40 60 80 100<br />
534<br />
404<br />
664<br />
1,038<br />
3,462<br />
8,626<br />
6,437<br />
7,443<br />
4,873<br />
1,940<br />
1,395<br />
2,361 1,239<br />
3,542 1,077<br />
5,452 632<br />
CNMI-born<br />
Outside-born<br />
Table 1 .16 Ag e by Ethnicity: 1995<br />
Chamorro<br />
Carolinian<br />
Single Chamorro Single Carolinian<br />
Age Group Total Total ethnic and other Total ethnic and other Filipino<br />
Total 58,846 17,120 13,844 3,276 3,041 2,382 659 19,462<br />
Less than 5 yrs 6,084 2,946 1,932 1,014 465 275 190 1,155<br />
5 to 9 yrs 4,619 2,571 1,847 724 396 269 127 555<br />
10 to 14 yrs 3,600 2,005 1,542 463 364 260 104 330<br />
15 to 19 yrs 3,335 1,649 1,313 336 330 257 73 340<br />
20 to 24 yrs 6,406 1,308 1,112 196 280 232 48 1,342<br />
25 to 29 yrs 8,914 1,323 1,181 142 224 198 26 3,361<br />
30 to 34 yrs 7,720 1,104 1,016 88 233 205 28 3,858<br />
35 to 44 yrs 10,885 1,964 1,822 142 372 339 33 5,683<br />
45 to 54 yrs 4,643 1,099 1,008 91 197 180 17 2,187<br />
55 to 64 yrs 1,702 632 582 50 112 105 7 527<br />
65 years & over 938 519 489 30 68 62 6 124<br />
Source: 1995 Mid-Decade Census Table 59<br />
Central Statistics Division, Department of Commerce
Page 12 <strong>1998</strong> CNMI <strong>Statistical</strong> <strong>Yearbook</strong>, Chapter 1<br />
Ethnicity<br />
Table 1.17 Ethnicity by Island: 1995<br />
In 1995, the Filipino ethnic group were the<br />
largest single ethnic group in the<br />
Commonwealth; the Filipinos outnumbered<br />
the Chamorros in 1995. This phenomenal<br />
change was true in Saipan where the vast<br />
majority of CNMI population was (and still is)<br />
located. In Rota and in Tinian, Chamorro<br />
were still the most dominant ethnic group,<br />
although not as dominant as in previous<br />
years. In the Northern Islands, Carolinian<br />
were the most dominant ethnic group,<br />
although a very small population.<br />
Migration<br />
Over 61 percent of the population in the<br />
CNMI were born elsewhere and migrated<br />
into the Commonwealth; most of them<br />
came into the CNMI in the second half of<br />
the 1980’s and into the 1990’s. The majority<br />
of all immigrants were temporary residents<br />
who were residing in the Commonwealth<br />
under employment visas. The largest<br />
immigration population were in 1994 or<br />
1995 when 11,444 people immigrated into<br />
the CNMI.<br />
Figure 1.7<br />
Migrants in the CNMI by Year of<br />
Entry in 1995<br />
Island<br />
Ethnicity Total Saipan Rota Tinian North. Is.<br />
Total 58,846 52,698 3,509 2,631 8<br />
Single ethnic group 53,044 47,499 3,286 2,251 8<br />
Carolinian 2,382 2,371 2 2 7<br />
Chamorro 13,844 10,894 1,734 1,216 0<br />
Marshallese 113 112 1 0 0<br />
Palauan 1,929 1,882 37 10 0<br />
Pohnpeian 636 613 19 4 0<br />
Chuukese 1,237 1,218 14 4 1<br />
Yapese 198 186 0 12 0<br />
Kosraean 52 44 5 3 0<br />
Other Pacific Islander 137 132 0 5 0<br />
Asian 30,676 28,340 1,400 936 0<br />
Filipino 19,462 17,426 1,211 825 0<br />
Japanese 953 917 26 10 0<br />
Korean 2,275 2,222 4 49 0<br />
Chinese 6,762 6,717 8 37 0<br />
Other Asian 1,224 1,058 151 15 0<br />
White 1,760 1,636 66 58 0<br />
Black 21 13 7 1 0<br />
Other single ethnic 59 58 1 0 0<br />
Multiple ethnic group 5,802 5,199 223 380 0<br />
Carolinian & other 659 654 1 4 0<br />
Chamorro & other 3,276 2,815 151 310 0<br />
Source: 1995 Mid-Decade Census Table 44<br />
Table 1.18 Year of Mig ration into CNMI by Isla nd: 1995<br />
Persons in<br />
Thousands<br />
14<br />
12<br />
10<br />
8<br />
6<br />
4<br />
2<br />
0<br />
425<br />
963 1,041<br />
2,189<br />
7,789<br />
6,984<br />
5,803<br />
11,444<br />
<strong>1998</strong> CNMI <strong>Statistical</strong> <strong>Yearbook</strong>, Chapter 1 Page 13<br />
Ta ble 1 .19 CNMI Mid- Yea r P opula tion Estim ates<br />
(Estimates based on the 1995 Census result)<br />
Year Total Male Female<br />
1996 60,960 30,147 30,813<br />
1997 63,763 31,311 32,452<br />
<strong>1998</strong> 66,559 32,475 34,084<br />
1999 69,341 33,636 35,705<br />
2000 72,101 34,790 37,311<br />
2001 74,847 35,941 38,906<br />
2002 77,588 37,093 40,495<br />
2003 80,318 38,243 42,075<br />
2004 83,033 39,390 43,643<br />
2005 85,731 40,532 45,199<br />
2006 88,412 41,669 46,743<br />
2007 91,077 42,802 48,275<br />
2008 93,728 43,932 49,796<br />
2009 96,362 45,057 51,305<br />
2010 98,974 46,175 52,799<br />
2015 111,649 51,625 60,024<br />
2020 123,502 56,748 66,754<br />
2025 134,285 61,420 72,865<br />
2030 143,696 65,508 78,188<br />
2035 151,394 68,870 82,524<br />
2040 157,102 71,420 85,682<br />
2045 160,665 73,144 87,521<br />
2050 161,990 74,092 87,898<br />
Population Projections<br />
Table 1.19 shows a population projection for<br />
the CNMI until the year 2050. It is<br />
projected that the female will compromise<br />
over 54% of the total population of about<br />
162,000 people in 2050.<br />
Prepared by: Central Statistics Division<br />
Central Statistics Division, Department of Commerce
Chapter 2<br />
VITAL<br />
STATISTICS
Page 16 <strong>1998</strong> CNMI <strong>Statistical</strong> <strong>Yearbook</strong>, Chapter 2<br />
Summary of Vital Statistics<br />
The number of births in the CNMI increased since 1984, except for<br />
the years 1989, 1994 and 1996 . The number of deaths declined<br />
from 1996 to 1997. The crude birth rate fluctuated but moved<br />
upward in most years during this period. The crude birth rate was<br />
low in 1984 at 23 births per 1,000 persons and was high in 1991 at<br />
31 births per 1,000 persons.<br />
In recent years, almost all births took place in the general<br />
hospital in the Commonwealth.<br />
There is an interesting pattern of births in the CNMI; since<br />
1987, more births occurred during the second six months (July-<br />
December) of the calendar year than the first six months (January-<br />
June). In 1997, the month of October revealed to have had the<br />
highest number of births, followed by September, November,<br />
December, and August respectively.<br />
The highest proportion of births in a year were firstborn<br />
children, and the highest proportion of births were for mothers in<br />
age group 25-29. As expected, most mothers are in ages between<br />
15 and 39 years old.<br />
About 39 percent of babies born between 1992 and 1997<br />
weighed between 6.6 and 7.6 lbs. In 1997, 78 percent of babies<br />
born weighed between 5.5 and 8.7 lbs.<br />
The average number of deaths during the period between<br />
1991 to 1996 was highest in ages less than 4, particularly in age<br />
less than one. The 65-69 age group was highest among adults in<br />
relation to number of deaths.<br />
Generally, more males than females died each year: about 2<br />
out of 3 of all deaths each year were males.<br />
The tables in this chapter present vital statistics in the<br />
Commonwealth in recent years.<br />
Central Statistics Division, Department of Commerce
<strong>1998</strong> CNMI <strong>Statistical</strong> <strong>Yearbook</strong>, Chapter 2 Page 17<br />
Tabl e 2. 1 CNMI Bi rt hs and Deat hs: 1984 t o 1997<br />
Number of Registered Rates<br />
Infant<br />
Infant<br />
Year Population Births Deaths Deaths Births Dea ths Mortality<br />
1997 63,763 1,536 147 8 24.1 2.3 5.2<br />
1996 61,407 1,467 165 12 23.9 2.7 8.2<br />
1995 58,846 1,525 170 11 25.9 2.9 7.2<br />
1994 55,746 1,426 133 10 25.6 2.4 7.0<br />
1993 52,646 1,605 164 16 30.5 3.1 10.0<br />
Number of Births in the CNMI<br />
The number of births in the CNMI steadily<br />
increased since 1984, except for the years<br />
1989, 1994, and 1996. The number of<br />
deaths declined from 1996 to 1997. The<br />
birth rate was low in 1984 at 23 births per<br />
1,000 persons and was high in 1991 at 31<br />
births per 1,000 persons.<br />
In recent years, almost all births took place in<br />
the general hospital in the Commonwealth.<br />
1992 49,545 1,511 157 15 30.5 3.2 9.9<br />
1991 46,445 1,423 155 10 30.6 3.3 7.0<br />
1990 43,345 1,186 143 11 27.4 3.3 9.3<br />
1989 40,693 989 122 2 24.3 3.0 2.0<br />
1988 38,036 1,007 124 18 26.5 3.3 17.9<br />
1987 35,379 975 118 4 27.6 3.3 4.1<br />
1986 32,722 804 121 8 24.6 3.7 10.0<br />
1985 30,065 698 95 14 23.2 3.2 20.1<br />
1984 27,408 631 114 15 23.0 4.2 23.8<br />
Figure 2.1<br />
2000<br />
1500<br />
Number of Births and Deaths in<br />
the CNMI, 1987 to 1997<br />
Births<br />
Deaths<br />
Source: Commonwealth Health Center, and Central Statistic Division<br />
Note: 1990, 1995 censuses population, 1992 current household survey population.<br />
Birth and death rates are per 1,000 persons. Infant Mortality Rate is per 1,000 live births.<br />
Number<br />
1000<br />
500<br />
0<br />
'87<br />
'88<br />
'89<br />
'90<br />
'91<br />
'92<br />
'93<br />
'94<br />
'95<br />
'96<br />
'97<br />
Year<br />
Table 2 .2 Live Births by Type of Health Facility: 1992 to 1997<br />
Year<br />
Health Facility 1997 1996 1995 1994 1993 1992<br />
Total 1,536 1,467 1,525 1,426 1,605 1,511<br />
Hospital/sub-health center 1,535 1,466 1,522 1,422 1,600 1,452<br />
Clinics 1 0 0 0 0 49<br />
Home or other 0 1 3 4 5 10<br />
Source: Commonwealth Health Center<br />
Central Statistics Division, Department of Commerce
Page 18 <strong>1998</strong> CNMI <strong>Statistical</strong> <strong>Yearbook</strong>, Chapter 2<br />
Birth Patterns<br />
There is an interesting pattern of births in the<br />
CNMI; since 1987, more births occurred<br />
during the second six months (July-<br />
December) of the calendar year than the first<br />
six months (January-June).<br />
Figure 2.2<br />
Number of births<br />
1000<br />
800<br />
600<br />
400<br />
Number of Births in the First sixand<br />
the Second six-months of the<br />
Year, 1987 to 1992<br />
First six months<br />
Second six months<br />
Table 2 .3 Registered Live Births by Month: 1 992 to 1997<br />
Year<br />
Month 1997 1996 1995 1994 1993 1992<br />
Total 1,536 1,467 1,525 1,426 1,605 1,511<br />
First six months 716 708 721 671 776 710<br />
January 125 135 113 117 128 112<br />
February 97 120 109 136 119 121<br />
March 111 109 133 103 124 119<br />
April 134 105 115 109 128 126<br />
May 129 110 141 102 128 120<br />
June 120 129 110 104 149 112<br />
Second six months 820 759 804 755 829 801<br />
July 138 125 118 124 121 136<br />
August 131 139 133 120 141 125<br />
September 145 135 132 132 143 129<br />
October 139 107 129 150 157 136<br />
November 130 119 154 126 143 120<br />
December 137 134 138 103 124 155<br />
Source: Commonwealth Health Center<br />
200<br />
0<br />
Less than 15 yrs<br />
15 - 19 yrs<br />
20 - 24 yrs<br />
25 - 29 yrs<br />
30 - 34 yrs<br />
35 - 39 yrs<br />
40 - 44 yrs<br />
45 or more yrs<br />
'87 '88 '89 '90 '91 '92<br />
Year<br />
Figure 2.3<br />
Average Number of Births per Age Group<br />
1992 to 1997<br />
Average Births<br />
0 100 200 300 400 500 600<br />
Table 2 .4 Registered Live Births by Ag e of Mother: 1992 to 1997<br />
Year<br />
Age of Mother 1997 1996 1995 1994 1993 1992<br />
Total 1,536 1,467 1,525 1,426 1,605 1,511<br />
Less than 15 years 3 4 5 3 1 2<br />
15 - 19 years 148 134 158 160 159 177<br />
20 - 24 years 344 317 381 345 410 366<br />
25 - 29 years 496 484 467 473 517 486<br />
30 - 34 years 348 345 338 298 349 320<br />
35 - 39 years 148 139 137 124 132 136<br />
40 - 44 years 36 41 28 20 25 24<br />
45 years and over 2 2 0 1 1 0<br />
Unknown 11 1 11 2 11 0<br />
Source: Commonwealth Health Center<br />
Central Statistics Division, Department of Commerce
<strong>1998</strong> CNMI <strong>Statistical</strong> <strong>Yearbook</strong>, Chapter 2 Page 19<br />
Table 2 .5 Live Births by Order of Birth: 1 992 to 1997<br />
Year<br />
Order 1997 1996 1995 1994 1993 1992<br />
Total 1,536 1,467 1,513 1,426 1,605 1,511<br />
First 399 373 624 593 596 549<br />
Second 357 337 438 436 407 416<br />
Third 191 170 238 195 282 262<br />
Fourth 117 74 121 113 158 130<br />
Fifth 48 48 41 44 86 89<br />
Sixth 25 20 25 22 47 30<br />
Seventh 16 12 12 13 19 18<br />
Eighth 7 9 3 6 3 7<br />
Ninth 1 1 5 1 3 9<br />
Tenth & over 5 4 6 3 3 0<br />
Not reported 370 419 0 0 1 1<br />
Source: Commonwealth Health Center<br />
Births and Mother<br />
The highest proportion of births in a year<br />
were firstborn children, and the highest<br />
proportion of births were for mothers in age<br />
group 25-29. As expected, most mothers<br />
were in ages between 15 and 39 years old.<br />
Table 2 .6 Live Births by Age of Mother and Live Birth Or der: 1 997<br />
Age of Mother<br />
Order Total< 15 15-19 20-24 25-29 30-34 35-39 40-44 45-49 NR<br />
Total 1,536 3 148 318 496 348 148 39 2 11<br />
First 399 2 80 86 123 80 19 6 0 3<br />
Second 357 0 22 93 117 78 38 6 0 3<br />
Third 191 0 3 49 61 52 19 4 1 2<br />
Fourth 117 0 0 25 41 31 16 3 0 1<br />
Fifth 48 0 0 5 17 14 10 2 0 0<br />
Sixth 25 0 0 3 10 6 6 0 0 0<br />
Seventh 16 0 0 1 2 4 4 3 1 1<br />
Eighth 7 0 0 0 1 3 2 1 0 0<br />
Ninth 1 0 0 0 0 0 1 0 0 0<br />
Tenth of more 5 0 0 1 2 1 1 0 0 0<br />
Not reported 370 1 43 81 122 79 32 11 0 1<br />
Source: Commonwealth Health Center<br />
*Note: NR stands for Not Reported.<br />
Central Statistics Division, Department of Commerce
Page 20 <strong>1998</strong> CNMI <strong>Statistical</strong> <strong>Yearbook</strong>, Chapter 2<br />
Table 2 .7 Live Births by Age of Mother and Marita l Sta tus: 1996 a nd 1 997<br />
1997 1996<br />
Not- Not Not- Not<br />
Age Group Total Married married reported Total Married married stated<br />
Total 1,536 584 621 331 1,467 546 544 377<br />
Less than 15 3 0 1 2 4 0 3 1<br />
15 - 19 years 148 7 113 28 134 9 90 35<br />
20 - 24 years 344 85 184 75 317 73 163 81<br />
25 - 29 years 496 216 169 111 484 207 153 124<br />
30 - 34 years 348 182 94 72 345 167 87 91<br />
35 - 39 years 148 75 44 29 139 65 39 35<br />
40 - 44 years 36 14 10 12 41 23 9 9<br />
45 to 49years 2 1 1 0 2 2 0 0<br />
Not stated 11 4 5 2 1 0 0 1<br />
Source: Commonwealth Health Center<br />
Birth Weight<br />
About 39 percent of babies born between<br />
1992 and 1997 weighed between 6.6 and<br />
7.6 lbs. In 1997, 78 percent weighed<br />
between 5.5 and 8.7 lbs.<br />
Ta ble 2 .8 Live Births by Birth Weig ht: 1992 to 1997<br />
Year<br />
Birth Weight 1997 1996 1995 1994 1993 1992<br />
Total 1,536 1,467 1,525 1,426 1,605 1,511<br />
Under 1.1 lb 0 2 0 0 1 3<br />
1.1 lb - 2.2 lb 1 5 1 3 5 7<br />
Over 2.2 lb - 3.3 lb 4 10 7 2 12 8<br />
Over 3.3 lb - 4.4 lb 10 23 13 12 19 20<br />
Over 4.4 lb - 5.5 lb 77 55 114 88 102 78<br />
Over 5.5 lb - 6.6 lb 357 281 403 346 369 353<br />
Over 6.6 lb - 7.7 lb 556 608 569 558 641 648<br />
Over 7.7 lb - 8.8 lb 285 356 259 233 332 315<br />
Over 8.8 lb - 9.9 lb 59 102 49 85 94 67<br />
Over 9.9 lb - 10.9 lb 4 14 6 8 12 10<br />
Over 10.9 lb 1 1 1 3 1 1<br />
Not Stated 182 10 103 88 17 1<br />
Source: Commonwealth Health Center<br />
Central Statistics Division, Department of Commerce
<strong>1998</strong> CNMI <strong>Statistical</strong> <strong>Yearbook</strong>, Chapter 2 Page 21<br />
Table 2.9 Register ed Live Bir ths by Type of Attenda nt: 1991 to 1996<br />
Calendar Year<br />
Type of Attendant 1996 1995 1994 1993 1992 1991<br />
Total 1,467 1,525 1,426 1,605 1,511 1,423<br />
Physician 577 621 555 576 569 429<br />
Certified midwife 888 896 869 1,027 916 975<br />
Medex or nurse 0 7 0 0 17 11<br />
Other 2 1 2 2 9 8<br />
Source: Commonwealth Health Center<br />
Table 2.10 Register ed Dea ths by Age: 1991 to 1 996<br />
Calendar Year<br />
Age Group 1996 1995 1994 1993 1992 1991<br />
Total 165 170 133 164 157 155<br />
0 - 4 years 14 14 13 28 17 14<br />
5 - 9 years 2 2 1 4 2 1<br />
10 - 14 years 1 1 0 1 3 2<br />
15 - 19 years 2 4 4 2 2 1<br />
20 - 24 years 4 5 4 3 4 9<br />
25 - 29 years 9 14 2 12 8 7<br />
30 - 34 years 5 11 5 8 13 11<br />
35 - 39 years 11 9 11 6 8 12<br />
40 - 44 years 8 16 6 8 9 14<br />
45 - 49 years 12 8 9 12 12 14<br />
50 - 54 years 12 14 3 12 9 10<br />
55 - 59 years 11 8 8 12 9 6<br />
60 - 64 years 16 9 14 7 14 14<br />
65 - 69 years 10 22 10 15 11 13<br />
70 - 74 years 18 14 18 9 5 7<br />
75 - 79 years 14 4 10 13 16 8<br />
80 - 84 years 6 7 8 5 9 9<br />
85 years and over 10 8 7 7 6 3<br />
Source: Vital Statistics, Public Health Center<br />
Number of Deaths<br />
The average number of deaths was highest<br />
among children in age group 0-4, particularly<br />
in age less than one. The 65-69 age group<br />
was highest among adults.<br />
Figure 2.4 Average Number of Deaths by<br />
Age Group, 1991 to 1996<br />
Age Group<br />
0 - 4 years<br />
Less than 1 yr.<br />
5 - 9 years<br />
10 - 14 years<br />
15 - 19 years<br />
20 - 24 years<br />
25 - 29 years<br />
30 - 34 years<br />
35 - 39 years<br />
40 - 44 years<br />
45 - 49 years<br />
50 - 54 years<br />
55 - 59 years<br />
60 - 64 years<br />
65 - 69 years<br />
70 - 74 years<br />
75 - 79 years<br />
80 - 84 years<br />
85 years and over<br />
0 5 10 15 20<br />
Central Statistics Division, Department of Commerce
Page 22 <strong>1998</strong> CNMI <strong>Statistical</strong> <strong>Yearbook</strong>, Chapter 2<br />
Male vs. Female Deaths<br />
More males than females died each year,<br />
since 1991.<br />
Figure 2.5 Number of Deaths by Sex, 1991<br />
to 1996<br />
Number of Deaths<br />
120<br />
100<br />
80<br />
60<br />
40<br />
20<br />
0<br />
Males<br />
Females<br />
1991 1992 1993 1994 1995 1996<br />
Year<br />
Table 2 .11 Reg ister ed Dea ths by Ag e a nd Sex: 1993 to 1996<br />
1996 1995 1994 1993<br />
Age Group Males Females Males Females Males Females Males Females<br />
Total 101 64 103 67 80 53 103 61<br />
1 - 4 years 2 0 9 5 3 10 16 12<br />
Less than 1 year 4 8 7 4 2 8 14 10<br />
5 - 9 years 2 0 1 1 1 0 4 0<br />
10 - 14 years 0 1 1 0 0 0 1 0<br />
15 - 19 years 2 0 2 2 4 0 1 1<br />
20 - 24 years 3 1 3 2 2 2 1 2<br />
25 - 29 years 5 4 12 2 2 0 9 3<br />
30 - 34 years 4 1 9 2 3 2 7 1<br />
35 - 39 years 10 1 8 1 9 2 6 0<br />
40 - 44 years 4 4 10 6 2 4 5 3<br />
45 - 49 years 8 4 4 4 6 3 6 7<br />
50 - 54 years 8 4 11 3 2 1 9 2<br />
55 - 59 years 11 0 4 4 6 2 8 4<br />
60 - 64 years 12 4 5 4 11 3 2 5<br />
65 - 69 years 5 5 10 12 6 4 11 4<br />
70 - 74 years 9 9 7 7 14 4 6 3<br />
75 - 79 years 7 7 1 3 2 8 5 8<br />
80 - 84 years 3 3 5 2 5 3 2 3<br />
85 years and over 2 8 1 7 2 5 4 3<br />
Source: Commonwealth Health Center<br />
Table 2 .12 Reg ister ed Dea ths by Month: 1 992 to 1997<br />
Year<br />
Month 1997 1996 1995 1994 1993 1992<br />
Total 147 165 170 137 164 157<br />
First six months 67 86 91 75 70 76<br />
January 11 18 14 12 19 11<br />
February 17 14 13 16 12 17<br />
March 9 11 21 14 10 15<br />
April 13 11 10 15 8 13<br />
May 12 22 14 11 9 12<br />
June 5 10 19 7 12 8<br />
Second six months 80 79 79 62 94 81<br />
July 17 21 11 10 13 21<br />
August 11 14 22 10 16 13<br />
September 14 7 15 9 14 10<br />
October 15 13 15 11 17 12<br />
November 12 11 9 9 17 10<br />
December 11 13 7 13 17 15<br />
Source: Commonwealth Health Center, Vital Statistics<br />
Central Statistics Division, Department of Commerce
<strong>1998</strong> CNMI <strong>Statistical</strong> <strong>Yearbook</strong>, Chapter 2 Page 23<br />
Table 2 .13 Reg ister ed Infant Dea ths by Month: 1 992 to 1997<br />
Month 1997 1996 1995 1994 1993 1992<br />
Year<br />
Total 8 12 11 10 16 15<br />
First six months 2 9 5 5 10 9<br />
January 0 1 0 0 3 1<br />
February 0 2 0 1 4 2<br />
March 0 0 4 1 0 3<br />
April 1 2 1 2 1 1<br />
May 0 3 0 1 0 0<br />
June 1 1 0 0 2 2<br />
Second six months 6 3 6 5 6 6<br />
July 2 2 1 1 0 2<br />
August 1 0 3 0 2 2<br />
September 1 1 1 1 1 0<br />
October 1 0 0 2 0 0<br />
November 1 0 1 1 2 0<br />
December 0 0 0 0 1 2<br />
Source: Commonwealth Health Center<br />
Note: Infant deaths are deaths under 1 year, exclusive of fetal deaths.<br />
Table 2 .14 Selected Causes of Death in CNMI: 1992 to 1996<br />
Cause of Death 1996 1995 1994 1993 1992<br />
Total 82 116 91 34 50<br />
Heart disease 8 14 16 8 10<br />
Malignant and benign neoplasms 16 23 19 0 10<br />
Accidents of all types 13 22 17 5 8<br />
Cerebrovascular disease 12 16 17 10 15<br />
Prematurity 5 2 0 0 0<br />
Pneumonia and influenza 5 11 6 11 0<br />
Homicide 5 11 1 0 0<br />
Chronic obstructive pulmonary 2 2 3 0 0<br />
Nephritis, nephrosis 2 2 4 0 0<br />
Diabetes mellitus 7 8 4 0 0<br />
Suicide 7 4 2 0 7<br />
Essential hypertension 0 1 2 0 0<br />
Source: Commonwealth Health Center<br />
Central Statistics Division, Department of Commerce
Chapter 3<br />
EDUCATION
Page 26 <strong>1998</strong> CNMI <strong>Statistical</strong> <strong>Yearbook</strong>, Chapter 3<br />
Summary of Education<br />
The number of students enrolled in schools in the CNMI has<br />
steadily increased. For School Year 96-97 the total student<br />
enrollment was 11,753. School-age population increased<br />
because of (1) natural growth in population, (2) migration into the<br />
CNMI, and (3) programming changes in the CNMI Public School<br />
System. In school year 1990-91 all public elementary schools<br />
integrated grade K (kindergarten). Prior to SY 90-91 only<br />
Tanapag, San Vicente, Rota and Tinian elementaries had grade<br />
K. Also, during school year 90-91, grade 7 from all Saipan public<br />
elementary schools moved to Hopwood Jr. High and grade 9<br />
moved from Hopwood to Marianas High School. In addition,<br />
Headstart program increased enrollment in school year 1990-91<br />
due to increased funding.<br />
The increased student population is also evident in the private<br />
schools. Since SY 1981-82, nine new private schools opened their<br />
doors and the rate of increase in total enrollment in private<br />
schools was more than the rate of increase in public schools in<br />
the 80s. Since SY 92-93, private schools total enrollment has been<br />
about 20 percent of total CNMI student enrollment.<br />
The lower grade levels continue to account for the largest<br />
proportion of total student enrollment. Transfers and dropouts<br />
tend to increase, as students move into higher grade levels.<br />
Again, the larger proportion of the lower grade levels is<br />
evidenced by the number of new private schools serving this<br />
portion of the student population.<br />
As expected, the number of teachers and teacher aides have<br />
increased to meet the rising demand for teaching and classroom<br />
assistance. Also, the number of school teachers with advance<br />
degrees increased.<br />
The student population, like the CNMI total population, is<br />
multi-ethnic. There are more single ethnic groups now and the<br />
number of students in each ethnic group is increasing.<br />
Tables in this chapter present details on student population in<br />
the CNMI in recent years.<br />
Central Statistics Division, Department of Commerce
<strong>1998</strong> CNMI <strong>Statistical</strong> <strong>Yearbook</strong>, Chapter 3 Page 27<br />
Table 3 .1 Beginning of School Year Student Enrollment, by School a nd<br />
School Yea r: SY 1992-93 to SY 1996-97<br />
School Year<br />
School 1996-97 1995-96 1994-95 1993-94 1992-93<br />
Total Enrollment 11,753 11,198 10,749 10,239 9,750<br />
Public Schools 9,054 8,813 8,565 8,208 7,731<br />
Percent 77.0 78.7 79.7 80.2 79.3<br />
Headstart 590 560 510 498 423<br />
Elementary Schools<br />
G.T. Camacho 337 338 301 287 238<br />
Tanapag 356 331 318 299 271<br />
Garapan 881 872 875 853 766<br />
San Vicente 1,018 891 894 756 743<br />
Oleai 492 467 468 454 425<br />
W.S. Reyes 790 767 812 788 724<br />
San Antonio 337 313 312 287 250<br />
Koberville 375 330 324 332 363<br />
Tinian 330 319 302 298 317<br />
Rota 347 337 309 312 314<br />
Secondary Schools<br />
Hopwood Jr. High 1,039 1,115 1,057 1,046 945<br />
Tinian Jr. High 84 94 108 98 97<br />
Rota Jr. High 104 95 79 116 92<br />
Marianas High 1,638 1,661 1,603 1,517 1,523<br />
Tinian High 163 157 124 124 108<br />
Rota High 173 166 169 143 132<br />
Private schools 2,699 2,385 2,184 2,031 2,019<br />
Percent 23.0 21.3 20.3 19.8 20.7<br />
Mt. Carmel School 703 561 538 550 599<br />
Saipan Community School 226 222 225 226 224<br />
Grace Christian Academy 789 751 663 569 533<br />
Marianas Baptist Academy 87 65 70 73 56<br />
Calvary Christian Academy 150 124 121 110 110<br />
Sister Remedios Pre School 293 265 220 201 212<br />
Joshua Generation Academy (3) 22 ... ... ... ...<br />
7th Day Adventist 96 84 89 86 83<br />
San Francisco De Borja, Rota 132 151 136 104 107<br />
Smith Pre School, Rota ... ... ... 71 68<br />
Whispering Palms 41 40 41 28 27<br />
Northern Marianas Academy (1) 46 33 25 13 ...<br />
Saipan International (2) 114 89 56 ... ...<br />
Source: Public School System<br />
Note:(1) Northern Marianas Acad. opened in SY 1993-94; hence, no data for prior school years<br />
(2) Saipan Int'l opened in SY 1994-95; (3)Joshua Generation Acad. opened in SY1996-97.<br />
Total Enrollment<br />
The number of students enrolled in schools in<br />
the CNMI has steadily increased. School-age<br />
population increased because of (1) natural<br />
growth in population, (2) migration into the<br />
CNMI, and (3) programming changes in the<br />
CNMI Public School System. In school year<br />
1990-91 all public elementary schools<br />
integrated grade K (kindergarten); prior to SY<br />
90-91 only Tanapag, San Vicente, Rota and<br />
Tinian elementaries had grade K. Also, during<br />
school year 90-91, grade 7 from all Saipan<br />
public elementary schools moved to Hopwood<br />
Jr. High and grade 9 moved from Hopwood to<br />
Marianas High School. In addition, Headstart<br />
program increased enrollment in school year<br />
1990-91 due to increased funding.<br />
Figure 3.1 Recent Enrollment Trend for PSS<br />
Headstart, Elementary, and<br />
Secondary Levels, SY 92-93 to SY<br />
96-97<br />
Number of Students<br />
Thousands<br />
6<br />
5<br />
4<br />
3<br />
2<br />
1<br />
Elementary<br />
Secondary<br />
Private Sch.<br />
Headstart<br />
0<br />
92-93 93-94 94-95 95-96 96-97<br />
School Years<br />
Central Statistics Division, Department of Commerce
Page 28 <strong>1998</strong> CNMI <strong>Statistical</strong> <strong>Yearbook</strong>, Chapter 3<br />
Total Enrollments in Public and<br />
In Private Schools<br />
Since the School Year 1992-93, total student<br />
enrollment in private schools has remained at<br />
about 20 percent of the total CNMI student<br />
enrollment; the rest of the CNMI students<br />
(about 80 percent) were enrolled in the CNMI<br />
Public schools. In School Year 1996-97,<br />
private schools enrollment has increased to 23<br />
percent of the total student enrollment.<br />
Figure 3.2 Percent of Total Enrollment in Public<br />
and in Private Schools, SY 92-93 to<br />
SY 96-97<br />
Percent<br />
100<br />
80<br />
60<br />
40<br />
20<br />
0<br />
Private schools<br />
Public<br />
92-93 93-94 94-95 95-96 96-97<br />
School Year<br />
Enrollment by Grade Levels<br />
The lower grade levels continue to account for<br />
the largest proportion of total student<br />
enrollment. Transfers and dropouts tend to<br />
increase, as students move into higher grade<br />
levels. Again, the larger proportion of the lower<br />
grade levels is evidenced by the number of new<br />
private schools serving this portion of the<br />
student population.<br />
Table 3 .2 Student Enrollm ent by Gra de Level: SY 1 992-93 to SY 1996-9 7<br />
School Year<br />
Grade 1996-97 1995-96 1994-95 1993-94 1992-93<br />
Total Enrollment 11,753 11,198 10,749 10,239 9,750<br />
Headstart 798 802 688 637 423<br />
Grade K 1,059 933 949 971 1,143<br />
Grade 1 1,110 1,024 1,054 1,004 877<br />
Grade 2 1,021 1,004 1,011 878 849<br />
Grade 3 1,056 1,015 873 845 766<br />
Grade 4 1,005 849 845 788 782<br />
Grade 5 864 824 786 756 756<br />
Grade 6 837 790 776 733 700<br />
Grade 7 842 870 803 804 844<br />
Grade 8 755 729 734 748 557<br />
Grade 9 770 751 685 590 595<br />
Grade 10 620 658 556 537 567<br />
Grade 11 589 482 513 514 491<br />
Grade 12 427 467 476 434 400<br />
Public School System<br />
Total 9,054 8,813 8,565 8,208 7,731<br />
Headstart 590 560 510 498 423<br />
Grade K 636 600 640 646 679<br />
Grade 1 880 783 817 781 688<br />
Grade 2 781 781 798 705 641<br />
Grade 3 819 810 703 664 602<br />
Grade 4 792 687 678 633 634<br />
Grade 5 687 665 634 630 602<br />
Grade 6 668 639 645 607 565<br />
Grade 7 639 711 666 648 703<br />
Grade 8 588 593 578 612 431<br />
Grade 9 620 609 564 495 512<br />
Grade 10 491 563 470 468 487<br />
Grade 11 498 405 451 442 427<br />
Grade 12 365 407 411 379 337<br />
Private Schools<br />
Total 2,699 2,385 2,184 2,031 2,019<br />
Pre-School 208 242 178 139 _<br />
Grade K 423 333 309 325 464<br />
Grade 1 230 241 237 223 189<br />
Grade 2 240 223 213 173 208<br />
Grade 3 237 205 170 181 164<br />
Grade 4 213 162 167 155 148<br />
Grade 5 177 159 152 126 154<br />
Grade 6 169 151 131 126 135<br />
Grade 7 203 159 137 156 141<br />
Grade 8 167 136 156 136 126<br />
Grade 9 150 142 121 95 83<br />
Grade 10 129 95 86 69 80<br />
Grade 11 91 77 62 72 64<br />
Grade 12 62 60 65 55 63<br />
Source: Public School System<br />
Note: Private Schools Grade K figures include pre-school pupils in years prior to SY 1993-94<br />
Central Statistics Division, Department of Commerce
<strong>1998</strong> CNMI <strong>Statistical</strong> <strong>Yearbook</strong>, Chapter 3 Page 29<br />
Table 3 .3 P SS Hea dsta rt P upils a nd Sta ff by Center: SY 1 993- 94 to SY 1 996-97<br />
Number of Pupils<br />
Number of Staff<br />
Center '96-97 '95-96 '94-95 '93-94 '96-97 '95-96 '94-95 '93-94<br />
Total 590 560 510 498 48 56 51 51<br />
Saipan 500 460 410 350 38 46 41 40<br />
San Roque (Paupau) 20 ... ... 11 2 ... ... 2<br />
Tanapag 60 60 60 26 4 6 6 4<br />
Garapan 40 40 60 67 4 4 5 8<br />
Oleai 40 40 44 32 3 4 5 5<br />
San Vicente 40 40 22 103 2 4 3 6<br />
Dan Dan 60 60 60 0 6 6 6 0<br />
Susupe 20 20 20 10 2 2 2 2<br />
Chalan Kanoa 100 120 42 37 9 12 4 5<br />
San Antonio 80 80 60 47 6 8 6 5<br />
Kagman 40 ... ... ... ... ... ... ...<br />
CK- Peer Program ... ... 22 7 ... ... 2 2<br />
SA- Peer Program ... ... 20 10 ... ... 2 1<br />
Tinian 40 40 40 76 4 4 4 5<br />
Enrollment in Headstart Program<br />
The number of kids enrolled in the Headstart<br />
Program/Pre-School has steadily increased,<br />
from 423 in the School Year 1992-93 to 798<br />
in the School Year 96-97.<br />
Figure 3.3 Total Enrollment for PSS Headstart,<br />
SY 92-93 to SY 96-97<br />
Number of Pupils<br />
600<br />
450<br />
300<br />
150<br />
Rota 50 60 60 72 6 6 6 6<br />
Source: Public Shool System<br />
Note: (1) Dan Dan Center opened in SY 1994-95; hence, no data for prior school years<br />
Since SY1995-96 Peer program mainstream with regular headstart program.<br />
Kagman and Paupau centers opened in SY1996-97.<br />
0<br />
'92-93<br />
'94-95<br />
'93-94 '95-96<br />
School Year<br />
'96-97<br />
Table 3 .4 Num ber of Gradua tes, Public Seconda ry Schools:<br />
SY 81-8 2 to SY 96-97<br />
School Number of Graduates Percent Change<br />
Year 8th 12th 8th 12th<br />
1996-97 497 309 4.4 -4.0<br />
1995-96 476 322 17.0 0.9<br />
1994-95 407 319 -20.2 -2.7<br />
1993-94 510 328 52.2 33.9<br />
1992-93 335 245 30.9 9.9<br />
1991-92 256 223 -17.7 2.3<br />
1990-91 311 218 11.5 -12.8<br />
1989-90 279 250 -4.8 22.5<br />
1988-89 293 204 -12.0 -29.2<br />
1987-88 333 288 -28.1 5.1<br />
1986-87 463 274 40.3 14.6<br />
1985-86 330 239 -7.3 0.0<br />
1984-85 356 239 1.7 0.8<br />
1983-84 350 237 -22.4 -10.6<br />
1982-83 451 265 40.5 18.8<br />
1981-82 321 223 ... ...<br />
Source: Public School System Annual Report<br />
Note: Beginning SY1990-91, 8th graders graduate from Hopwood Jr. High, while<br />
9th graders moved to Marianas High.<br />
Number of PSS Graduates<br />
The number of students graduating from high<br />
schools and junior high schools fluctuated from<br />
year to year and reached a high in SY 1993-94.<br />
Since SY 1990-91, the number of junior high<br />
graduates is for 8th grade instead of 9th grade.<br />
Figure 3.4 Number of High School and Junior<br />
High School Graduates from PSS,<br />
SY 81-82 to SY 96-97<br />
Number of students<br />
550<br />
500<br />
450<br />
400<br />
350<br />
300<br />
250<br />
200<br />
150<br />
81-2<br />
83-4<br />
85-6<br />
8th<br />
12th<br />
87-8<br />
89-0<br />
91-2<br />
93-4<br />
95-6<br />
96-7<br />
School year<br />
Central Statistics Division, Department of Commerce
Page 30 <strong>1998</strong> CNMI <strong>Statistical</strong> <strong>Yearbook</strong>, Chapter 3<br />
Number of Teachers<br />
As expected, the number of teachers and<br />
teacher aides have increased to meet the rising<br />
demand for teaching and classroom assistance.<br />
Except for SY 1996-97, the number of teacher<br />
aides declined.<br />
Ta ble 3.5 Num ber of Teacher s a nd Tea cher Aides by School a nd School Yea r :<br />
SY 1 993 -94 to SY 19 96 -9 7<br />
School<br />
Teachers<br />
Teacher Aides<br />
'96-97 '95-96 '94-95 '93-94 '96-97 '95-96 '94-95 '93-94<br />
All Teachers 597 571 528 451 140 161 139 85<br />
Public School Teachers 441 421 400 335 131 155 135 77<br />
Elementary School Teachers 260 239 218 183 100 128 111 64<br />
G.T. Camacho 18 15 13 9 4 5 5 2<br />
Tanapag 22 18 17 14 10 10 12 3<br />
Garapan 41 40 38 33 14 15 15 6<br />
San Vicente 41 35 32 24 11 18 17 6<br />
Oleai 27 24 19 17 18 20 17 6<br />
W.S. Reyes 38 38 37 31 9 10 9 8<br />
San Antonio 17 17 14 14 7 6 6 5<br />
Koblerville 19 20 16 17 9 12 13 2<br />
Tinian Elem 19 17 14 12 6 17 0 10<br />
Rota Elem. 18 15 18 12 12 15 17 16<br />
High School Teachers 181 182 182 152 31 27 24 13<br />
Hopwood Junior High 50 50 54 47 17 17 13 10<br />
Tinian Jr. High 4 4 4 6 0 1 5 1<br />
Rota Jr. High 8 7 10 7 4 0 0 0<br />
Marianas High 85 85 80 73 6 6 4 1<br />
Tinian High 14 14 15 9 1 1 0 0<br />
Rota High 20 22 19 10 3 2 2 1<br />
Private School Teachers 156 150 128 116 9 6 4 8<br />
Saipan 139 130 115 105 9 6 4 6<br />
Sister Remedios Pre Sch 13 12 12 11 4 2 2 2<br />
Joshua Generation Academy (1) 4 ... ... ... 1 ... ... ...<br />
Mt. Carmel School 38 43 35 37 0 0 0 0<br />
Grace Christian, Saipan 38 36 28 26 0 0 0 0<br />
Marianas Baptist Academy 5 4 3 3 0 0 0 0<br />
Seventh Day Adventist 5 6 8 5 1 1 0 1<br />
Northern Marianas Academy 5 1 1 0 0 0 0 0<br />
Saipan Community 12 12 12 10 2 1 1 1<br />
Saipan International 7 5 4 0 1 2 1 0<br />
Calvary Christian 8 7 7 7 0 0 0 0<br />
Whispering Palms 4 4 5 2 0 0 0 0<br />
Smith Pre School ... ... ... 4 ... ... ... 2<br />
Rota<br />
San Francisco De Borja 11 15 9 8 0 0 0 2<br />
Tinian<br />
Grace Christian Academy 6 5 4 3 0 0 0 0<br />
Source: Public School System<br />
Note : (1) Joshua Gen. Aca. opened in SY96-97.<br />
Central Statistics Division, Department of Commerce
<strong>1998</strong> CNMI <strong>Statistical</strong> <strong>Yearbook</strong>, Chapter 3 Page 31<br />
Table 3.6 Students Enr olled in School by Ethnicity and School Yea r:<br />
SY1 991- 92 to 1996-97<br />
School Year<br />
Ethnicity 1996-97 1995-96 1994-95 1993-94 1992-93 1991-92<br />
All Ethnicities 8,465 8,250 8,047 7,709 1,711 8,485<br />
Chamorro 4,862 4,825 4,627 4,360 746 4,748<br />
Carolinian 974 979 1,028 975 260 877<br />
Chamolinian 293 327 364 276 0 0<br />
American 73 58 84 100 39 248<br />
Palauan 417 441 449 456 151 492<br />
Pohnpeian 160 147 159 148 93 178<br />
Yapese 74 50 47 53 12 54<br />
Chuukese 336 323 299 331 93 261<br />
Marshallese 37 37 28 24 21 38<br />
Filipino 852 801 749 733 92 679<br />
Korean 136 136 149 163 72 406<br />
Japanese 2 1 6 10 21 75<br />
Other 249 125 58 80 111 429<br />
Source: Public School System<br />
Note: Total in this table differ from totals in other tables: Headstart and Special<br />
Education ethnic breakdown were not included and the tabulations of<br />
total by ethnicity were done at different times during the school year.<br />
Total Enrollment by Ethnicity<br />
The student population, like the CNMI total<br />
population, is multi-ethnic. There are more<br />
single ethnic groups now and the number of<br />
students in each ethnic group are increasing.<br />
Figure 3.5 Total Enrollment by<br />
Ethnicity, SY 96-97<br />
Ethnicity<br />
Chamorro<br />
Carolinian<br />
Chamolinian<br />
Filipino<br />
Palauan<br />
Chuukese<br />
Pohnpeian<br />
Korean<br />
Yapese<br />
Percent<br />
0 20 40 60 80 100<br />
3.5<br />
4.9<br />
4.0<br />
1.9<br />
1.6<br />
0.9<br />
11.5<br />
10.1<br />
57.4<br />
American<br />
Marshallese<br />
Japanese<br />
Other<br />
0.9<br />
0.4<br />
0.0<br />
2.9<br />
Table 3 .7 Student-Tea cher Ra tio by School Level :<br />
School Years 1992-9 3 to 1996 -97<br />
School Year<br />
1996-97 1995-96 1994-95 1993-94 1992-93<br />
Student-Teacher Ratio<br />
Student-teacher ratio was slightly lower in<br />
private schools than in public schools in School<br />
Year 1992-93 through 1996-97.<br />
Total 20 19 19 18 17<br />
Public 19 20 19 18 18<br />
Elementary (1-6) 20 21 21 19 18<br />
Junior High (7-8) 20 21 18 19 21<br />
High School (9-12) 17 16 17 16 15<br />
Private 17 16 16 17 16<br />
Elementary 19 18 18 20 18<br />
Secondary 14 12 14 14 16<br />
Source : Public School System<br />
Central Statistics Division, Department of Commerce
Page 32 <strong>1998</strong> CNMI <strong>Statistical</strong> <strong>Yearbook</strong>, Chapter 3<br />
Table 3.8 Educational Ba ck gr ound of Teachers: SY 1991-92,<br />
SY 1 993- 94 , SY 1995-96, and 1 996- 97<br />
School Year<br />
Educational Attainment 1996-97 1995-96 1993-94 1991-92<br />
Total 441 422 432 423<br />
Associate of Arts 26 27 63 63<br />
Associate of Science 0 0 10 11<br />
Bachelor of Art 173 175 155 157<br />
Bachelor of Science 131 113 107 101<br />
Master of Art 109 104 81 79<br />
Master of Science 0 0 10 8<br />
Doctorate Degree, Phd 2 3 6 4<br />
Source: Research Information & Training Center, PSS<br />
Note: SY92-93 and SY94-95 data not available.<br />
Northern Marianas College<br />
Since its establishment in 1982, average<br />
semester enrollment at the Northern Marianas<br />
College has steadily increased from an average<br />
of 226 in SY 82-83 to a high of 1,132 per<br />
semester in SY 93-94. From SY 94-95 the<br />
average number of enrollment has declined<br />
from 901to a low of 580 in SY 96-97.<br />
Table 3 .9 Nor thern Maria na s College Enrollm ent:<br />
SY1982 -83 to SY1 996-97<br />
Semester<br />
School Year Average Fall Spring Summer<br />
1996-97 580 379 669 691<br />
1995-96 845 1,001 979 555<br />
1994-95 901 1,072 1,054 577<br />
1993-94 1,132 1,369 1,324 704<br />
1992-93 1,019 1,143 1,191 722<br />
1991-92 927 978 1,113 690<br />
1990-91 737 727 953 530<br />
1989-90 485 446 588 420<br />
1988-89 360 370 419 291<br />
1987-88 379 390 465 281<br />
1986-87 447 469 546 325<br />
1985-86 411 358 473 403<br />
1984-85 400 438 391 370<br />
1983-84 226 152 247 280<br />
1982-83 73 ... ... 73<br />
Source: Northern Marianas College<br />
Table 3 .10 Deg rees Awarded fr om Northern Maria nas College:1992 to 1997<br />
Degree 1997 1996 1995 1994 1993 1992<br />
Total 247 167 108 100 73 81<br />
Associate of Arts 114 86 76 58 20 36<br />
Associate of Applied Science 26 20 21 25 18 17<br />
Associate of Science 6 0 0 0 0 2<br />
Certificates 91 47 11 9 31 19<br />
Bachelor of Arts ( University of Guam) 10 14 0 8 4 7<br />
Masters of Arts ( San Diego State University) 0 0 0 0 0 0<br />
Source: Northern Mariana Islands College<br />
Central Statistics Division, Department of Commerce
<strong>1998</strong> CNMI <strong>Statistical</strong> <strong>Yearbook</strong>, Chapter 3 Page 33<br />
Table 3 .11 Educationa l Atta inm ent: 1990 and 1995<br />
Percent<br />
Change<br />
Number 1990 to Percent<br />
Educational Attainment 1995 1990 1995 1995 1990<br />
Total 25 yrs & over 34,802 24,633 41.3 100.0 100.0<br />
No school 278 291 -4.5 0.8 1.2<br />
Elementary: 1 to 4 yrs 599 799 -25.0 1.7 3.2<br />
5 to 6 yrs 1,517 1,969 -23.0 4.4 8.0<br />
7 years 393 434 -9.4 1.1 1.8<br />
8 years 1,590 792 100.8 4.6 3.2<br />
High school: 1 to 3 yrs 3,332 2,922 14.0 9.6 11.9<br />
4yrs., no diploma 724 1,094 -33.8 2.1 4.4<br />
High school graduate,<br />
includ. equivalency 13,106 8,659 51.4 37.7 35.2<br />
Some college, no degree 4,396 2,627 67.3 12.6 10.7<br />
College: 1 to 3 yrs 2,708 1,191 127.4 7.8 4.8<br />
4 + yrs 6,159 3,855 59.8 17.7 15.6<br />
Source: 1990 CPH-6-CNMI Table 13, and 1995 Mid-Decade Census Table 17<br />
Educational Attainment<br />
Higher proportion of 25 years old and over had<br />
a high school or equivalent education in 1995<br />
compared to 1990. But this may be due to the<br />
presence of migrant workers, most of whom<br />
have high school diplomas or equivalent.<br />
Table 3 .12 Fem ale Educa tional Attainm ent: 1 990 and 1995<br />
Percent<br />
Change<br />
Number 1990 to Percent<br />
Educational Attainment 1995 1990 1995 1995 1990<br />
Females 25 yrs & over 16,617 10,188 63.1 100.0 100.0<br />
No school 160 156 2.6 1.0 1.5<br />
Elementary: 1 to 4 yrs 346 410 -15.6 2.1 4.0<br />
5 to 6 yrs 771 749 2.9 4.6 7.4<br />
7 years 183 169 8.3 1.1 1.7<br />
8 years 1,054 376 180.3 6.3 3.7<br />
High school: 1 to 3 yrs 2,015 1,407 43.2 12.1 13.8<br />
4 yrs no diploma 332 571 -41.9 2.0 5.6<br />
High school graduate,<br />
includ. equivalency 6,043 3,333 81.3 36.4 32.7<br />
Some college, no degree 1,734 908 91.0 10.4 8.9<br />
College: 1 to 3 yrs 1,132 530 113.6 6.8 5.2<br />
4 + yrs 2,847 1,579 80.3 17.1 15.5<br />
Source: 1990 CPH-6-CNMI Table 13, and 1995 Mid-Decade Census Table 17<br />
Central Statistics Division, Department of Commerce
Page 34 <strong>1998</strong> CNMI <strong>Statistical</strong> <strong>Yearbook</strong>, Chapter 3<br />
Table 3 .13 Male Educa tional Attainm ent: 1 990 and 1995<br />
Percent<br />
Change<br />
Number 1990 to Percent<br />
Educational Attainment 1995 1990 1995 1995 1990<br />
Males 25 yrs & over 18,185 14,445 25.9 100.0 100.0<br />
No school 118 135 -12.6 0.6 0.9<br />
Elementary: 1 to 4 yrs 253 389 -35.0 1.4 2.7<br />
5 to 6 yrs 746 1,220 -38.9 4.1 8.4<br />
7 years 210 265 -20.8 1.2 1.8<br />
8 years 536 416 28.8 2.9 2.9<br />
High school: 1 to 3 yrs 1,317 1,515 -13.1 7.2 10.5<br />
4 yrs no diploma 392 523 -25.0 2.2 3.6<br />
High school graduate,<br />
includ. equivalency 7,063 5,326 32.6 38.8 36.9<br />
Some college, no degree 2,662 1,719 54.9 14.6 11.9<br />
College: 1 to 3 yrs 1,576 661 138.4 8.7 4.6<br />
4 + yrs 3,312 2,276 45.5 18.2 15.8<br />
Source: 1990 CPH-6-CNMI, Table 13 and 1995 Mid-Decade Census Table 17<br />
Table 3.14 Num ber of Gra duates, P r ivate Seconda ry Schools:<br />
SY 1995-96 a nd SY 1996-97<br />
Year<br />
Schools 1996-97 1995-96<br />
% Change<br />
Total 192 175 9.7<br />
Junior High (8th) 126 123 2.4<br />
Mt. Carmel Jr. High 64 57 12.3<br />
Saipan Community School 20 23 -13.0<br />
Grace Christian Academy 28 29 -3.4<br />
Seventh Day Adventist 9 8 12.5<br />
Whispering Palms 5 6 -16.7<br />
High School (12 th) 66 52 26.9<br />
Mt. Carmel High 32 15 113.3<br />
Northern Marianas Academy 10 5 100.0<br />
Grace Christian Academy 24 25 -4.0<br />
Marianas Baptist Academy 0 6 -100.0<br />
Calvary Christian Academy 0 1 0.0<br />
Source: Board of Education, Non Public School Representative<br />
Central Statistics Division, Department of Commerce
<strong>1998</strong> CNMI <strong>Statistical</strong> <strong>Yearbook</strong>, Chapter 3 Page 35<br />
Tabel 3.15 Num ber of Gra dua tes Fr om P r ivate Seconda ry Schools:<br />
SY 1984 - 85 to SY 1996-97<br />
School Number of Graduates Percent Change<br />
Year 8th 12th 8th 12th<br />
1996-97 126 66 2.4 21.2<br />
1995-96 123 52 -12.2 -28.8<br />
1994-95 138 67 17.4 16.4<br />
1993-94 114 56 ... ...<br />
1992-93 ... ... ... ...<br />
1991-92 69 36 -37.7 0.0<br />
1990-91 95 36 48.4 5.6<br />
1989-90 49 34 46.9 5.9<br />
1988-89 26 32 -215.4 15.6<br />
1987-88 82 27 11.0 25.9<br />
1986-87 73 20 -2.7 -35.0<br />
1985-86 75 27 26.7 14.8<br />
1984-85 55 23 ... ...<br />
Source: Public School System<br />
Note: "..." means not available.<br />
Number of Graduates<br />
from Private Schools<br />
Although not as numerous as the number of<br />
graduates from the Public School System,<br />
graduates from the private schools are now a<br />
significant number.<br />
Central Statistics Division, Department of Commerce
Chapter 4<br />
LABOR FORCE<br />
AND<br />
EMPLOYMENT
Page 38 <strong>1998</strong> CNMI <strong>Statistical</strong> <strong>Yearbook</strong>, Chapter 4<br />
Labor Force and Employment Summary<br />
Between 1990 and 1995, the CNMI labor force participation went<br />
from about 82 percent of all persons 16 years and older to over<br />
85 percent in 1995. Of the 37,540 persons in labor force in 1995,<br />
about 93 percent were employed, 7.3 percent were unemployed,<br />
compared to only 2.3 in 1990.<br />
In 1995, Filipino was the largest single ethnic group in the<br />
CNMI labor force: twice over the number of Chamorros, the third<br />
largest single ethnic group in the labor force. This is a dramatic<br />
shift from 1980 when Chamorro was the largest ethnic group in<br />
the labor force and Filipino was about one third the size of<br />
Chamorro.<br />
Employment in the private sector in the CNMI almost has the<br />
same distribution between 1990 and 1995. In 1995, almost 83<br />
percent of all workers worked for private companies, over 14<br />
percent worked for the Government, and 2.5 percent were selfemployed.<br />
Similarly, in 1990 about 85 percent of the work force<br />
worked for private companies and over 13 percent worked in the<br />
government.<br />
In absolute numbers, workers increased in all industries from<br />
1980 to 1995. However, from 1990 to 1995 workers in some<br />
industries increased more than in others: workers in the<br />
manufacturing industry increased the most, followed by workers<br />
in the retail trade and personal entertainment and recreational<br />
services.<br />
Males outnumbered females in the labor force in 1995, as<br />
was true in 1990 and 1980. Also, a greater proportion of males<br />
than females, 16 years and older, participated in the labor force.<br />
Central Statistics Division, Department of Commerce
<strong>1998</strong> CNMI <strong>Statistical</strong> <strong>Yearbook</strong>, Chapter 4 Page 39<br />
As expected, a higher level of education is associated with<br />
higher participation in the labor force. In 1995, 85.1 percent of<br />
persons with 8 years of education were in the labor force, while<br />
89.7 percent of persons with high school education (12 years) and<br />
93.5 percent of persons with bachelor degrees were in the labor<br />
force.<br />
The vast majority (93.7 percent) of workers worked full-time, 35<br />
or more hours a week.<br />
Disaggregating the CNMI unemployment by ethnic group<br />
revealed that in 1995, Japanese had the lowest unemployment<br />
rate at 3.5 percent, Carolinians had the highest unemployment<br />
rate at 21.2 percent and the Chamorros unemployment rate was<br />
12.5 percent.<br />
There was a distinct pattern in male-female composition by<br />
industry in 1995: males were concentrated in construction, while<br />
females were concentrated in manufacturing, professional and<br />
related services.<br />
In 1995, the majority of CNMI workers were in Saipan where<br />
most business establishments were (are still) located.<br />
Workers of Chamorro and Carolinian ethnic groups were<br />
concentrated in public administration and professional and<br />
related services and retail trade industries. Filipinos were<br />
dominant in personal entertainment & recreational services and<br />
construction industries; Chinese were dominant in the<br />
manufacturing industry, and Koreans were dominant in the retail<br />
trade and manufacturing industries.<br />
The number of work permits issued to nonresidents increased<br />
from 1989 to 1991. The number declined in 1992 through 1994,<br />
but remained above the 1989 level. Filipinos, by far, constitute the<br />
largest number of permit holders from a single country; Chinese<br />
steadily increased to become the second largest number of<br />
permit holders; Koreans declined while Japanese and Thais<br />
fluctuated in numbers but these constituted a small number of the<br />
total permits issued. In recent years, permit renewals constituted<br />
the majority of all permits issued. Transfers and extension-type<br />
permits are relatively small portions of the total permits issued<br />
annually.<br />
By industry, large number of work permits were issued to<br />
workers in service industries, manufacturing, and construction.<br />
By occupation, most of the work permits were issued to workers in<br />
structural work, benchwork, services, professional and technical<br />
occupations.<br />
Central Statistics Division, Department of Commerce
Page 40 <strong>1998</strong> CNMI <strong>Statistical</strong> <strong>Yearbook</strong>, Chapter 4<br />
Figure 4.1<br />
Number of Persons in the Labor<br />
Force in the CNMI in 1980 and<br />
1990, and 1995.<br />
Table 4 .1 La bor Force P a rticipa tion by Island: 1990 and 1 995<br />
1995<br />
Labor Force 1990 Total Saipan Rota Tinian N. Isl.<br />
40<br />
30<br />
20<br />
26,589<br />
37,540<br />
Persons 16+ years 32,522 43,846 39,642 2,500 1,697 7<br />
Labor force 26,589 37,540 33,993 2,089 1,456 2<br />
Percent 81.8 85.6 85.7 83.6 85.8 28.6<br />
U.S. Armed Forces 8 0 0 0 0 0<br />
Civilian labor force 26,581 37,540 33,993 2,089 1,456 2<br />
Employed 25,965 34,812 31,560 1,869 1,382 1<br />
Unemployed 616 2,728 2,433 220 74 1<br />
Percent 2.3 7.3 7.2 10.5 5.1 50.0<br />
Not in labor force 5,933 6,306 5,649 411 241 5<br />
Source: 1990 CPH-6-CNMI Table 15, and 1995 Mid-Decade Census Table 19<br />
10<br />
0<br />
6,102<br />
1980 1990 1995<br />
Labor Force Participation<br />
Between 1990 and 1995, the CNMI labor<br />
force went through a transformation:<br />
• In 1990, about 82 percent of all persons 16<br />
years and older participated in the labor<br />
force, compared to about 85 percent in<br />
1995.<br />
• Of the 37,540 persons in labor force in<br />
1995, about 93% were employed, over<br />
7% were unemployed.<br />
• Tinian had the highest labor force<br />
participation, followed by Saipan and then<br />
Rota.<br />
• Male labor force participation rate was<br />
higher than the female, both in 1995 and<br />
1990.<br />
Unemployment<br />
Census Years<br />
The CNMI unemployment rate (7.3%) in<br />
1995 was higher than in 1990.<br />
The female unemployment rate (8.6%) was<br />
higher than the male's unemployment rate<br />
(5.8%) in 1995.<br />
By island, Tinian had the lowest<br />
unemployment of 5.1% in 1995, followed<br />
by Saipan (7.2%), then Rota (10.5%).<br />
Table 4 .2 Male La bor For ce P a rticipa tion by Isla nd: 1 990 and 1995<br />
1995<br />
Labor Force 1990 Total Saipan Rota Tinian N. Isl.<br />
Males 16+ years 17,266 21,635 19,225 1,489 917 4<br />
Labor force 15,096 19,398 17,258 1,311 827 2<br />
Percent 87.4 89.7 89.8 88.0 90.2 50.0<br />
U.S. Armed Forces 6 0 0 0 0 1<br />
Civilian labor force 15,090 19,398 17,258 1,311 827 2<br />
Employed 14,782 18,268 16,272 1,192 803 1<br />
Unemployed 308 1,130 986 119 24 1<br />
Percent 2.0 5.8 5.7 9.1 2.9 50.0<br />
Not in labor force 2,170 2,237 1,967 178 90 2<br />
Source: 1990 CPH-6-CNMI Table 15, and 1995 Mid-Decade Census Table 19<br />
Table 4 .3 Fem ale La bor For ce P a rticipa tion by Isla nd: 1 990 and 1995<br />
1995<br />
Labor Force 1990 Total Saipan Rota Tinian N. Isl.<br />
Females 16+ years 15,256 22,211 20,417 1,011 780 3<br />
Labor force 11,493 18,033 16,638 767 628 0<br />
Percent 75.3 81.2 81.5 75.9 80.5 ...<br />
U.S. Armed Forces 2 0 0 0 0 0<br />
Civilian labor force 11,491 18,033 16,638 767 628 0<br />
Employed 11,183 16,475 15,225 672 578 0<br />
Unemployed 308 1,558 1,413 95 50 0<br />
Percent 2.7 8.6 8.5 12.4 8.0 ...<br />
Not in labor force 3,763 4,178 3,779 244 152 3<br />
Source: 1990CPH-6-CNMI Table 15, and 1995 Mid-Decade Census Table 19<br />
Central Statistics Division, Department of Commerce
<strong>1998</strong> CNMI <strong>Statistical</strong> <strong>Yearbook</strong>, Chapter 4 Page 41<br />
Table 4 .4 Fem ales with Own Children in La bor For ce: 1990 a nd 1 995<br />
Percent<br />
Change<br />
Number 1990 to Percent<br />
Labor Force 1995 1990 1995 1995 1990<br />
Females, 16 + yrs 22,211 15,256 45.6 100.0 100.0<br />
With own child < 18 yrs 7,185 3,914 83.6 32.3 25.7<br />
In the labor force 4,989 2,349 112.4 22.5 15.4<br />
Percent 69.4 60.0 ... ... ...<br />
With own child < 6 yrs 3,616 2,414 49.8 16.3 15.8<br />
In the labor force 2,555 1,452 76.0 11.5 9.5<br />
Percent 70.7 60.1 ... ... ...<br />
With own child 6 yrs<br />
to 17 yrs. only 3,569 1,500 137.9 16.1 9.8<br />
In the labor force 2,434 897 171.3 11.0 5.9<br />
Percent 68.2 59.8 ... ... ...<br />
Source: 1990 CPH-6-CNMI Table 15, and 1995 Mid-Decade Census Table 68<br />
Women with Children in Labor<br />
Force<br />
Women without children in 1995 declined as<br />
proportion of total female population; however,<br />
a higher proportion of women with children<br />
were in the labor force in 1995 compared to<br />
1990.<br />
The presence of female migrant workers with<br />
no children greatly influenced the declined<br />
proportion of women with children in labor<br />
force in the CNMI.<br />
Table 4.5 P ersons in La bor For ce by Educa tiona l Atta inm ent: 1995<br />
Percent in the Labor Force<br />
Educational Attainment Total Males Females<br />
Total in labor force (16 yrs & over) 85.3 89.7 81.0<br />
Elementary<br />
0 to 7yrs 66.4 89.0 50.3<br />
8 years 85.1 83.3 85.8<br />
High school<br />
1 year 84.0 81.6 85.0<br />
2 years 70.2 76.2 64.2<br />
3 years 64.3 67.5 61.9<br />
4 yrs. no diploma 68.5 75.8 61.0<br />
High school graduate 89.7 94.1 85.2<br />
College<br />
Some college, no degree 88.1 91.7 83.1<br />
Associate degree, Occupational program 93.2 96.3 88.3<br />
Associate degree, Academic program 88.0 92.9 83.5<br />
Bachelor's degree 93.5 96.0 90.8<br />
Graduate or professional degree 91.8 92.9 90.1<br />
Source: 1995 Mid-Decade Census Table 115<br />
Educational Attainment and<br />
Labor Force Participation<br />
As expected, higher level of education is<br />
positively related with labor force participation,<br />
as shown in table 4.5. In 1995, 85.1% of<br />
those with 8 years of education were in the<br />
labor force while 89.7% of those with high<br />
school diploma were in the labor force.<br />
Central Statistics Division, Department of Commerce
Page 42 <strong>1998</strong> CNMI <strong>Statistical</strong> <strong>Yearbook</strong>, Chapter 4<br />
Labor Force by Ethnicity<br />
Filipino was the largest single ethnic group in<br />
the Labor Force in 1995, followed by<br />
Chinese, Chamorro, White, Koreans,<br />
Palauans, Carolinians, then the rest:<br />
CNMI Labor Force<br />
by Ethnicity in 1 995<br />
Ethinic Group<br />
Number in<br />
Labor Force<br />
Total 37,540<br />
Filipino 16,548<br />
Chinese 6,436<br />
Chamorro 5,716<br />
White 1,384<br />
Korean 1,219<br />
Palauan 1,041<br />
Carolinian 907<br />
Japanese 746<br />
Chuukese 541<br />
Pohnpeian 298<br />
Yapese 129<br />
Marshallese 51<br />
Kosraean 26<br />
Black 13<br />
Other Asian 1,151<br />
Other Pac. Is. 58<br />
Other Single Ethnic Group 43<br />
Multiple Ethnic 1,233<br />
Figure 4.2 Employment by Class of Worker in<br />
the CNMI in 1995<br />
Ta ble 4 .6 Ethnicity by La bor Force Pa r ticipa tion: 1 995<br />
Chamorro<br />
Carolinian<br />
Labor Force All Single Multiple Single Multiple Fili-<br />
Participation Persons Total Response Response Total Response Response pino<br />
Total 16 + yrs 43,846 9,231 8,235 996 1,739 1,521 218 17,354<br />
In the labor force 37,540 6,390 5,716 674 1,036 907 129 16,548<br />
Percent 85.6 69.2 69.4 67.7 59.6 59.6 59.2 95.4<br />
Civilian labor force 37,540 6,390 5,716 674 1,036 907 129 16,548<br />
Employed 34,812 5,551 5,004 547 825 715 110 15,958<br />
Work 35+ hrs 32,545 4,973 4,504 469 718 617 101 15,122<br />
Work part-time 1,102 344 291 53 54 47 7 307<br />
Percent 3.3 6.5 6.1 10.2 7.0 7.1 6.5 2.0<br />
Unemployed 2,728 839 712 127 211 192 19 590<br />
Percent 7.3 13.1 12.5 18.8 20.4 21.2 14.7 3.6<br />
Not in labor force 6,306 2,841 2,519 322 703 614 89 806<br />
Source: 1995 Mid-Decade Census Table 113<br />
Ta ble 4 .7 Ethnicity by La bor Force Pa r ticipa tion: 1 990<br />
Chamorro<br />
Carolinian<br />
Labor Force All Single Multiple Single Multiple Fili-<br />
Participation Persons Total Response Response Total Response Response pino<br />
Total 16 + yrs 32,522 7,429 6,961 468 1,723 1,473 250 13,261<br />
In the labor force 26,589 4,593 4,316 277 954 805 149 12,476<br />
Percent 81.8 61.8 62.0 59.2 55.4 54.7 59.6 94.1<br />
Civilian labor force 26,581 4,588 4,312 276 954 805 149 12,475<br />
Employed 25,965 4,317 4,060 257 852 717 135 12,379<br />
Work 35+ hrs 24,573 3,909 3,681 228 757 630 127 11,955<br />
Work part-time 975 318 296 22 78 70 8 291<br />
Percent 3.8 7.5 7.4 8.8 9.3 10.0 5.9 2.4<br />
Unemployed 616 271 252 19 101 88 13 96<br />
Percent 2.3 5.9 5.8 6.9 10.6 10.9 8.7 0.8<br />
Not in labor force 5,933 2,836 2,645 191 769 668 101 785<br />
Source: 1990 CPH-6-CNMI Table 73<br />
Unpaid family worker<br />
0.2%<br />
Persons 16 yrs and over<br />
Self-employed<br />
2.5%<br />
Government<br />
14.4%<br />
Private<br />
82.8%<br />
Ta ble 4.8 Cla ss of Worker: 1 990 a nd 1 995<br />
Percent<br />
Change<br />
Number 1990 to Percent<br />
Employed Persons 1995 1990 1995 1995 1990<br />
Total 16 yrs & over 34,812 25,965 34.1 100.0 100.0<br />
Private wage and salary 28,841 22,027 30.9 82.8 84.8<br />
Government 5,018 3,510 43.0 14.4 13.5<br />
Self-employed 866 382 126.7 2.5 1.5<br />
Unpaid family worker 87 46 89.1 0.2 0.2<br />
Source: 1990 CPH-6-CNMI Table 16, and 1995 Mid-Decade Census Table 21<br />
Central Statistics Division, Department of Commerce
<strong>1998</strong> CNMI <strong>Statistical</strong> <strong>Yearbook</strong>, Chapter 4 Page 43<br />
Ta ble 4 .9 Work ers by Industry : 1 980 , 1 99 0, a nd 19 95<br />
Number<br />
Percent<br />
Industry 1995 1990 1980 1995 1990 1980<br />
Employed 16 yrs and over 34,812 25,965 5,941 100.0 100.0 100.0<br />
Agriculture, fishing, and mining 557 700 126 1.6 2.7 2.1<br />
Construction 3,489 5,767 1,000 10.0 22.2 16.8<br />
Manufacturing 7,770 5,688 110 22.3 21.9 1.9<br />
Nondurable goods 7,636 5,514 79 21.9 21.2 1.3<br />
Durable goods 134 174 31 0.4 0.7 0.5<br />
Transportation 1,729 1,178 352 5.0 4.5 5.9<br />
Communications 356 457 165 1.0 1.8 2.8<br />
Wholesale trade 518 365 101 1.5 1.4 1.7<br />
Retail trade 5,462 3,090 818 15.7 11.9 13.8<br />
Finance, insurance & real estate 723 518 163 2.1 2.0 2.7<br />
Business and repair services 2,042 837 181 5.9 3.2 3.0<br />
Personal entertainment & recreation 940 3,897 760 2.7 15.0 12.8<br />
Professional and related services 3,116 2,059 895 9.0 7.9 15.1<br />
Health 663 510 234 1.9 2.0 3.9<br />
Education 1,541 1,033 491 4.4 4.0 8.3<br />
Other professional 761 516 170 2.2 2.0 2.9<br />
Public administration 2,552 1,409 1,264 7.3 5.4 21.3<br />
Subsistence 0 0 6 0.0 0.0 0.1<br />
Source: PC80-1-C/D57A Table 23, and 1990 CPH-6-CNMI Table 69, and 1995 Mid-Decade Census Table 21<br />
Figure 4.3<br />
Type of Industry<br />
Manufacturing<br />
Retail trade<br />
Construction<br />
Professional and relate<br />
Public administration<br />
Business and repair ser<br />
Transportation<br />
Personal entertainmen<br />
Finance, insurance & r<br />
Agriculture, fishing, an<br />
Wholesale trade<br />
Communications<br />
Total Workers by Industry in the<br />
CNMI in 1995<br />
Workers<br />
Thousands<br />
0 1 2 3 4 5 6 7 8 9<br />
Table 4 .10 Male Work ers by Industry: 1 980, 1 990, and 1995<br />
Number Percent<br />
Industry 1995 1990 1980 1995 1990 1980<br />
Employed males 16 yrs and over 18,337 14,782 3,902 100.0 100.0 100.0<br />
Agriculture, fishing, and mining 515 677 119 2.8 4.6 3.0<br />
Construction 3,356 5,556 972 18.3 37.6 24.9<br />
Manufacturing 1,793 1,341 82 9.8 9.1 2.1<br />
Nondurable goods 1,680 1,206 54 9.2 8.2 1.4<br />
Durable goods 117 135 28 0.6 0.9 0.7<br />
Transportation 1,250 898 290 6.8 6.1 7.4<br />
Communications 251 362 128 1.4 2.4 3.3<br />
Wholesale trade 368 280 78 2.0 1.9 2.0<br />
Retail trade 2,435 1,340 353 13.3 9.1 9.0<br />
Finance, insurance & real estate 339 273 67 1.8 1.8 1.7<br />
Business and repair services 1,526 648 153 8.3 4.4 3.9<br />
Personal entertainment & recreation 678 1,539 336 3.7 10.4 8.6<br />
Professional and related services 1,326 902 412 7.2 6.1 10.6<br />
Health 251 195 104 1.4 1.3 2.7<br />
Education 597 429 222 3.3 2.9 5.7<br />
Other professional 478 278 86 2.6 1.9 2.2<br />
Public administration 1,798 966 907 9.8 6.5 23.2<br />
Subsistence 0 0 5 0.0 0.0 0.1<br />
Source: PC80-Table 23, and 1990 CPH-Table 69, and 1995 Mid-Decade Census, Table 21<br />
Male Work Force Distribution<br />
by Industry<br />
The male work force distribution by industry<br />
shifted from census year to census year.<br />
In 1995, 18.3 percent of the male work force<br />
were in the construction industry, 13.3 percent<br />
were in the retail trade industry, and 9.8 percent<br />
were in the manufacturing and public<br />
administration, respectively.<br />
In 1990, 37.6 percent of the male work force<br />
were in the construction industry, 10.4 percent<br />
were in the personal entertainment and<br />
recreation industry, 9.1 percent were in the<br />
manufacturing industry.<br />
In 1980, 24.9 percent of the male work force<br />
were in the construction industry, 23.2 percent<br />
were in the public administration industry, 10.6<br />
percent were in the professional and related<br />
services industry.<br />
Central Statistics Division, Department of Commerce
Page 44 <strong>1998</strong> CNMI <strong>Statistical</strong> <strong>Yearbook</strong>, Chapter 4<br />
Female Work Force Distribution<br />
by Industry<br />
Similarly, the female work force distribution by<br />
industry shifted from census year to census<br />
year.<br />
In 1995, 36.3 percent of the female work<br />
force were in the manufacturing industry, 18.4<br />
percent were in the retail trade industry, and<br />
10.9 percent were in the professional and<br />
related services industry.<br />
In 1990, almost 39 percent of the female work<br />
force were in manufacturing, 21.1 percent<br />
were in the personal entertainment and<br />
recreation industry, 15.6 percent were in the<br />
retail trade industry, and 10.3 percent were in<br />
the professional and related services industry.<br />
In 1980, 23.7 percent of the female work<br />
force were in the professional and related<br />
service industry, 22.8 percent were in the retail<br />
trade industry, 20.8 percent were in the<br />
personal entertainment and recreation industry,<br />
17.5 percent were in public administration.<br />
Table 4 .1 1 Fem ale Work ers by Industry: 1980, 1990, and 1995<br />
Number Percent<br />
Industry 1995 1990 1980 1995 1990 1980<br />
Employed Females 16 yrs and over 16,475 11,183 2,039 100.0 100.0 100.0<br />
Agriculture, fishing, and mining 42 23 7 0.3 0.2 0.3<br />
Construction 133 211 28 0.8 1.9 1.4<br />
Manufacturing 5,977 4,347 28 36.3 38.9 1.4<br />
Nondurable goods 5,956 4,308 25 36.2 38.5 1.2<br />
Durable goods 17 39 3 0.1 0.3 0.1<br />
Transportation 479 280 62 2.9 2.5 3.0<br />
Communications 105 95 37 0.6 0.8 1.8<br />
Wholesale trade 150 85 23 0.9 0.8 1.1<br />
Retail trade 3,027 1,750 465 18.4 15.6 22.8<br />
Finance, insurance & real estate 384 245 96 2.3 2.2 4.7<br />
Business and repair services 516 189 28 3.1 1.7 1.4<br />
Personal entertainment & recreation 262 2,358 424 1.6 21.1 20.8<br />
Professional and related services 1,790 1,157 483 10.9 10.3 23.7<br />
Health 412 315 130 2.5 2.8 6.4<br />
Education 944 604 269 5.7 5.4 13.2<br />
Other professional 357 238 84 2.2 2.1 4.1<br />
Public administration 754 443 357 4.6 4.0 17.5<br />
Subsistence 0 0 1 0.0 0.0 0.0<br />
Source: PC80, Table 23, and 1990 CPH, Table 69, and 1995 Mid-Decade Census Table 21<br />
Employment by Island<br />
In 1995, the vast majority of all workers in the<br />
CNMI were (still are) in Saipan, where most<br />
businesses are located and where the large<br />
majority of population live.<br />
Table 4 .12 Industry Employment by Isla nd: 1995<br />
Island<br />
Industry Total Saipan & N. Isl. Rota Tinian<br />
Employed 16 yrs and over 34,812 31,561 1,869 1,382<br />
Agriculture, fishing, mining 557 422 48 87<br />
Construction 3,489 3,039 307 143<br />
Manufacturing 7,770 7,745 16 9<br />
Nondurable goods 7,636 7,622 9 5<br />
Durable goods 134 123 7 4<br />
Transportation 1,729 1,586 63 80<br />
Communications 356 341 6 9<br />
Utilities and Sanitation Services 455 395 29 31<br />
Wholesale trade 518 503 6 9<br />
Retail trade 5,462 5,091 214 157<br />
Finance, insurance & real estate 723 696 16 11<br />
Buisness and repair 2,042 1,889 80 73<br />
Personal entertainment and<br />
recreation services 940 814 74 52<br />
Professional and related services 3,116 2,695 242 179<br />
Health 663 576 45 42<br />
Educational services 1,541 1,301 142 98<br />
Other professional services 761 678 47 36<br />
Public Administration 2,552 1,832 319 401<br />
Source: 1995 Mid-Decade Census Table 21<br />
Central Statistics Division, Department of Commerce
<strong>1998</strong> CNMI <strong>Statistical</strong> <strong>Yearbook</strong>, Chapter 4 Page 45<br />
Ta ble 4 .13 Industry Employment by Selected Ethnicity: 1995<br />
Single Ethnic Group<br />
Percent<br />
Cham- Caro- Cham- Caro- Fili- Chi- Kor-<br />
Industry orro linian Filipino Chinese Korean orro linian pino nese ean<br />
Employed 16 yrs and over 5,004 715 15,958 5,909 1,169 100.0 100.0 100.0 100.0 100.0<br />
Agriculture, fishing, forestry 28 0 286 65 2 0.6 0.0 1.8 1.1 0.2<br />
Mining and construction 72 6 3,199 109 84 1.4 0.8 20.0 1.8 7.2<br />
Manufacturing 146 50 1,269 5,009 322 2.9 7.0 8.0 84.8 27.5<br />
Transportation 328 42 546 21 148 6.6 5.9 3.4 0.4 12.7<br />
Communications & public utilities 306 60 209 8 7 6.1 8.4 1.3 0.1 0.6<br />
Wholesale trade 105 8 277 14 18 2.1 1.1 1.7 0.2 1.5<br />
Retail trade 579 79 3,185 415 328 11.6 11.0 20.0 7.0 28.1<br />
Finance, insurance & real estate 203 9 289 14 41 4.1 1.3 1.8 0.2 3.5<br />
Business and repair services 102 12 1,430 70 47 2.0 1.7 9.0 1.2 4.0<br />
Personal entertainmt & recreation 286 72 4,465 161 124 5.7 10.1 28.0 2.7 10.6<br />
Professional and related services 1,103 201 654 19 46 22.0 28.1 4.1 0.3 3.9<br />
Public administration 1,746 176 149 4 2 34.9 24.6 0.9 0.1 0.2<br />
Source: 1995 Mid-Decade Census Table 128<br />
Distribution of Selected Ethnic<br />
Groups<br />
Over Industry in 1995<br />
Chamorros<br />
• 34.9% were in the public administration<br />
industry,<br />
• 22.0% were in the professional and related<br />
services,<br />
• 11.6% were in the retail trade,<br />
• 6.6% were in the transportation.<br />
Carolinians<br />
• 28.1% were in professional and related<br />
services,<br />
• 24.6% were in the Public administration<br />
industry,<br />
• 11.0% were in the retail trade industry,<br />
• 10.1% were in the personal entertainment<br />
& recreation industry.<br />
Filipino<br />
28.0% were in the personal entertainment &<br />
recreation industry,<br />
20.0% were in the mining and construction<br />
industry,<br />
Table 4 .14 Occupa tional Em ploym ent by Island: 1995<br />
Island<br />
Occupation Total Saipan & N. Isl. Rota Tinian<br />
Employed 16 yrs and over 34,812 31,560 1,869 1,382<br />
Managerial and professional spclty 6,932 6,136 410 386<br />
Executive, administrative 4,405 3,997 221 187<br />
Professional 2,527 2,139 189 199<br />
Technical, sales and Admin. support 5,726 5,240 263 223<br />
Technician 413 353 35 25<br />
Sales 2,579 2,424 83 72<br />
Administrative support 2,290 2,093 111 86<br />
Service 6,795 6,140 379 276<br />
Private household 1,763 1,511 132 120<br />
Protective services 1,176 1,054 65 57<br />
Other services 3,856 3,575 182 99<br />
Farming, forestry and fishing 1,078 706 291 81<br />
Precision production craft & repair 4,855 4,302 350 203<br />
Operators, fabricators, and laborer 9,425 9,036 176 213<br />
Machine operator, assembler 6,922 6,814 50 58<br />
Transportation and material move 995 878 70 47<br />
Handlers, equip cleaners, laborer 1,508 1,344 56 108<br />
Source: 1995 Mid-Decade Census Table 20<br />
20.0% were in the retail industry<br />
Chinese<br />
84.8% were in the manufacturing industry<br />
7.0% were in the retail trade industry<br />
Korean<br />
28.1% were in the retail trade industry,<br />
27.5% were in the manufacturing industry,<br />
12.7% were in the transportation industry,<br />
10.6% were in the personal entertainment &<br />
recreation industry.<br />
Central Statistics Division, Department of Commerce
Page 46 <strong>1998</strong> CNMI <strong>Statistical</strong> <strong>Yearbook</strong>, Chapter 4<br />
Male-Female Employment Pattern<br />
There was a distinct pattern in male-female<br />
employment by industry in 1990 and 1995:<br />
males were concentrated in construction, while<br />
females were concentrated in manufacturing,<br />
personal entertainment & recreational services.<br />
In some industries, the number of males and<br />
females are somewhat even.<br />
Males far outnumber females in the<br />
Constructions, Communications and<br />
Transportation, Public Administration, and<br />
Wholesale industries.<br />
Females far outnumber the males in the<br />
Manufacturing, Personal entertainment &<br />
Recreation industries.<br />
Table 4 .15 Industry Employment by Sex: 1 990 and 1995<br />
1995 1990<br />
Industry Total Male Female Total Male Female<br />
Employed 16 yrs. and over 34,812 18,337 16,475 25,965 14,782 11,183<br />
Agriculture, fishing, forestry 419 387 32 700 677 23<br />
Mining and construction 3,627 3,484 143 5,767 5,556 211<br />
Manufacturing 7,770 1,797 5,973 5,688 1,341 4,347<br />
Communications, transportation 2,085 1,418 667 1,635 1,260 375<br />
Wholesale trade 518 368 150 365 280 85<br />
Retail trade 5,462 2,435 3,027 3,090 1,340 1,750<br />
Finance, insurance & real estate 723 339 384 518 273 245<br />
Business and repair services 2,042 1,526 516 837 648 189<br />
Personal entertainmt & recreation 3,910 2,471 1,439 3,897 1,539 2,358<br />
Professional and related services 3,116 1,326 1,790 2,059 902 1,157<br />
Public administration 2,552 1,798 754 1,409 966 443<br />
Source: 1990 CPH-6-CNMI Table 69, and 1995 Mid-Decade Census Table 128<br />
Figure 4.4 Number of Permits Issued to Non-<br />
Resident Workers, 1992 to 1997<br />
Table 4 .16 Non-Resident Work P erm its Issued by<br />
Na tionality: 1989 - 1997<br />
No. of permits<br />
Thousands<br />
40<br />
30<br />
20<br />
10<br />
0<br />
36,566<br />
26,039<br />
24,301<br />
23,027 22,766 22,560<br />
1992 1993 1994 1995 1996 1997<br />
Year<br />
Chi- Fil- Jap- Kor-<br />
Year Total nese ipino anese ean Thai Other<br />
1997 36,566 16,024 16,730 770 884 615 1,543<br />
1996 26,039 10,048 13,021 661 553 588 1,168<br />
1995 24,301 7,616 14,091 645 502 604 843<br />
1994 22,560 5,184 15,160 628 450 620 518<br />
1993 22,766 5,991 14,858 613 505 519 280<br />
1992 23,027 5,186 15,812 565 700 519 245<br />
1991 26,143 4,570 18,940 584 1,094 606 349<br />
1990 21,857 3,728 14,762 506 1,748 694 419<br />
1989 18,411 2,184 11,786 484 2,933 778 246<br />
Source: LIIDS, Department of Labor & Immigration<br />
Note: 1995 data not official.<br />
Central Statistics Division, Department of Commerce
<strong>1998</strong> CNMI <strong>Statistical</strong> <strong>Yearbook</strong>, Chapter 4 Page 47<br />
Table 4 .17 Non-Resident Work P erm its Issued by Sector,<br />
CNMI: 1992 to 1997<br />
Calendar Year<br />
Employment Sector 1997 1996 1995 1994 1993 1992<br />
Total 36,566 26,039 24,301 22,560 22,766 23,027<br />
Banking 52 53 58 62 59 32<br />
Construction 4,780 3,878 3,581 3,283 3,619 4,374<br />
Garment 12,889 8,498 7,212 5,926 6,808 6,245<br />
Hotels 2,231 1,946 2,156 2,366 2,339 2,254<br />
Government 23 30 137 244 299 300<br />
Private households 2,548 1,869 2,267 2,665 2,559 2,716<br />
Services 13,883 9,763 8,889 8,014 7,083 7,106<br />
Not stated 160 2 1 0 0 0<br />
Source: LIID, Department of Labor & Immigration<br />
Note: 1995 data not official.<br />
Table 4 .18 P er mits Issued to Non-Resident Workers<br />
by Na tionality a nd Sex:1996<br />
Total Chi- Fili- Jap- Kor- Thai-<br />
Employment Sector Total nese pino anese ean land Others<br />
Total 26,039 10,048 13,021 661 553 588 1,168<br />
Male 12,386 2,517 7,955 421 334 90 1,069<br />
Female 13,653 7,531 5,066 240 219 498 99<br />
Banking 53 - 50 1 - - 2<br />
Male 20 - 18 1 - - 1<br />
Female 33 - 32 - - - 1<br />
Construction 3,878 994 2,602 19 34 11 218<br />
Male 3,781 970 2,532 19 32 11 217<br />
Female 97 24 70 - 2 - 1<br />
Garment 8,498 7,509 342 1 123 507 16<br />
Male 1,095 881 67 1 82 50 14<br />
Female 7,403 6,628 275 - 41 457 2<br />
Hotels 1,946 99 1,556 158 52 8 73<br />
Male 1,294 42 1,038 118 36 5 55<br />
Female 652 57 518 40 16 3 18<br />
Government 30 1 21 1 - - 7<br />
Male 23 1 17 1 - - 4<br />
Female 7 - 4 - - - 3<br />
Private households 1,869 41 1,674 1 - 15 138<br />
Male 516 10 387 1 - 4 114<br />
Female 1,353 31 1,287 - - 11 24<br />
Services 9,763 1,404 6,775 480 344 47 713<br />
Male 5,656 613 3,896 280 184 20 663<br />
Female 4,107 791 2,879 200 160 27 50<br />
Not stated 2 - 1 - - - 1<br />
Male 1 - - - - - 1<br />
Female 1 - 1 - - - -<br />
Source: Labor Division, Department of Labor & Immigration<br />
Figure 4.5<br />
No. of permits<br />
100000<br />
10000<br />
1000<br />
100<br />
Number of Permits Issued by<br />
Nationality, 1992 to 1997<br />
'92 '93 '94 '95 '96 '97<br />
Year<br />
Note: The Y axis is scaled in log to show<br />
the graph of each series clearly.<br />
Filipino<br />
Chinese<br />
Japanese<br />
Korean<br />
Thai<br />
Other<br />
Central Statistics Division, Department of Commerce
Page 48 <strong>1998</strong> CNMI <strong>Statistical</strong> <strong>Yearbook</strong>, Chapter 4<br />
Figure 4.6 Number of Permits Issued by<br />
Occupational category, FY1997<br />
Table 4 .19 : Non-Resident Work Applications Submitted, Issued by<br />
Nationality and Industry: Fiscal Yea r 19 97<br />
Hotels<br />
6.1%<br />
Government<br />
0.1%<br />
Private households<br />
7.0%<br />
Garment<br />
35.2%<br />
Construction<br />
13.1%<br />
Banking<br />
0.1%<br />
Not stated<br />
0.4%<br />
Services<br />
38.0%<br />
Bang- Chi- Jap- Kor- Nep- Philip- Thai-<br />
Industry Total ladesh nese anese ean alese pines land Others<br />
Total 42,542 933 17,324 1,007 1,063 303 20,590 787 535<br />
Banking 29 0 0 0 0 0 29 0 0<br />
Construction 5,891 189 1,844 9 50 6 3,624 49 120<br />
Garment 13,811 27 12,426 3 229 5 458 629 34<br />
Hotel 2,817 13 150 206 86 111 2,181 5 65<br />
Government 32 2 2 1 0 14 0 13<br />
Private HH 2,942 202 108 2 1 59 2,532 27 11<br />
Restaurant 2,930 7 964 72 80 10 1,711 23 63<br />
Services 14,057 493 1,829 709 607 112 10,024 54 229<br />
Unclassified 33 0 1 5 10 0 17 0 0<br />
Source: LIID, Department of Labor and Immigration<br />
Table 4.20 Non-Resident Work Permits Issued by Sector, Nationality<br />
and Sex, CNMI: CY1997<br />
F i gure 4.7 Non resident Work Permits<br />
Issued by Nationality, 1997<br />
Filipino<br />
67.2%<br />
Chinese<br />
22.9%<br />
Other<br />
1.4%<br />
Bangladeshi<br />
1.0%<br />
Korean<br />
2.0%<br />
Thai<br />
2.7%<br />
Japanese<br />
2.8%<br />
Chi- Fil- Jap- Kor- Thai-<br />
Employment Sector Total nese ipino anese ean land Others<br />
Total 36,566 16,024 16,730 770 884 615 1,543<br />
Male 16,565 4,203 9,837 484 550 152 1,339<br />
Female 20,001 11,821 6,893 286 334 463 204<br />
Banking 52 - 50 - - - 2<br />
Male 18 - 18 - - - -<br />
Female 34 - 32 - - - 2<br />
Construction 4,780 1,482 2,973 7 44 42 232<br />
Male 4,637 1,444 2,875 7 39 42 230<br />
Female 143 38 98 - 5 - 2<br />
Garment 12,889 11,842 348 2 193 466 38<br />
Male 1,808 1,502 79 2 130 64 31<br />
Female 11,081 10,340 269 - 63 402 7<br />
Hotels 2,231 114 1,726 186 72 6 127<br />
Male 1,493 41 1,147 143 43 4 115<br />
Female 738 73 579 43 29 2 12<br />
Government 23 2 9 1 - - 11<br />
Male 15 2 6 - - - 7<br />
Female 8 - 3 1 - - 4<br />
Private households 2,548 91 2,178 3 1 25 250<br />
Male 723 41 453 2 - 10 217<br />
Female 1,825 50 1,725 1 1 15 33<br />
Services 13,883 2,481 9,366 560 526 75 875<br />
Male 7,794 1,169 5,224 326 310 32 733<br />
Female 6,089 1,312 4,142 234 216 43 142<br />
Not stated 160 12 80 11 48 1 8<br />
Male 77 4 35 4 28 - 6<br />
Female 83 8 45 7 20 1 2<br />
Source: Department of Labor & Immigration<br />
Central Statistics Division, Department of Commerce
<strong>1998</strong> CNMI <strong>Statistical</strong> <strong>Yearbook</strong>, Chapter 4 Page 49<br />
Ta ble 4.21 : Non-Resident Work Permits Issued by Na tiona lity a nd<br />
Industry: Fisca l Yea r 19 97<br />
Bang- Chi- Jap- Kor- Nep- Philip- Thai-<br />
Industry Total ladesh nese anese ean alese pines land Others<br />
Figure 4.8 Work Permits Issued to Non-<br />
Resident Workers by Ethnicity in<br />
FY1997: By Percentage<br />
Filipino<br />
48.1%<br />
Total 37,638 943 15,440 889 878 235 18,121 688 444<br />
Banking 32 ... ... ... ... ... 31 ... 1<br />
Construction 5,274 182 1,765 12 43 6 3,125 45 96<br />
Garment 12,126 26 10,936 2 195 7 389 548 23<br />
Hotel 2,568 11 122 208 76 56 2,041 5 49<br />
Government 19 ... 2 1 ... ... 7 ... 9<br />
Private HH 2,733 216 98 2 ... 52 2,335 22 8<br />
Restaurant 2,656 6 855 49 62 10 1,589 22 63<br />
Services 12,216 502 1,660 615 497 104 8,597 46 195<br />
Unclassified 14 ... 2 ... 5 ... 7 ... ...<br />
Source: LIID, Department of Labor and Immigration<br />
Chinese<br />
41.0%<br />
Other<br />
1.8%<br />
Bangladeshi<br />
2.5%<br />
Korean<br />
2.3%<br />
Thai<br />
1.8%<br />
Japanese<br />
2.4%<br />
Ta ble 4 .22 P ermits Issued to Non-Resident Workers<br />
by Industry a nd Na tiona lity :1993<br />
Fili- Chi- Jap- Kor- Bang-<br />
Industry Category Total pino nese anese Thai ean ladeshi Other<br />
Total 22,766 14,858 5,991 613 519 505 54 226<br />
Agriculture, forestry, fishing 70 57 12 0 0 0 0 1<br />
Mining and quarrying 2 2 0 0 0 0 0 0<br />
Construction 3,749 3,535 104 16 21 40 1 32<br />
Manufacturing 7,002 949 5,309 3 478 224 0 39<br />
Transportation and utilities 187 160 2 17 0 6 0 2<br />
Wholesale trade 73 60 4 5 0 3 0 1<br />
Retail trade 2,975 2,507 265 104 4 73 2 20<br />
Finance, insurance, real estate 98 88 2 4 0 2 0 2<br />
Services 6,008 5,326 141 357 5 85 42 52<br />
Public administration 16 14 0 1 0 0 0 1<br />
Uncoded (SIC) 2,586 2,160 152 106 11 72 9 76<br />
Source: Department of Labor & Immigration<br />
Central Statistics Division, Department of Commerce
Chapter 5<br />
HOUSEHOLD<br />
AND<br />
PERSONAL INCOME
Page 52 <strong>1998</strong> CNMI <strong>Statistical</strong> <strong>Yearbook</strong>, Chapter 5<br />
Summary of Household and Personal Income<br />
The 1995 Census results showed that household median income<br />
in the CNMI was $19,091 and household mean income was<br />
$30,296 in 1994 while family median income was $21,166 and the<br />
family mean income was $32,921.<br />
In 1994, 83.9 percent of households reported income from<br />
wages and salaries; 7.2 percent reported income from interest,<br />
dividend, and net rental; 7.2 percent reported income from self<br />
employment; 6.3 percent reported income from public assistance<br />
programs; 6.0 percent reported income from retirement; 5.3<br />
percent reported income from Social Security; and 2.3 percent<br />
reported income from remittances. Households whose primary<br />
source of income was from self-employment had the highest<br />
mean household income. Second were households with income<br />
from wages and salaries. Third were households with income<br />
from remittance.<br />
In 1994, personal median income was $6,450, i.e., half of all<br />
persons had income below $6,450 and half had income above<br />
$6,450. Mean personal income was $12,697, that same year.<br />
About 19 percent all persons with income received less than<br />
$2,500 in 1994; 34 percent received income less than $5,000;<br />
about 68 percent of all persons with income received less than<br />
$10,000 in 1994. Generally, males received higher income than<br />
females.<br />
Generally, persons born in the CNMI earned more than those<br />
born elsewhere, in 1994. Citizens and nationals of the United<br />
States, generally, earned more than non US citizens in the<br />
Commonwealth that year.<br />
For all persons employed for wages and salaries, hourly wage<br />
rates was highest among persons born in the U.S mainland,<br />
followed by persons born in Guam. Persons born in the CNMI had<br />
the third highest mean hourly wage, followed by persons born in<br />
Palau, FSM, and Asian countries, respectively.<br />
By class of worker, average hourly wage rate was highest for<br />
federal government employees, followed by local government<br />
employees, self-employed persons, and private enterprise<br />
employees, respectively.<br />
Central Statistics Division, Department of Commerce
<strong>1998</strong> CNMI <strong>Statistical</strong> <strong>Yearbook</strong>, Chapter 5 Page 53<br />
Ta ble 5.1 Household Incom e lev els by Island in 199 4<br />
Island<br />
Percentage<br />
Household Income Total Saipan Rota Tinian N. Is. Total Saipan Rota Tinian N. Is.<br />
Total 12,057 10,844 690 522 1 100.0 100.0 100.0 100.0 100.0<br />
Less than $2,500 1,501 1,365 92 44 0 12.4 12.6 13.3 8.4 0.0<br />
$2,500 to $4,999 569 524 28 17 0 4.7 4.8 4.1 3.3 0.0<br />
$5,000 to $9,999 1,609 1,494 71 44 0 13.3 13.8 10.3 8.4 0.0<br />
$10,000 to $14,999 1,441 1,331 67 42 1 12.0 12.3 9.7 8.0 100.0<br />
$15,000 to $19,999 1,090 966 64 60 0 9.0 8.9 9.3 11.5 0.0<br />
$20,000 to $24,999 1,075 953 68 54 0 8.9 8.8 9.9 10.3 0.0<br />
$25,000 to $34,999 1,440 1,265 96 79 0 11.9 11.7 13.9 15.1 0.0<br />
$35,000 to $49,999 1,407 1,229 98 80 0 11.7 11.3 14.2 15.3 0.0<br />
$50,000 to $74,999 1,055 928 71 56 0 8.8 8.6 10.3 10.7 0.0<br />
$75,000 or more 870 789 35 46 0 7.2 7.3 5.1 8.8 0.0<br />
Median (dollars) 19,091 18,537 21,691 25,000 11,250 ... ... ... ... ...<br />
Mean (dollars) 30,296 30,023 30,525 35,662 10,880 ... ... ... ... ...<br />
Source: 1995 Mid-Decade Census Table 23<br />
Household and Family Income<br />
The 1995 Census results showed that<br />
household median income was $19,091 and<br />
household mean income was $30,296 in the<br />
CNMI in 1994. Family median income was<br />
$21,166 and the family mean income was<br />
$32,921 in 1994.<br />
Table 5.2 Family Incom e Lev els by Island in 1994<br />
Number Percentage<br />
Family Income Total Saipan Rota Tinian N. Is. Total Saipan Rota Tinian N. Is.<br />
Total 8,252 7,384 461 406 1 100.0 100.0 100.0 100.0 100.0<br />
Less than $2,500 871 797 36 38 0 10.6 10.8 7.8 9.4 0.0<br />
$2,500 to $4,999 276 253 14 9 0 3.3 3.4 3.0 2.2 0.0<br />
$5,000 to $9,999 1,020 945 41 34 0 12.4 12.8 8.9 8.4 0.0<br />
$10,000 to $14,999 995 915 50 29 1 12.1 12.4 10.8 7.1 100.0<br />
$15,000 to $24,999 1,533 1,343 104 86 0 18.6 18.2 22.6 21.2 0.0<br />
$25,000 to $34,999 979 862 62 55 0 11.9 11.7 13.4 13.5 0.0<br />
$35,000 to $49,999 1,049 914 69 66 0 12.7 12.4 15.0 16.3 0.0<br />
$50,000 to $74,999 834 725 58 51 0 10.1 9.8 12.6 12.6 0.0<br />
$75,000 or more 695 630 27 38 0 8.4 8.5 5.9 9.4 0.0<br />
Median (dollars) 21,166 20,651 23,606 26,458 11,250 ... ... ... ... ...<br />
Mean (dollars) 32,921 32,517 34,940 38,032 10,880 ... ... ... ... ...<br />
Source: 1995 Mid-Decade Census Table 23<br />
Island<br />
Central Statistics Division, Department of Commerce
Page 54 <strong>1998</strong> CNMI <strong>Statistical</strong> <strong>Yearbook</strong>, Chapter 5<br />
Sources of Household Income<br />
In 1994, 83.9 percent of households<br />
reported income from wages and salaries;<br />
7.2 percent reported income from interest,<br />
dividend, and net rental; 7.2 percent<br />
reported income from self employment; 6.3<br />
percent reported income from public<br />
assistance; 6.0 percent reported income<br />
from retirement; 5.3 percent reported<br />
income from Social Security and 2.3 percent<br />
reported income from remittances.<br />
Figure 5.1<br />
Wage or Salary<br />
Sources of Household Income in<br />
1994<br />
Percent<br />
0 20 40 60 80 100<br />
83.9<br />
Table 5.3 Households Incom e Type by Isla nd in 1 994<br />
Island<br />
Income Type Total Saipan Rota Tinian N. Is.<br />
Total Households 12,057 10,844 690 522 1<br />
With Earnings 10,342 9,303 579 459 1<br />
With Wage or Salary Income 10,116 9,087 574 454 1<br />
With Self-Employment Income 863 761 58 44 0<br />
With interest, dividend,<br />
or net rental income 865 775 51 39 0<br />
With Social Security Income 718 625 57 36 0<br />
With Public Assistance Income 643 545 53 44 1<br />
With Retirement Income 763 617 87 59 0<br />
With Remittance Income 281 274 6 1 0<br />
With Other Income 135 122 7 6 0<br />
Source: 1995 Mid-Decade Census Table 23<br />
Interest, dividend, rental<br />
Self-Employment<br />
Public Assistance<br />
Retirement<br />
Social Security<br />
Remittance<br />
Other<br />
7.2<br />
7.2<br />
6.3<br />
6.0<br />
5.3<br />
2.3<br />
1.1<br />
Mean Household Income by Type<br />
Households whose primary source of<br />
income was from self-employment had the<br />
highest mean household income. Second<br />
were households with income from wages<br />
and salaries. Third highest mean household<br />
income was households with income from<br />
remittance.<br />
Table 5.4 Mean Household Income Type by Isla nd in 1994<br />
(in US $ dollars)<br />
Island<br />
Income Type Total Saipan Rota Tinian North. Is.<br />
Earnings 31,111 30,946 30,800 34,889 7,280<br />
Wage and salary 27,235 27,019 27,363 31,389 7,280<br />
Self-employement 54,352 55,676 36,670 54,941 ...<br />
Interest, dividend, net rent 19,245 18,513 28,310 22,744 ...<br />
Social Security 8,804 8,915 7,982 7,582 ...<br />
Public Assistance 5,440 4,685 4,540 21,906 3,600<br />
Retirement 14,065 14,091 11,983 18,091 ...<br />
Remittance 20,718 21,826 5,000 12,000 ...<br />
All other income 4,715 5,022 2,460 2,908 ...<br />
Source: 1995 Mid-Decade Census Table 23<br />
Central Statistics Division, Department of Commerce
<strong>1998</strong> CNMI <strong>Statistical</strong> <strong>Yearbook</strong>, Chapter 5 Page 55<br />
Table 5.5 Incom e Level by Sex in 1994, CNMI<br />
Numbers<br />
Percent<br />
Income Total Males Females Total Males Females<br />
Total 44,543 21,999 22,544 ... ... ...<br />
Total with income 32,376 17,001 15,375 100.0 100.0 100.0<br />
$1 to $2,499/loss 6,053 2,025 4,028 18.7 11.9 26.2<br />
$2,500 to $4,999 4,946 2,378 2,568 15.3 14.0 16.7<br />
$5,000 to $7,499 8,342 4,734 3,608 25.8 27.8 23.5<br />
$7,500 to $9,999 2,628 1,453 1,175 8.1 8.5 7.6<br />
$10,000 to $14,999 3,083 1,732 1,351 9.5 10.2 8.8<br />
$15,000 to $19,999 1,961 1,132 829 6.1 6.7 5.4<br />
$20,000 to $24,999 1,486 895 591 4.6 5.3 3.8<br />
$25,000 to $34,999 1,641 988 653 5.1 5.8 4.2<br />
$35,000 to $49,999 1,239 853 386 3.8 5.0 2.5<br />
$50,000 or more 997 811 186 3.1 4.8 1.2<br />
Median ($) 6,450 16,215 5,739 ... ... ...<br />
Mean ($) 12,697 15,801 9,264 ... ... ...<br />
Source: 1995 CNMI Mid-Decade Census Table 136.<br />
Personal Income<br />
In 1994, personal median income was<br />
$6,450, i.e., half of all persons reporting<br />
income had income below $6,450 and half<br />
had income above $6,450. Mean personal<br />
income was $12,697, that same year. About<br />
19 percent of all persons with income received<br />
less than $2,500 in 1994; about 26 percent<br />
received income between $5,000 and less than<br />
$7,499; almost 70 percent of all persons with<br />
income received less than $10,000 in 1994.<br />
Generally, males received higher income than<br />
females.<br />
Table 5.6 Incom e Level by Bir thplace in 1994<br />
Number<br />
Born in:<br />
Percent<br />
Born in:<br />
Income Total CNMI Philippines Other Total CNMI Philippines Other<br />
Total 44,543 10,853 17,392 16,298 ... ... ... ...<br />
Total with income 32,376 6,453 14,230 11,693 100.0 100.0 100.0 100.0<br />
$1 to $2,499/loss 6,053 421 2,421 3,211 18.7 6.5 17.0 27.5<br />
$2,500 to $4,999 4,946 434 2,944 1,568 15.3 6.7 20.7 13.4<br />
$5,000 to $7,499 8,342 694 5,310 2,338 25.8 10.8 37.3 20.0<br />
$7,500 to $9,999 2,628 442 1,469 717 8.1 6.8 10.3 6.1<br />
$10,000 to $14,999 3,083 1,031 1,079 973 9.5 16.0 7.6 8.3<br />
$15,000 to $19,999 1,961 1,021 385 555 6.1 15.8 2.7 4.7<br />
$20,000 to $24,999 1,486 678 253 555 4.6 10.5 1.8 4.7<br />
$25,000 to $34,999 1,641 812 226 603 5.1 12.6 1.6 5.2<br />
$35,000 to $49,999 1,239 557 82 600 3.8 8.6 0.6 5.1<br />
$50,000 or more 997 363 61 573 3.1 5.6 0.4 4.9<br />
Median ($) 6,450 16,204 5,685 ... ... ... ... ...<br />
Mean ($) 12,697 21,827 7,042 ... ... ... ... ...<br />
Source: 1995 CNMI Mid-Decade Census Table 136<br />
Income by Birthplace<br />
Generally, persons born in the CNMI<br />
earned more than those born elsewhere, in<br />
1994. Citizens and nationals of the United<br />
States, generally, earned more than non US<br />
citizens in the Commonwealth that year.<br />
Central Statistics Division, Department of Commerce
Page 56 <strong>1998</strong> CNMI <strong>Statistical</strong> <strong>Yearbook</strong>, Chapter 5<br />
Figure 5.2 Number of Wage and Salary earners<br />
with Annual Average earnings: 1987<br />
to 1997<br />
Table 5.7 Wage a nd Sa la ry Income, Wa ge a nd Sala ry Ea rner s,<br />
a nd Avera g e Ea rning s in CNMI : 1 980 to 1997<br />
Thousands<br />
70<br />
60<br />
50<br />
40<br />
30<br />
20<br />
10<br />
No. of W2's Filed<br />
Average<br />
Wage and No. of Average<br />
Salary Income W2's Earnings<br />
Year ($000) Filed ($)<br />
1997 581,321 57,917 10,037<br />
1996 515,774 53,157 9,703<br />
1995 464,774 51,268 9,066<br />
1994 415,444 48,368 8,589<br />
1993 384,775 48,546 7,926<br />
1992 366,972 30,613 11,987<br />
1991 322,301 47,867 6,733<br />
1990 262,251 41,531 6,315<br />
1989 209,746 35,882 5,845<br />
0<br />
'87<br />
'88<br />
'89<br />
'90<br />
'91<br />
'93<br />
'92<br />
'94<br />
'95<br />
'96<br />
'97<br />
1988 105,211 19,435 5,413<br />
1987 101,058 19,350 5,223<br />
1986 80,006 14,640 5,465<br />
1985 77,504 10,367 7,476<br />
1984 69,500 9,980 6,964<br />
1983 63,725 9,753 6,534<br />
1982 54,868 8,681 6,320<br />
1981 48,180 8,180 5,890<br />
1980 41,863 7,627 5,489<br />
Source: Division of Revenue and Taxation<br />
Note: 1992 figure is based on 1992 Current Household Report.<br />
Average Hourly Wage<br />
by Birthplace and Citizenship<br />
For all persons employed for wages and<br />
salaries, hourly wage rates was highest<br />
among persons born in the U.S mainland,<br />
followed by persons born in Guam. Persons<br />
born in the CNMI had the third highest<br />
mean hourly wage, followed by persons<br />
born in Palau, FSM, and Asian countries,<br />
respectively.<br />
Table 5.8 Average Hourly Wa g e Ra tes by Birthpla ce, and<br />
Citizenship : 1995<br />
Not a<br />
All U.S Citizen U.S Citizen<br />
Birthplace Persons or national or national<br />
All Persons 5.75 11.92 3.85<br />
CNMI 10.71 10.71 0.00<br />
Palau 7.39 8.73 7.01<br />
Federated States of Micronesia 6.00 8.13 5.63<br />
Asia 3.75 10.22 3.63<br />
Source: Unpublished 1995 Census Report<br />
Note: Values are in dollars and cents<br />
Central Statistics Division, Department of Commerce
<strong>1998</strong> CNMI <strong>Statistical</strong> <strong>Yearbook</strong>, Chapter 5 Page 57<br />
Table 5.9 Average Hourly Wa g e Ra tes by Citizenship:<br />
1990, 1 992 a nd 1995<br />
Year<br />
Citizenship 1995 1992 1990<br />
All Persons 5.75 5.02 4.60<br />
CNMI 10.71 8.94 7.38<br />
Guam ... ... 8.52<br />
United States ... 13.92 14.95<br />
Palau 7.39 5.59 4.10<br />
Federated States of Micronesia 6.00 4.67 3.60<br />
Asia 3.75 2.82 3.30<br />
Elsewhere ... 6.94 9.07<br />
Source: Unpublished Report,CNMI Central Statistics Division<br />
and CNMI Current Household Survey, 1992<br />
Ta ble 5 .10 Avera ge Hourly Wage Rates by Class of work er:<br />
1990 a nd 1992<br />
Year<br />
Class of Worker 1992 1990<br />
Employed persons 5.02 4.55<br />
Private for Profit 3.81 3.86<br />
Private not for profit 2.26 4.80<br />
Local/territorial government 9.89 8.47<br />
Federal government 10.96 11.14<br />
Self-employed, not Inc. 8.83 15.09<br />
Self-employed, Inc. 9.33 ...<br />
Source: Unpublished Report,CNMI Central Statistics Division<br />
and CNMI Current Household Survey, 1992<br />
Note: Va lues a re in dolla rs a nd cents<br />
Average Hourly Wage by Class of<br />
Worker<br />
By class of worker, average hourly wage rate<br />
was highest for federal government employees,<br />
followed by local government employees, selfemployed<br />
persons, inc.,and self employed, not<br />
inc., respectively.<br />
Table 5 .1 1 CNMI Sa lary a nd Wa ges by Sector : 1994<br />
Salary and wages ($000)<br />
Percent of Distribution<br />
Salary Range Total gov't Federal Private Total gov't Federal Private<br />
Total wages 415,444 139,258 1,467 274,718 100.0 100.0 100.0 100.0<br />
$10,000 or less 149,297 10,052 4 139,241 35.9 7.2 0.3 50.7<br />
$10,001 - $20,000 101,412 32,415 99 68,898 24.4 23.3 6.8 25.1<br />
$20,001 - $30,000 67,091 40,913 103 26,075 16.1 29.4 7.0 9.5<br />
$30,001 - $40,000 42,379 29,973 301 12,105 10.2 21.5 20.5 4.4<br />
$40,001 - $50,000 23,413 15,380 367 7,667 5.6 11.0 25.0 2.8<br />
$50,001 - over 31,852 10,525 594 20,733 7.7 7.6 40.4 7.5<br />
Source: Department of Finance<br />
Central Statistics Division, Department of Commerce
Page 58 <strong>1998</strong> CNMI <strong>Statistical</strong> <strong>Yearbook</strong>, Chapter 5<br />
Table 5.12 CNMI Wa g es and Sa la ry by Sector a nd Municipal : 1996<br />
(in US $ thousa nds)<br />
Sector Total Wages Saipan Tinian Rota<br />
Total Wages 515,774 480,410 15,805 19,550<br />
CNMI gov't 87,674 72,307 7,147 8,220<br />
Autonomous agencies 56,005 48,454 4,028 3,522<br />
Federal gov't 1,041 979 42 20<br />
Retirees 21,100 21,100 0 0<br />
Garment mfg. 92,147 92,141 0 0<br />
Hotels (rooms only) 31,775 30,852 134 786<br />
Retail 46,929 44,498 904 1,527<br />
Construction 29,230 26,946 298 1,986<br />
Banking & finance 4,016 3,175 763 78<br />
Wholesale 4,905 4,841 23 41<br />
Petroleum 477 477 0 0<br />
All others 140,476 134,640 2,466 3,371<br />
Source: Department of Finance<br />
Nutrition Assistance Program (NAP)<br />
Table 5 .13 NAP Actua l Pa rticipa tion in the CNMI by Month: FY 1996 and FY 1997<br />
Participation in the NAP decreased in 1997.<br />
Fewer households and fewer persons benefited<br />
from the Program in 1997 compared to 1996.<br />
1997 1996<br />
Month HH Individuals Benefits ($) HH Individuals Benefits ($)<br />
Total 10,575 40,153 2,982,292 12,754 46,761 3,562,636<br />
October 973 3,625 271,408 1,123 4,154 317,705<br />
November 961 3,610 268,455 1,129 4,133 314,885<br />
December 937 3,502 260,442 1,107 4,080 309,900<br />
January 886 3,335 244,196 1,079 4,017 302,591<br />
February 882 3,312 243,834 1,055 3,912 300,524<br />
March 873 3,322 244,540 1,055 3,870 295,235<br />
April 858 3,289 244,061 1,040 3,820 294,840<br />
May 848 3,266 243,183 1,038 3,806 292,402<br />
June 847 3,241 239,606 1,049 3,819 291,556<br />
July 833 3,222 240,172 1,044 3,778 287,044<br />
August 842 3,219 241,592 1,031 3,721 281,286<br />
September 835 3,210 240,803 1,004 3,651 274,668<br />
Source: Nutrition Assistance Program,Department of Community and Cultural Affairs<br />
Central Statistics Division, Department of Commerce
<strong>1998</strong> CNMI <strong>Statistical</strong> <strong>Yearbook</strong>, Chapter 5 Page 59<br />
Table 5 .14 NAP Actua l Pa rticipa tion in Sa ipan by Month: FY1 996a nd FY 1997<br />
1997 1996<br />
Month HH Individuals Benefits ($) HH Individuals Benefits ($)<br />
Total 9,853 38,015 2,827,505 11,273 42,755 3,264,142<br />
October 897 3,395 254,399 982 3,778 290,421<br />
November 890 3,396 252,572 983 3,757 286,468<br />
December 871 3,312 246,418 968 3,711 282,057<br />
January 831 3,168 231,871 944 3,630 274,253<br />
February 822 3,128 230,970 937 3,576 275,716<br />
March 817 3,153 233,102 933 3,546 271,245<br />
April 800 3,108 231,461 928 3,490 269,478<br />
May 790 3,099 231,047 928 3,488 268,069<br />
June 789 3,074 227,691 944 3,533 270,074<br />
July 777 3,059 228,376 926 3,468 264,094<br />
August 788 3,068 230,583 908 3,415 258,522<br />
September 781 3,055 229,015 892 3,363 253,745<br />
Source: Nutrition Assistance Program,Department of Community and Cultural Affairs<br />
Table 5 .15 NAP Actua l Pa rticipa tion in Rota by Month: FY1996 and FY 1997<br />
1997 1996<br />
Month HH Individuals Benefits ($) HH Individuals Benefits ($)<br />
Total 470 1,486 104,905 685 2,352 179,927<br />
October 48 156 11,552 65 229 17,066<br />
November 44 142 10,277 64 220 16,564<br />
December 41 127 9,121 66 228 17,810<br />
January 35 113 8,129 68 244 19,078<br />
February 39 128 8,822 51 196 15,671<br />
March 36 120 8,078 55 181 14,083<br />
April 38 123 8,232 56 186 14,555<br />
May 39 119 8,219 56 191 14,327<br />
June 39 120 8,224 52 179 13,251<br />
July 38 118 8,400 55 182 13,758<br />
August 36 107 7,627 50 162 12,310<br />
September 37 113 8,224 47 154 11,454<br />
Source: Nutrition Assistance Program,Department of Community and Cultural Affairs<br />
Central Statistics Division, Department of Commerce
Page 60 <strong>1998</strong> CNMI <strong>Statistical</strong> <strong>Yearbook</strong>, Chapter 5<br />
Table 5 .16 NAP Actua l Pa rticipa tion in Tinia n by Month: FY1996 and FY 1997<br />
1997 1996<br />
Month HH Individuals Benefits ($) HH Individuals Benefits ($)<br />
Total 240 633 47,794 303 853 63,940<br />
October 27 71 5,119 27 76 5,822<br />
November 26 70 5,429 25 67 5,194<br />
December 24 61 4,726 24 65 4,972<br />
January 19 53 4,099 21 56 3,616<br />
February 20 55 3,945 21 58 3,806<br />
March 19 48 3,253 27 75 5,317<br />
April 19 57 4,239 24 69 5,412<br />
May 18 47 3,788 26 75 5,872<br />
June 18 46 3,562 24 75 5,745<br />
July 17 43 3,160 26 76 6,001<br />
August 17 42 3,146 29 79 6,019<br />
September 16 40 3,328 29 82 6,164<br />
Source: Nutrition Assistance Program,Department of Community and Cultural Affairs<br />
Table 5 .17 NAP Actual P a rticipation in the N. Isla nds by Month: FY1996 ,<br />
and FY1997<br />
1997 1996<br />
Month HH Individuals Benefits ($) HH Individuals Benefits ($)<br />
Total 12 19 2,088 12 44 4,800<br />
October 1 3 338 1 4 431<br />
November 1 2 177 1 4 431<br />
December 1 2 177 1 4 431<br />
January 1 1 97 1 4 431<br />
February 1 1 97 1 4 431<br />
March 1 1 107 1 4 431<br />
April 1 1 129 1 4 431<br />
May 1 1 129 1 4 431<br />
June 1 1 129 1 3 338<br />
July 1 2 236 1 3 338<br />
August 1 2 236 1 3 338<br />
September 1 2 236 1 3 338<br />
Source: Nutrition Assistance Program,Department of Community and Cultural Affairs<br />
Central Statistics Division, Department of Commerce
<strong>1998</strong> CNMI <strong>Statistical</strong> <strong>Yearbook</strong>, Chapter 5 Page 61<br />
Table 5 .18 NAP Actua l Pa rticipa tion by Ethnicity in FY 1997<br />
Monthly Average Number of Total Percent<br />
Ethnicity Households Persons Benefits ($) Households Persons Benefits<br />
Total 881 3,346 2,982,292 100.0 100.0 100.0<br />
Chamorro 389 1,509 1,350,328 44.2 45.1 45.3<br />
Carolinian 149 666 616,254 16.9 19.9 20.7<br />
Chuukese 90 411 355,666 10.2 12.3 11.9<br />
Palauan 84 326 312,540 9.5 9.7 10.5<br />
Filipino 134 295 223,118 15.2 8.8 7.5<br />
Pohnpeian 17 73 65,382 1.9 2.2 2.2<br />
Yapese 6 24 21,937 0.7 0.7 0.7<br />
Others 12 42 37,067 1.4 1.3 1.2<br />
Source: Nutrition Assistance Program,Department of Community and Cultural Affairs<br />
Figure 5.3 NAP Individual Participants by<br />
Ethnicity in Fiscal Year 1997<br />
Chamorro<br />
Carolinian<br />
Filipino<br />
Chuukese<br />
Palauan<br />
Pohnpeian<br />
Yapese<br />
Others<br />
Percent<br />
0 10 20 30 40 50<br />
Table 5 .19 NAP Actua l Pa rticipa tion by Ethnicity in FY 1996<br />
Monthly Average Number of Total Percent<br />
Ethnicity Households Persons Benefits ($) Households Persons Benefits<br />
Total 964 3,600 3,512,809 100.0 100.0 100.0<br />
Chamorro 465 1,806 1,666,060 48.2 50.2 47.4<br />
Carolinian 170 774 734,510 17.6 21.5 20.9<br />
Chuukese 68 278 360,179 7.1 7.7 10.3<br />
Palauan 60 242 336,087 6.2 6.7 9.6<br />
Filipino 157 333 268,675 16.3 9.3 7.6<br />
Pohnpeian 24 96 85,820 2.5 2.7 2.4<br />
Yapese 5 19 18,458 0.5 0.5 0.5<br />
Others 15 52 43,020 1.6 1.4 1.2<br />
Source: Nutrition Assistance Program,Department of Community and Cultural Affairs<br />
Central Statistics Division, Department of Commerce
Page 62 <strong>1998</strong> CNMI <strong>Statistical</strong> <strong>Yearbook</strong>, Chapter 5<br />
Table 5 .20 Actua l NAP Participa nts by Ethnicity in CNMI:<br />
Fisca l Yea r 1994 to Fisca l Yea r 1997<br />
Monthly Average<br />
Monthly Average<br />
Number of Households<br />
Number of Participants<br />
Ethnicity 1997 1996 1995 1994 1997 1996 1995 1994<br />
Average 881 964 1,110 989 3,346 3,600 4,234 3,841<br />
Chamorro 389 465 530 501 1,509 1,806 2,100 2,030<br />
Carolinian 149 170 189 175 666 774 864 823<br />
Chuukese 90 68 108 88 411 278 432 346<br />
Palauan 84 60 93 75 326 242 373 289<br />
Filipino 134 157 147 113 295 333 313 230<br />
Pohnpeian 17 24 24 20 73 96 89 69<br />
Yapese 6 5 4 3 24 19 16 13<br />
Others 12 15 15 14 42 52 47 41<br />
Source: NAP Annual Report<br />
Central Statistics Division, Department of Commerce
Chapter 6<br />
ACCIDENTS<br />
AND<br />
OFFENSES
Page 64 <strong>1998</strong> CNMI <strong>Statistical</strong> <strong>Yearbook</strong>, Chapter 6<br />
Summary of Accidents and Offenses<br />
The total number of reported juvenile offenses increased from 370<br />
in 1993 to a high of 517 in 1997; it fluctuated since and reached a<br />
low of 279 in 1995. The majority of juvenile offenses for 1997 were<br />
curfew violations, assaults/battery, liquor consumption, theft,<br />
disturbing the peace, burglary, and controlled substance.<br />
The total number of traffic accidents fluctuated from 1993 to<br />
1997.<br />
The number of DUI (Driving Under Influence) arrests were<br />
high in 1993. From 1994 to 1995, the numbers declined, reaching<br />
a low of 291. Since then the figures have steadily increased,<br />
reaching 408 in <strong>1998</strong>. In all reported years, males constituted the<br />
vast majority of total DUI arrests. In <strong>1998</strong>, 118 of the total DUI<br />
arrest were Filipinos, 62 were Chamorros, 52 were Palauans, 41<br />
were Koreans, 33 were Carolinians, and 31 were Chuukese.<br />
The tables in this chapter detail the number of public safety<br />
offenses and traffic accidents in the CNMI in recent years.<br />
Central Statistics Division, Department of Commerce
<strong>1998</strong> CNMI <strong>Statistical</strong> <strong>Yearbook</strong>, Chapter 6 Page 65<br />
Table 6.1 Type a nd Num ber of J uvenile Offenses, CNMI: 1 993 to 1997<br />
Type of Offense 1997 1996 1995 1994 1993<br />
Total 517 363 279 287 370<br />
Homicide 0 2 0 0 0<br />
Robbery 5 5 4 6 3<br />
Assault/battery 73 47 65 69 45<br />
Burglary 38 32 21 23 29<br />
Theft 50 31 32 34 24<br />
Auto theft 23 21 4 6 8<br />
Arson 0 0 0 1 0<br />
Disturbing the peace 40 16 23 21 31<br />
Criminal mischief 21 29 22 18 12<br />
Controlled substance 25 21 23 26 29<br />
Possession of firearms 0 1 0 3 2<br />
Criminal trespass 3 0 9 1 2<br />
Other 70 28 26 26 68<br />
Traffic 4 7 7 22 42<br />
Truancy 5 3 3 3 6<br />
Liquor consumption 71 84 28 18 56<br />
Curfew violations 75 24 11 0 13<br />
Tabacco 14 6 1 10 0<br />
Runaway 0 6 0 0 0<br />
Source: Criminal Justice Planning Agency<br />
Year<br />
Total number of Reported Juvenile<br />
Criminal Offenses<br />
The total number of reported juvenile offenses<br />
increased from 370 in 1993 to 517 in 1997.<br />
The majority of juvenile offenses were assault/<br />
battery, liquor consumption, theft, disturbing the<br />
peace, burglaries, and controlled substance<br />
violations from 1993 through 1997.<br />
Figure 6.1 Total Number of Juvenile Criminal<br />
Offenses in the CNMI, 1993 to<br />
1997<br />
Number of Offenses<br />
550<br />
500<br />
450<br />
400<br />
350<br />
300<br />
250<br />
93 94 95 96 97<br />
Year<br />
Table 6.2 Num ber of Tr affic Accidents by Month: 1993 to 1997<br />
Offense 1997 1996 1995 1994 1993<br />
Total 1,235 2,249 2,150 2,254 2,608<br />
January 97 200 191 197 236<br />
February 116 167 159 166 151<br />
March 133 141 165 141 232<br />
April 109 115 207 119 211<br />
May 151 216 189 213 258<br />
June 93 166 145 173 221<br />
July 109 173 236 177 229<br />
August 73 135 125 141 217<br />
September 123 203 135 196 210<br />
October 129 219 211 216 225<br />
November 14 251 224 247 201<br />
December 88 263 163 268 217<br />
Source: Criminal Justice Planning Agency<br />
Year<br />
Total Number of Traffic Accidents<br />
The total number of traffic accidents fluctuated<br />
from 1993 to 1997.<br />
Figure 6.2 Total Number of Traffic Accidents,<br />
1993 to 1997<br />
Number of DUI Arrest<br />
3000<br />
2500<br />
2000<br />
1500<br />
1000<br />
500<br />
2,549 2,542<br />
2,150<br />
2,249<br />
1,235<br />
0<br />
1993 1994 1995 1996 1997<br />
Year<br />
Central Statistics Division, Department of Commerce
Page 66 <strong>1998</strong> CNMI <strong>Statistical</strong> <strong>Yearbook</strong>, Chapter 6<br />
Figure 6.3<br />
Trend of Selected Type of Juvenile<br />
Criminal Offenses in the CNMI,<br />
1990 to 1997<br />
Table 6.3 Num ber of Violent a nd P r oper ty Cr im es of J uv enile<br />
Offenses, CNMI : 1990 to 1 997<br />
Year<br />
Offense 1997 1996 1995 1994 1993 1992 1991 1990<br />
Total 197 138 126 139 109 130 164 67<br />
Homicide 0 2 0 0 0 2 0 0<br />
Rape 0 0 0 0 0 0 0 0<br />
Robbery 5 5 4 6 3 1 14 0<br />
Assault 71 47 65 69 45 49 49 34<br />
Burglary 38 32 21 23 29 39 55 11<br />
Larceny 60 31 32 34 24 28 31 19<br />
Auto Theft 23 21 4 6 8 11 15 3<br />
Arson 0 0 0 1 0 0 0 0<br />
Source: Criminal Justice Planning Agency<br />
Number of Offense<br />
150<br />
100<br />
50<br />
Assault<br />
Burglary<br />
Larceny<br />
Auto Theft<br />
0<br />
90 91 92 93 94 95 96 97<br />
Year<br />
Total Number of DUI Arrests<br />
The number of DUI (Driving Under<br />
Intoxication, or driving under influence) arrests<br />
in 1997 declined from 1996 but increased<br />
again to 408 in <strong>1998</strong>.<br />
In all reported years, males constituted the vast<br />
majority of total DUI arrests.<br />
In <strong>1998</strong>, 118 of total DUI arrest were<br />
Filipinos, 62 were Chamorros, 52 were<br />
Palauans, 41 were Koreans, and 33 were<br />
Carolinians.<br />
Table 6.4 DUI Arr ests by Ethnicity and Sex, Sa ipa n : 1996 - <strong>1998</strong><br />
<strong>1998</strong> 1997 1996<br />
Ethnicity Total Male Female Total Male Female Total Male Female<br />
Total 408 401 7 324 320 4 372 370 2<br />
American 16 16 0 9 9 0 12 12 0<br />
Carolinian 33 32 1 19 18 1 26 25 1<br />
Chamorro 62 58 4 39 38 1 61 61 0<br />
Chinese 26 26 0 17 17 0 11 11 0<br />
Chuukese 31 31 0 30 30 0 27 26 1<br />
Filipino 118 116 2 89 88 1 109 109 0<br />
Hispanic 0 0 0 2 2 0 0 0 0<br />
Indian 0 0 0 1 1 0 0 0 0<br />
Japanese 7 7 0 8 8 0 5 5 0<br />
Korean 41 41 0 53 53 0 47 47 0<br />
Kosraen 0 0 0 0 0 0 3 3 0<br />
Nauruan 0 0 0 1 1 0 0 0 0<br />
Nepalese 1 1 0 3 3 0 0 0 0<br />
New Zealand 0 0 0 1 1 0 0 0 0<br />
Palauan 52 52 0 36 35 1 52 52 0<br />
Pohnpeian 16 16 0 15 15 0 17 17 0<br />
Polynesian 3 3 0 0 0 0 0 0 0<br />
Thai 2 2 0 1 1 0 2 2 0<br />
Source: Office of Highway Safety, Department of Public Safety<br />
Central Statistics Division, Department of Commerce
<strong>1998</strong> CNMI <strong>Statistical</strong> <strong>Yearbook</strong>, Chapter 6 Page 67<br />
Ta ble 6 .5 DUI Arrests in 1 998, Sa ipa n : Ethnicity by Month<br />
Figure 6.4 Total Number of DUI Arrest by<br />
Ethnicity in Saipan, <strong>1998</strong><br />
Month<br />
Ethnicity Total Jan Feb Mar Apr May Jun Jul Aug Sep Oct Nov Dec<br />
Total 408 34 35 44 49 32 33 33 28 28 27 36 29<br />
American 16 4 2 3 3 1 1 1 1 0 0 0 0<br />
Carolinian 33 5 4 6 2 4 5 0 0 2 1 3 1<br />
Chamorro 62 3 2 5 6 2 5 10 9 3 5 6 6<br />
Chinese 26 1 2 1 5 1 1 3 1 3 3 3 2<br />
Chuukese 31 2 5 3 4 2 0 5 2 3 1 4 0<br />
Filipino 118 10 6 12 16 12 11 6 6 12 5 11 11<br />
Japanese 7 0 1 0 0 1 2 0 2 0 0 0 1<br />
Korean 41 3 3 4 0 4 2 6 4 3 4 5 3<br />
Nepalese 1 0 0 0 1 0 0 0 0 0 0 0 0<br />
Palauan 52 4 5 4 9 4 6 1 3 1 7 4 4<br />
Polynesian 3 1 2 0 0 0 0 0 0 0 0 0 0<br />
Pohnpeian 16 1 3 5 2 1 0 1 0 1 1 0 1<br />
Thai 2 0 0 1 1 0 0 0 0 0 0 0 0<br />
Filipino<br />
Chamorro<br />
Palauan<br />
Korean<br />
Carolinian<br />
Chuukese<br />
Chinese<br />
Pohnpeian<br />
American<br />
Japanese<br />
Polynesian<br />
Thai<br />
Number of DUI arrests<br />
0 40 80 120 160<br />
118<br />
62<br />
52<br />
41<br />
Ethnicity<br />
33<br />
31<br />
26<br />
16<br />
16<br />
7<br />
3<br />
Source: Office of Highway Safety, Department of Safety<br />
2<br />
Ta ble 6 .6 DUI Arrests in 1 997, Sa ipa n : Ethnicity by Month<br />
Month<br />
Ethnicity Total Jan Feb Mar Apr May Jun Jul Aug Sep Oct Nov Dec<br />
Total 324 21 12 32 23 7 19 20 39 29 26 31 65<br />
American 9 0 0 0 0 0 0 1 2 2 0 1 3<br />
Carolinian 19 1 1 1 0 0 0 1 3 4 2 2 4<br />
Chamorro 39 1 1 5 5 1 2 3 7 6 2 2 4<br />
Chinese 17 2 1 3 0 0 3 1 1 0 0 2 4<br />
Chuukese 30 0 3 4 3 0 3 1 2 3 0 2 9<br />
Filipino 89 8 3 7 4 3 6 2 11 7 14 13 11<br />
Hispanic 2 0 0 0 0 0 0 0 2 0 0 0 0<br />
Indian 1 0 0 0 0 0 0 0 0 0 0 0 1<br />
Japanese 8 0 0 0 0 0 1 1 2 0 0 1 3<br />
Korean 53 5 2 4 7 0 3 7 6 4 2 4 9<br />
Nauruan 1 0 0 0 1 0 0 0 0 0 0 0 0<br />
Nepalese 3 0 0 0 0 0 0 0 1 0 1 0 1<br />
New Zealand 1 0 0 0 0 0 0 0 0 0 0 0 1<br />
Palauan 36 3 1 5 2 2 1 3 1 2 3 4 9<br />
Pohnpeian 15 1 0 2 1 1 0 0 1 1 2 0 6<br />
Thai 1 0 0 1 0 0 0 0 0 0 0 0 0<br />
Source: Office of Highway Safety, Department of Safety<br />
Central Statistics Division, Department of Commerce
Page 68 <strong>1998</strong> CNMI <strong>Statistical</strong> <strong>Yearbook</strong>, Chapter 6<br />
Figure 6.5 Total Number of DUI Arrest,<br />
1991 to <strong>1998</strong><br />
Number of DUI arrest<br />
1200<br />
1000<br />
800<br />
600<br />
400<br />
200<br />
0<br />
1991<br />
'92<br />
'93<br />
'95<br />
'94<br />
Year<br />
'96<br />
'97<br />
<strong>1998</strong><br />
Table 6.7 DUI Arr ests by Ethnicity, Saipan : 1993 - <strong>1998</strong><br />
Year<br />
Ethnicity <strong>1998</strong> 1997 1996 1995 1994 1993<br />
Total 408 324 372 291 505 579<br />
American 16 9 12 7 24 15<br />
Australian 0 0 0 0 0 1<br />
Bangladeshi 0 0 0 0 3 3<br />
Carolinian 33 19 26 20 23 50<br />
Chamorro 62 39 61 53 75 90<br />
Chinese 26 17 11 6 8 13<br />
Chuukese 31 30 27 17 37 26<br />
Fijian 0 0 0 1 1 0<br />
Filipino 118 89 109 85 138 201<br />
Hispanic 0 2 0 0 0 0<br />
Indian 0 1 0 0 0 0<br />
Japanese 7 8 5 10 20 13<br />
Korean 41 53 47 31 59 50<br />
Kosraean 0 0 3 2 1 0<br />
Marshallese 0 0 0 0 2 0<br />
Mexican 0 0 0 0 0 0<br />
Nauruan 0 1 0 0 0 0<br />
Nepal 1 3 0 0 0 0<br />
New Zealand 0 1 0 0 0 0<br />
Palauan 52 36 52 45 85 86<br />
Pohnpeian 16 15 17 7 20 19<br />
Polynesian 3 0 0 1 0 0<br />
Portugese 0 0 0 1 0 0<br />
Samoan 0 0 0 5 1 2<br />
Thai 2 1 2 0 3 3<br />
Tongan 0 0 0 0 0 1<br />
Yapese 0 0 0 0 5 6<br />
Source: Office of Highway Safety, Department of Public Safety<br />
Figure 6.6 Number of Offenses: Saipan, 1993<br />
to <strong>1998</strong><br />
Total Offenses<br />
4500<br />
4000<br />
3500<br />
3000<br />
2500<br />
2000<br />
1500<br />
1993 1994 1995 1996 1997 <strong>1998</strong><br />
Table 6.8 Num ber of Offenses: Saipan, 1993 to <strong>1998</strong><br />
Year<br />
Offense <strong>1998</strong> 1997 1996 1995 1994 1993<br />
Total 4,067 4,282 4,397 4,337 3,861 2,368<br />
Homicide 2 3 5 10 4 5<br />
Rape 9 8 5 11 3 4<br />
Robbery 53 25 17 17 17 23<br />
Assault 1343 1485 1,463 1,585 620 661<br />
Burglary 817 868 945 1,250 1,009 735<br />
Larceny 1767 1772 1,935 1,411 2,097 859<br />
Auto Theft 68 108 11 42 111 76<br />
Arson 8 13 16 11 0 5<br />
Source: Criminal Justice Planning Agency<br />
Central Statistics Division, Department of Commerce
<strong>1998</strong> CNMI <strong>Statistical</strong> <strong>Yearbook</strong>, Chapter 6 Page 69<br />
Table 6.9 DUI Arr est by Month: CNMI, 1994 to <strong>1998</strong><br />
Year<br />
Offense <strong>1998</strong> 1997 1996 1995 1994<br />
Total 474 377 483 345 572<br />
January 37 23 42 53 45<br />
February 38 14 32 34 50<br />
March 58 46 32 22 20<br />
April 53 29 26 24 60<br />
May 39 11 46 38 58<br />
June 38 23 35 25 75<br />
July 41 23 41 20 50<br />
August 33 42 40 21 33<br />
September 31 32 45 17 38<br />
October 33 29 28 22 44<br />
November 41 38 29 31 26<br />
December 32 67 87 38 73<br />
Source: Traffic Division, Department of Public Safety<br />
Central Statistics Division, Department of Commerce
Chapter 7<br />
VOTERS<br />
AND<br />
ELECTIONS
Page 72 <strong>1998</strong> CNMI <strong>Statistical</strong> <strong>Yearbook</strong>, Chapter 7<br />
Summary of Voters and Elections<br />
The number of registered voters in the Commonwealth declined<br />
from 11,856 persons in 1993 to 11,114 in 1995, but increased to<br />
13,384 in 1997. In 1997, Election District 1 had the highest number<br />
of registered voters (4,946), second highest was District 3 (2,980),<br />
followed by District 4, District 6, District 2, and District 5.<br />
The total number of registered voters who voted also declined<br />
from 10,667 in 1993 to 8,362 persons in 1995, but increased to 12,289<br />
in 1997. The number of voters in Election Districts 1, 3, 4, 5, and 6,<br />
followed this same pattern from 1995 to 1997, except in Election<br />
District 2 where the number of registered voters consistently declined<br />
from 1993 to 1997.<br />
Generally, male registered voters outnumbered females; similarly,<br />
male registered voters who voted in 1993, 1995, and 1997 election<br />
years outnumbered females.<br />
The proportion of registered voters who voted declined from 1993<br />
to 1995, but increased from 1995 to 1997. The proportion of registered<br />
voters who voted in election year 1997 was highest in Election<br />
District 6 (Rota), second highest in District 5 (Tinian), followed by<br />
District 2, District 3, District 1, and District 4, respectively.<br />
In 1997, age group 18-26 years old had the largest number of<br />
registered voters. This was true in total and for both male and female<br />
except for age group 72 and up where female voters dominated<br />
number of male voters.<br />
By far, Chamorros were the largest single ethnic group both in<br />
the number of registered voters and in the number of voters who<br />
voted, followed by Carolinians, Americans, Filipinos, Chamolinians<br />
(combination of Chamorros and Carolinians), and Palauans, respectively.<br />
Central Statistics Division, Department of Commerce
<strong>1998</strong> CNMI <strong>Statistical</strong> <strong>Yearbook</strong>, Chapter 7 Page 73<br />
Table 7 .1 Num ber of Registered Voters in 1993, 1995, a nd 1997:<br />
Election Districts by Election Yea r<br />
Election Year<br />
Percent change<br />
Election District 1997 1995 1993 95-97 93-95<br />
All Registered Voters 13,384 11,114 11,856 20.4 -6.3<br />
District 1 4,946 3,639 3,808 35.9 -4.4<br />
San Antonio 831 805 864 3.2 -6.8<br />
San Vicente 2,753 2,187 2,286 25.9 -4.3<br />
Koblerville 1,362 647 658 110.5 -1.7<br />
District 2 1,032 1,041 1,100 -0.9 -5.4<br />
Chalan Kanoa 771 823 859 -6.3 -4.2<br />
Susupe 261 218 241 19.7 -9.5<br />
District 3 2,980 2,788 3,032 6.9 -8.0<br />
San Jose 895 833 896 7.4 -7.0<br />
Garapan 2,045 1,917 2,057 6.7 -6.8<br />
Northern Is. 40 38 79 5.3 -51.9<br />
District 4 2,235 1,720 1,818 29.9 -5.4<br />
Tanapag 589 513 541 14.8 -5.2<br />
San Roque 466 345 354 35.1 -2.5<br />
Capital Hill 1,180 862 923 36.9 -6.6<br />
District 5 929 781 825 19.0 -5.3<br />
Tinian 929 781 825 19.0 -5.3<br />
District 6 1,262 1,145 1,273 10.2 -10.1<br />
Rota 1,262 1,145 1,273 10.2 -10.1<br />
Source: Election Commission<br />
Figure 7.1 Number of Registered Voters by<br />
Election District in 1997:<br />
Percentage<br />
Dist.2<br />
7.7%<br />
Dist.3<br />
22.3%<br />
Dist.4<br />
16.7%<br />
Dist.1<br />
37.0%<br />
Dist.5<br />
6.9%<br />
Dist.6<br />
9.4%<br />
Table 7 .2 Num ber of Registered Voters Who Voted in 1993, 1995, and 1997:<br />
Election Districts by Election Yea r<br />
Figure 7.2 Number of Voters Voted by<br />
Election District in 1997:<br />
Percentage<br />
Election Year<br />
Percent change<br />
Election District 1997 1995 1993 95-97 93-95<br />
Total Voted 12,289 8,362 10,667 47.0 -21.6<br />
District 1 4,489 2,672 3,377 68.0 -20.9<br />
San Antonio 769 593 759 29.7 -21.9<br />
San Vicente 2,499 1,589 2,013 57.3 -21.1<br />
Koblerville 1,221 490 605 149.2 -19.0<br />
District 2 966 766 1,004 26.1 -23.7<br />
Chalan Kanoa 719 606 798 18.6 -24.1<br />
Susupe 247 160 206 54.4 -22.3<br />
District 3 2,731 2,004 2,679 36.3 -25.2<br />
San Jose 836 648 816 29.0 -20.6<br />
Garapan 1,855 1,326 1,789 39.9 -25.9<br />
Northern Is. 40 30 74 33.3 -59.5<br />
District 4 2,016 1,359 1,626 48.3 -16.4<br />
Tanapag 545 413 495 32.0 -16.6<br />
San Roque 434 281 330 54.4 -14.8<br />
Capital Hill 1,037 665 801 55.9 -17.0<br />
District 5 876 645 764 35.8 -15.6<br />
Tinian 876 645 764 35.8 -15.6<br />
District 6 1,211 916 1,217 32.2 -24.7<br />
Rota 1,211 916 1,217 32.2 -24.7<br />
Source: Election Commission<br />
Dist 4<br />
16.4%<br />
Dist 5<br />
7.1%<br />
Dist 6<br />
9.9%<br />
Dist 3<br />
22.2%<br />
Dist 2<br />
7.9%<br />
Dist 1<br />
36.5%<br />
Central Statistics Division, Department of Commerce
Page 74 <strong>1998</strong> CNMI <strong>Statistical</strong> <strong>Yearbook</strong>, Chapter 7<br />
Table 7 .3 Num ber of Male Reg ister ed Voters in 1993, 1995, a nd 1997 :<br />
Election Districts by Election Year<br />
Election Year<br />
Percent change<br />
Election District 1997 1995 1993 95-97 93-95<br />
All Male Voters 6,918 5,747 6,159 20.4 -6.7<br />
District 1 2,537 1,875 1,978 35.3 -5.2<br />
San Antonio 434 431 474 0.7 -9.1<br />
San Vicente 1,400 1,130 1,189 23.9 -5.0<br />
Koblerville 703 314 315 123.9 -0.3<br />
District 2 552 529 573 4.3 -7.7<br />
Chalan Kanoa 403 413 439 -2.4 -5.9<br />
Susupe 149 116 134 28.4 -13.4<br />
District 3 1,498 1,407 1,536 6.5 -8.4<br />
San Jose 441 408 440 8.1 -7.3<br />
Garapan 1,035 979 1,051 5.7 -6.9<br />
Northern Is. 22 20 45 10.0 -55.6<br />
District 4 1,166 909 958 28.3 -5.1<br />
Tanapag 318 270 285 17.8 -5.3<br />
San Roque 245 183 186 33.9 -1.6<br />
Capital Hill 603 456 487 32.2 -6.4<br />
District 5 489 423 445 15.6 -4.9<br />
Tinian 489 423 445 15.6 -4.9<br />
District 6 676 604 669 11.9 -9.7<br />
Rota 676 604 669 11.9 -9.7<br />
Source: Election Commission<br />
Table 7 .4 Num ber of Male Reg istered Voters Who Voted in 1993, 1 995, a nd 1997<br />
Election Districts by Election Yea r<br />
Election Year<br />
Percent change<br />
Election District 1997 1995 1993 95-97 93-95<br />
All Male Voted 6,312 4,229 5,535 49.3 -23.6<br />
District 1 2,292 1,356 1,757 69.0 -22.8<br />
San Antonio 401 306 417 31.0 -26.6<br />
San Vicente 1,263 813 1,047 55.4 -22.3<br />
Koblerville 628 237 293 165.0 -19.1<br />
District 2 512 376 517 36.2 -27.3<br />
Chalan Kanoa 375 294 405 27.6 -27.4<br />
Susupe 137 82 112 67.1 -26.8<br />
District 3 1,353 978 1,349 38.3 -27.5<br />
San Jose 412 312 402 32.1 -22.4<br />
Garapan 919 650 905 41.4 -28.2<br />
Northern Is. 22 16 42 37.5 -61.9<br />
District 4 1,047 700 863 49.6 -18.9<br />
Tanapag 294 211 260 39.3 -18.8<br />
San Roque 228 145 174 57.2 -16.7<br />
Capital Hill 525 344 429 52.6 -19.8<br />
District 5 460 342 412 34.5 -17.0<br />
Tinian 460 342 412 34.5 -17.0<br />
District 6 648 477 637 35.8 -25.1<br />
Rota 648 477 637 35.8 -25.1<br />
Source: Election Commission<br />
Central Statistics Division, Department of Commerce
<strong>1998</strong> CNMI <strong>Statistical</strong> <strong>Yearbook</strong>, Chapter 7 Page 75<br />
Table 7 .5 Num ber of Fem a le Registered Voters in 1993, 1995, a nd 1997 :<br />
Election Districts by Election Yea r<br />
Election Year<br />
Percent change<br />
Election District 1997 1995 1993 95-97 93-95<br />
All Female Voters 6,466 5,367 5,697 20.5 -5.8<br />
District 1 2,409 1,764 1,830 36.6 -3.6<br />
San Antonio 397 374 390 6.1 -4.1<br />
San Vicente 1,353 1,057 1,097 28.0 -3.6<br />
Koblerville 659 333 343 97.9 -2.9<br />
District 2 480 512 527 -6.3 -2.8<br />
Chalan Kanoa 368 410 420 -10.2 -2.4<br />
Susupe 112 102 107 9.8 -4.7<br />
District 3 1,482 1,381 1,496 7.3 -7.7<br />
San Jose 454 425 456 6.8 -6.8<br />
Garapan 1,010 938 1,006 7.7 -6.8<br />
Northern Is. 18 18 34 0.0 -47.1<br />
District 4 1,069 811 860 31.8 -5.7<br />
Tanapag 271 243 256 11.5 -5.1<br />
San Roque 221 162 168 36.4 -3.6<br />
Capital Hill 577 406 436 42.1 -6.9<br />
District 5 440 358 380 22.9 -5.8<br />
Tinian 440 358 380 22.9 -5.8<br />
District 6 586 541 604 8.3 -10.4<br />
Rota 586 541 604 8.3 -10.4<br />
Source: Election Commission<br />
Table 7 .6 Num ber of Fem a le Registered Voters Who Voted in 1993, 1995 ,<br />
and 1 997: Election Distr icts by Election Year<br />
Election Year<br />
Percent change<br />
Election District 1997 1995 1993 95-97 93-95<br />
All Female Voted 5,977 4,133 5,132 44.6 -19.5<br />
District 1 2,197 1,316 1,620 66.9 -18.8<br />
San Antonio 368 287 342 28.2 -16.1<br />
San Vicente 1,236 776 966 59.3 -19.7<br />
Koblerville 593 253 312 134.4 -18.9<br />
District 2 454 390 487 16.4 -19.9<br />
Chalan Kanoa 344 312 393 10.3 -20.6<br />
Susupe 110 78 94 41.0 -17.0<br />
District 3 1,378 1,026 1,330 34.3 -22.9<br />
San Jose 424 336 414 26.2 -18.8<br />
Garapan 936 676 884 38.5 -23.5<br />
Northern Is. 18 14 32 28.6 -56.3<br />
District 4 969 659 763 47.0 -13.6<br />
Tanapag 251 202 235 24.3 -14.0<br />
San Roque 206 136 156 51.5 -12.8<br />
Capital Hill 512 321 372 59.5 -13.7<br />
District 5 416 303 352 37.3 -13.9<br />
Tinian 416 303 352 37.3 -13.9<br />
District 6 563 439 580 28.2 -24.3<br />
Rota 563 439 580 28.2 -24.3<br />
Source: Election Commission<br />
Central Statistics Division, Department of Commerce
Page 76 <strong>1998</strong> CNMI <strong>Statistical</strong> <strong>Yearbook</strong>, Chapter 7<br />
Table 7.7 Per cent of Reg istered Voters Who Voted in 1991 , 1993 , a nd 1995:<br />
Election Distr icts by Election Yea r a nd Sex<br />
All Voters Male Female<br />
Election District 1995 1993 1991 1995 1993 1991 1995 1993 1991<br />
All Districts 92 75 90 91 74 90 92 77 90<br />
District 1 91 73 89 90 72 89 91 75 89<br />
San Antonio 93 74 88 92 71 88 93 77 88<br />
San Vicente 91 73 88 90 72 88 91 73 88<br />
Koblerville 90 76 92 89 75 93 90 76 91<br />
District 2 94 74 91 93 71 90 95 76 92<br />
Chalan Kanoa 93 74 93 93 71 92 93 76 94<br />
Susupe 95 73 85 92 71 84 98 76 88<br />
District 3 92 72 88 90 70 88 93 74 89<br />
San Jose 93 78 91 93 76 91 93 79 91<br />
Garapan 91 69 87 89 66 86 93 72 88<br />
Northern Is. 100 79 94 100 80 93 100 78 94<br />
District 4 90 79 89 90 77 90 91 81 89<br />
Tanapag 93 81 91 92 78 91 93 83 92<br />
San Roque 93 81 93 93 79 94 93 84 93<br />
Capital Hill 88 77 87 87 75 88 89 79 85<br />
District 5 94 83 93 94 81 93 95 85 93<br />
Tinian 94 83 93 94 81 93 95 85 93<br />
District 6 96 80 96 96 79 95 96 81 96<br />
Rota 96 80 96 96 79 95 96 81 96<br />
Source: Election Commission<br />
Table 7 .8 Num ber of Registered Voters by Election District by Age<br />
Gr oup, and by Sex: 1 997<br />
Age Group<br />
Election District All Ages 18-26 27-35 36-44 45-53 54-62 63-71 72-80 81+<br />
All Voters 13,384 3,537 3,138 2,763 1,974 1,065 596 246 65<br />
District 1 4,946 1316 1199 1064 767 341 182 58 19<br />
District 2 1,032 274 221 190 120 103 66 45 13<br />
District 3 2,980 806 688 537 473 279 134 52 11<br />
District 4 2,235 533 484 510 348 202 105 44 9<br />
District 5 929 255 248 204 104 61 34 19 4<br />
District 6 1,262 353 298 258 162 79 75 28 9<br />
All Males 6,918 1,740 1,603 1,440 1,058 601 330 119 27<br />
District 1 2,537 635 595 554 409 199 111 26 8<br />
District 2 552 141 118 113 65 58 36 19 2<br />
District 3 1,498 387 336 273 244 158 71 24 5<br />
District 4 1,166 266 251 264 184 119 55 24 3<br />
District 5 489 130 134 108 59 29 16 10 3<br />
District 6 676 181 169 128 97 38 41 16 6<br />
All Females 6,466 1,797 1,535 1,323 916 464 266 127 38<br />
District 1 2,409 681 604 510 358 142 71 32 11<br />
District 2 480 133 103 77 55 45 30 26 11<br />
District 3 1,482 419 352 264 229 121 63 28 6<br />
District 4 1,069 267 233 246 164 83 50 20 6<br />
District 5 440 125 114 96 45 32 18 9 1<br />
District 6 586 172 129 130 65 41 34 12 3<br />
Source: Election Commission<br />
Central Statistics Division, Department of Commerce
<strong>1998</strong> CNMI <strong>Statistical</strong> <strong>Yearbook</strong>, Chapter 7 Page 77<br />
Table 7 .9 Num ber of Registered Voters Who Voted in 1997:<br />
Election Distr ict by Age Group a nd by Sex<br />
Age Group<br />
Election District All Ages 18-26 27-35 36-44 45-53 54-62 63-71 72-80 81+<br />
All Voters 12,289 3,143 2,886 2,588 1,848 998 559 212 55<br />
District 1 4,489 1,142 1,093 983 718 315 174 49 15<br />
District 2 966 253 208 182 111 94 62 43 13<br />
District 3 2,731 712 629 500 450 263 125 43 9<br />
District 4 2,016 460 432 482 314 190 94 38 6<br />
District 5 876 235 236 194 100 60 32 15 4<br />
District 6 1,211 341 288 247 155 76 72 24 8<br />
All Males 6,312 1,535 1,476 1,337 974 560 305 102 23<br />
District 1 2,292 541 542 513 379 182 105 23 7<br />
District 2 512 128 111 107 60 53 33 18 2<br />
District 3 1,353 335 306 247 226 148 67 20 4<br />
District 4 1,047 235 225 247 160 111 46 21 2<br />
District 5 460 120 129 101 57 29 14 7 3<br />
District 6 648 176 163 122 92 37 40 13 5<br />
All Females 5,977 1,608 1,410 1,251 874 438 254 110 32<br />
District 1 2,197 601 551 470 339 133 69 26 8<br />
District 2 454 125 97 75 51 41 29 25 11<br />
District 3 1,378 377 323 253 224 115 58 23 5<br />
District 4 969 225 207 235 154 79 48 17 4<br />
District 5 416 115 107 93 43 31 18 8 1<br />
District 6 563 165 125 125 63 39 32 11 3<br />
Source: Election Commission<br />
Table 7 .10 Reg ister ed Voters: Election Distr icts by Ethnic Group in 1 993<br />
Ethnic Groups<br />
Cham- Car- Chamo- Amer-<br />
Election District All Voters orro olinian linian ican Palauan Filipino Others<br />
All Voters 11,856 7,989 1,487 445 1,150 275 376 134<br />
District 1 3,808 2,813 255 120 344 97 139 40<br />
District 2 1,100 752 166 33 42 39 50 18<br />
District 3 3,032 1,544 805 115 301 98 124 45<br />
District 4 1,818 993 249 164 328 35 32 17<br />
District 5 825 733 9 6 52 3 11 11<br />
District 6 1,273 1,154 3 7 83 3 20 3<br />
All Males 6,146 4,087 649 229 749 109 244 79<br />
District 1 1,962 1,439 99 57 221 40 85 21<br />
District 2 572 383 82 19 29 16 34 9<br />
District 3 1,536 790 336 56 199 36 88 31<br />
District 4 959 503 125 88 205 13 16 9<br />
District 5 446 385 4 3 38 2 6 8<br />
District 6 671 587 3 6 57 2 15 1<br />
All Females 5,710 3,902 838 216 401 166 132 55<br />
District 1 1,846 1,374 156 63 123 57 54 19<br />
District 2 528 369 84 14 13 23 16 9<br />
District 3 1,496 754 469 59 102 62 36 14<br />
District 4 859 490 124 76 123 22 16 8<br />
District 5 379 348 5 3 14 1 5 3<br />
District 6 602 567 0 1 26 1 5 2<br />
Source: Election Commission<br />
Central Statistics Division, Department of Commerce
Page 78 <strong>1998</strong> CNMI <strong>Statistical</strong> <strong>Yearbook</strong>, Chapter 7<br />
Ta ble 7 .11 Register ed Voters: Election District by Ethnicity in 1995<br />
Ethnicity<br />
Cham- Car- Chamo- Amer-<br />
Election District Total orro olinian linian ican Palauan Filipino Other<br />
All voters 11,114 7,567 1,446 368 955 265 372 141<br />
District 1<br />
San Antonio 805 639 3 11 54 42 50 6<br />
San Vicente 2,187 1,691 109 49 203 31 74 30<br />
Koblerville 647 415 131 34 22 14 23 8<br />
District 2<br />
Chalan Kanoa 256 214 7 0 7 19 5 4<br />
Chalan Kanoa 265 103 124 10 6 10 8 4<br />
Chalan Kanoa 302 248 6 12 8 9 12 7<br />
Susupe 218 161 15 3 10 3 20 6<br />
District 3<br />
San Jose 833 272 436 48 32 9 24 12<br />
Garapan 1,917 1,110 338 46 212 88 93 30<br />
North. Is. 38 6 31 0 0 1 0 0<br />
District 4<br />
Tanapag 513 181 170 113 31 11 1 6<br />
San Roque 345 298 11 12 15 3 6 0<br />
Capitol Hill 862 490 53 19 238 21 25 16<br />
District 5<br />
Tinian 781 687 8 3 54 3 15 11<br />
District 6<br />
Rota 1,145 1,052 4 8 63 1 16 1<br />
Source: Election Commission<br />
Table 7 .12 Number of Reg ister ed Voters by Ethnicity:<br />
Election Yea rs 1989 throug h 1997<br />
Ethnicity 1997 1995 1993 1991 1989<br />
Total 13,384 11,114 11,856 10,022 9,379<br />
Chamorro 9,003 7,567 7,989 6,904 6,549<br />
Carolinian 1,744 1,446 1,487 1,312 1,293<br />
Chamolinian 433 368 445 375 309<br />
American 1,281 955 1,150 777 586<br />
Palauan 287 265 275 250 248<br />
Filipino 508 372 376 290 253<br />
Others 128 141 134 114 141<br />
Source: Election Commission<br />
Year<br />
Central Statistics Division, Department of Commerce
<strong>1998</strong> CNMI <strong>Statistical</strong> <strong>Yearbook</strong>, Chapter 7 Page 79<br />
Table 7.13 Registered Voters: Election District by Ethnicity in 1997<br />
Figure 7.3 Registered Voters by<br />
Ethnicity, 1997<br />
Ethnicity<br />
Cham- Car- Chamo- Amer-<br />
Election District Total orro olinian linian ican Palauan Filipino Other<br />
All voters 13,384 9,003 1,744 433 1,281 287 508 128<br />
District 1<br />
San Antonio 831 638 12 13 74 34 58 2<br />
San Vicente 2,753 2,048 155 62 301 52 105 30<br />
Koblerville 1,362 920 225 60 75 31 40 11<br />
District 2<br />
Chalan Kanoa 236 191 2 4 9 15 12 3<br />
Chalan Kanoa 222 98 85 8 6 9 15 1<br />
Chalan Kanoa 313 252 4 13 13 9 18 4<br />
Susupe 261 178 15 5 25 6 23 9<br />
District 3<br />
San Jose 895 250 522 34 35 12 28 14<br />
Garapan 2,045 1,109 418 51 248 78 113 28<br />
North. Is. 40 10 30 0 0 0 0 0<br />
District 4<br />
Tanapag 589 234 180 124 30 9 11 1<br />
San Roque 466 370 22 22 35 5 12 0<br />
Capitol Hill 1,180 714 63 25 309 22 29 18<br />
District 5<br />
Tinian 929 831 5 4 59 3 21 6<br />
District 6<br />
Rota 1,262 1,160 6 8 62 2 23 1<br />
Source: Election Commission<br />
Chamorro<br />
68.1%<br />
Carolinian<br />
13.0%<br />
Other<br />
1.3%<br />
Filipino<br />
3.3%<br />
Palauan<br />
2.4%<br />
American<br />
8.6%<br />
Chamolinian<br />
3.3%<br />
Central Statistics Division, Department of Commerce
Chapter 8<br />
TOURISM
Page 82 <strong>1998</strong> CNMI <strong>Statistical</strong> <strong>Yearbook</strong>, Chapter 8<br />
Summary of Visitors<br />
The number of visitors into the Commonwealth increased annually<br />
since 1987. Unfotunately the total number of visitors in 1997 and<br />
<strong>1998</strong> decreased. In Saipan, the number of visitors consistently increased<br />
annually, except in Rota and Tinian. In Rota and Tinian,the<br />
number of visitors fluctuated from year to year and remained at<br />
somewhat the same levels from 1986 to 1994; however, in 1995, the<br />
number of visitors increased dramatically on both islands.<br />
The majority of visitors into the Commonwealth came from Japan.<br />
By fiscal year, the number of Japanese visitors increased annually,<br />
from 374,727 in 1993 to 450,190 in 1997. In <strong>1998</strong> the number<br />
reched a low of 396,228. Visitors from Korea constituted the second<br />
largest group in 1997 at 169,822 visitors, however droped in <strong>1998</strong> to<br />
39,281 visitors. The number of visitors from the United States and<br />
Guam fluctuated during this same period.<br />
The number of hotel rooms in the CNMI increased from 740 in<br />
1980 to 3,881 rooms in 1997.<br />
Estimated total visitors expenditure in the Commonwealth increased<br />
from $61 million in 1980 to about $585 million in 1997.<br />
The vast majority of the total visitors arrive at the CNMI airports,<br />
particularly, Saipan International Airport. Arrivals at the seaport<br />
constitutes a small proportion of the total number of visitors and<br />
appears to be seasonal with high numbers arriving in the months<br />
of January, March, and December and low arrivals in the months of<br />
April, June, and November.<br />
Central Statistics Division, Department of Commerce
<strong>1998</strong> CNMI <strong>Statistical</strong> <strong>Yearbook</strong>, Chapter 8 Page 83<br />
Table 8.1 CNMI Visitor s Arr ival by Month: Calenda r Yea r 1993-<strong>1998</strong><br />
Year<br />
Month <strong>1998</strong> 1997 1996 1995 1994 1993<br />
Total 490,165 694,797 736,117 676,161 596,033 545,803<br />
January 48,314 66,935 65,676 56,453 52,638 50,203<br />
February 42,618 58,360 60,125 55,318 49,044 43,985<br />
March 43,275 62,626 66,766 58,609 51,596 46,716<br />
April 37,065 56,302 55,132 46,732 41,417 36,694<br />
May 41,328 61,794 65,367 56,624 46,582 43,147<br />
June 39,636 59,940 60,548 52,419 43,077 41,053<br />
July 42,808 62,532 58,992 59,583 53,480 48,717<br />
August 43,112 60,000 64,658 65,803 59,124 55,230<br />
September 35,449 53,706 54,358 54,307 50,548 44,007<br />
October 34,137 49,202 59,564 51,691 44,973 44,051<br />
November 39,301 51,525 61,613 57,972 49,949 43,559<br />
December 43,122 51,875 63,318 60,650 53,605 48,441<br />
Source: Marianas Visitors Bureau<br />
Number of Visitors to the CNMI<br />
The number of visitors into the CNMI<br />
increased annually since 1993 but declined in<br />
1997 and <strong>1998</strong>.<br />
Number of tourists<br />
Thousands<br />
Figure 8.1 Annual number of visitors to the<br />
CNMI , 1993 to <strong>1998</strong><br />
800<br />
600<br />
400<br />
200<br />
0<br />
'93 '94 '95 '96 '97 '98<br />
Calendar Year<br />
Table 8 .2 Visitor Entr ies by Country of Citiz enship, CNMI :<br />
Fiscal Years 1993 to <strong>1998</strong><br />
Fiscal Year<br />
Country <strong>1998</strong> 1997 1996 1995 1994 1993<br />
Total 526,298 726,690 721,935 654,375 583,557 536,263<br />
Japan 396,228 450,190 437,880 409,855 388,170 374,727<br />
U.S./Guam 64,100 77,078 90,059 95,516 79,012 78,132<br />
Republic of Korea 39,281 169,822 168,517 124,007 91,155 52,963<br />
Taiwan (R.O.C.) 4,651 6,357 6,919 6,435 7,735 11,370<br />
Hong Kong 4,542 4,387 5,384 4,172 3,076 4,012<br />
United Kingdom 699 591 540 762 684 799<br />
Germany 314 222 263 386 329 296<br />
Canada 592 692 588 587 529 441<br />
New Zealand 162 199 218 319 268 270<br />
Australia 816 603 708 1,007 1,127 1,855<br />
Other countries 14,913 16,549 10,859 11,329 11,472 11,398<br />
Source: Marianas Visitors Bureau<br />
Visitors Country of Origin<br />
The majority of visitors into the CNMI came<br />
from Japan. Visitors from Korea constituted the<br />
second largest group since 1994, but<br />
decreased in <strong>1998</strong>. The number of visitors<br />
from U.S. and Guam also decreased since<br />
1996.<br />
Percent<br />
Figure 8.2 Percent Composition of Total<br />
Visitors into the CNMI by Country of Origin,<br />
1993 to <strong>1998</strong><br />
100<br />
80<br />
60<br />
40<br />
20<br />
Other<br />
Korea<br />
U.S.<br />
Japan<br />
0<br />
'93 '94 '95 96 '97 '98<br />
Year<br />
Central Statistics Division, Department of Commerce
Page 84 <strong>1998</strong> CNMI <strong>Statistical</strong> <strong>Yearbook</strong>, Chapter 8<br />
Visitors by Island<br />
The increase in the number of visitors occurred<br />
almost exclusively in Saipan. In Rota and Tinian<br />
the number of visitors fluctuated from year to<br />
year and remained at somewhat the same level<br />
from 1986 to 1996. There was a big declined<br />
in number of visitors to Tinian in 1997.<br />
Table 8.3 Visitor Entries by Isla nd of Entry: Fiscal Years 1986 to 1997<br />
Number<br />
Percent Change<br />
Fiscal Year Total Saipan Rota Tinian Total Saipan Rota Tinian<br />
1997 726,690 705,399 21,289 2 0.7 0.4 14.3 -99.5<br />
1996 721,935 702,907 18,620 408 10.3 12.2 -31.3 -49.6<br />
1995 654,375 626,447 27,119 809 12.1 10.0 94.7 230.2<br />
1994 583,557 569,381 13,931 245 8.8 8.7 15.5 -43.3<br />
1993 536,263 523,771 12,060 432 9.8 11.0 -23.0 -28.7<br />
1992 488,330 472,063 15,661 606 15.0 14.6 27.6 231.1<br />
1991 424,458 412,004 12,271 183 1.8 2.0 -5.0 -41.7<br />
1990 417,146 403,920 12,912 314 38.2 40.7 -9.5 -14.9<br />
1989 301,818 287,175 14,274 369 29.4 31.8 -6.9 169.3<br />
1988 233,291 217,818 15,336 137 25.3 29.3 -12.7 -37.2<br />
1987 186,203 168,427 17,558 218 18.4 16.3 46.0 -40.6<br />
1986 157,207 144,815 12,025 367 ... ... ... ...<br />
Source: Marianas Visitors Bureau<br />
Number of Hotel Rooms and<br />
Visitor Expenditures<br />
The number of hotel rooms in the CNMI<br />
increased from 740 in 1980 to 3,881 rooms<br />
in 1997.<br />
Estimated total visitors expenditure in the<br />
Commonwealth increased from $61 million<br />
in 1980 to about $585 million in 1997.<br />
Figure 8.3 Number of Visitor Entries and<br />
Hotel Rooms, 1987 to 1997<br />
Number of Hotel Rooms<br />
Thousands<br />
5<br />
4<br />
3<br />
2<br />
1<br />
0<br />
Rooms<br />
Visitors<br />
'87 '89 '91 '93 '95 '97<br />
'88 '90 '92 '94 '96<br />
800<br />
700<br />
600<br />
500<br />
400<br />
300<br />
200<br />
100<br />
0<br />
Number of Visitors<br />
Thousands<br />
Table 8.4 Number of Hotel Room s, Visitor Entries, and Visitor<br />
Estim ated Expenditures: Fisca l Yea rs 1 980 to 1997<br />
Est. Visitor Ave. Expen-<br />
Fiscal Hotel Visitor Expenditures ditures by<br />
Year Rooms Entries (Millions $) Visitors ($)<br />
1997 3,881 726,690 585 805<br />
1996 3,583 721,935 581 805<br />
1995 3,458 654,375 527 805<br />
1994 3,346 583,557 470 805<br />
1993 3,267 536,263 496 924<br />
1992 2,852 488,330 518 1,060<br />
1991 2,591 424,458 427 1,006<br />
1990 2,651 417,146 418 1,002<br />
1989 2,268 301,818 319 1,055<br />
1988 1,824 233,291 244 1,048<br />
1987 1,421 186,203 154 827<br />
1986 1,152 157,207 134 852<br />
1985 976 142,284 122 855<br />
1984 765 131,823 71 540<br />
1983 767 124,024 67 540<br />
1982 767 111,173 57 510<br />
1981 814 117,572 59 502<br />
1980 740 117,149 61 519<br />
Source: Marianas Visitors Bureau and Office of Planning and Budget<br />
Central Statistics Division, Department of Commerce
<strong>1998</strong> CNMI <strong>Statistical</strong> <strong>Yearbook</strong>, Chapter 8 Page 85<br />
Table 8 .5 CNMI Visitor Ar riva ls by Air : 1993 to 1997<br />
Calendar Year<br />
Month 1997 1996 1995 1994 1993<br />
TOTAL 684,990 729,273 676,161 587,801 533,790<br />
January 64,467 63,115 56,453 50,248 48,276<br />
February 57,834 59,798 55,318 48,442 43,618<br />
March 61,017 65,062 58,609 49,917 44,984<br />
April 56,302 55,132 46,732 41,417 36,694<br />
May 61,351 64,551 56,624 46,193 42,701<br />
June 59,940 60,548 52,419 43,077 40,648<br />
July 61,571 58,426 59,583 52,907 46,974<br />
August 59,418 64,083 65,803 58,561 53,801<br />
September 52,506 54,358 54,307 50,087 42,868<br />
October 49,202 59,564 51,691 44,565 42,990<br />
November 51,616 61,318 57,972 49,949 43,559<br />
December 49,766 63,318 60,650 52,438 46,677<br />
Source: Marianas Visitors Bureau<br />
Airport Arrivals<br />
The vast majority of the total visitors arrive at<br />
the CNMI airports, particularly, Saipan<br />
International Airport.<br />
Table 8 .6 CNMI Visitor Ar riva ls by Sea : 1993 to 1997<br />
Calendar Year<br />
Month 1997 1996 1995 1994 1993<br />
TOTAL 9,898 7,723 8,291 8,232 12,013<br />
January 2,468 2,561 2,493 2,390 1,927<br />
February 526 327 348 602 367<br />
March 1,609 1,704 1,646 1,679 1,732<br />
April 0 0 0 0 0<br />
May 443 816 429 389 446<br />
June 0 0 0 0 405<br />
July 961 566 583 573 1,743<br />
August 582 575 753 563 1,429<br />
September 1,200 0 461 461 1,139<br />
October 0 0 408 408 1,061<br />
November 0 0 0 0 0<br />
December 2,109 1,174 1,170 1,167 1,764<br />
Source: Marianas Visitors Bureau<br />
Seaport Arrivals<br />
Arrivals at the seaport are seasonal with high<br />
numbers arriving in the months of January,<br />
March, and December and low numbers in<br />
the months of April, June, and November.<br />
Central Statistics Division, Department of Commerce
Page 86 <strong>1998</strong> CNMI <strong>Statistical</strong> <strong>Yearbook</strong>, Chapter 8<br />
Table 8 .7 CNMI Visitor Ar riva ls by Country of Orig in, a nd Month: 1997<br />
U.S. / Hong- Phili-<br />
Month Total Japan Korea Guam Taiwan Kong ppines Others<br />
Total 694,888 447,882 141,510 75,153 7,035 4,369 4,198 14,741<br />
January 66,935 40,188 18,031 6,559 319 232 348 1,258<br />
February 58,360 37,679 12,279 5,299 984 476 330 1,313<br />
March 62,626 39,639 13,528 6,888 353 338 566 1,314<br />
April 56,302 35,423 12,952 5,639 412 267 419 1,190<br />
May 61,794 38,939 13,527 7,261 489 242 342 994<br />
June 59,940 37,652 13,228 6,652 678 312 293 1,125<br />
July 62,532 37,905 14,440 7,407 801 424 325 1,230<br />
August 60,000 36,136 15,097 6,008 782 542 330 1,105<br />
September 53,706 38,181 6,655 6,562 505 455 276 1,072<br />
October 49,202 31,347 9,546 5,704 612 368 284 1,341<br />
November 51,616 35,110 8,376 5,675 575 294 299 1,287<br />
December 51,875 39,683 3,851 5,499 525 419 386 1,512<br />
Source: Marianas Visitors Bureau<br />
Table 8 .8 CNMI Visitor Ar riva ls by Country of Orig in, a nd Month: 1996<br />
U.S. / Hong- Phili-<br />
Month Total Japan Korea Guam Taiwan Kong ppines Others<br />
Total 736,117 438,462 187,881 84,007 6,077 5,193 4,284 10,213<br />
January 65,676 38,772 17,745 7,316 518 335 256 734<br />
February 60,125 38,455 12,301 7,021 1,006 506 267 569<br />
March 66,766 41,383 15,452 8,201 497 454 244 535<br />
April 55,132 31,021 15,279 6,433 628 475 445 851<br />
May 65,367 37,278 18,394 7,942 468 380 370 535<br />
June 60,548 35,055 15,601 8,070 412 397 424 589<br />
July 58,992 34,639 14,361 7,938 666 431 401 556<br />
August 64,658 35,758 18,892 7,035 538 708 443 1,284<br />
September 54,358 37,653 9,771 5,230 310 408 335 651<br />
October 59,564 33,329 17,038 6,835 449 420 358 1,135<br />
November 61,613 37,093 16,696 5,449 307 288 374 1,406<br />
December 63,318 38,026 16,351 6,537 278 391 367 1,368<br />
Source: Marianas Visitors Bureau<br />
Central Statistics Division, Department of Commerce
<strong>1998</strong> CNMI <strong>Statistical</strong> <strong>Yearbook</strong>, Chapter 8 Page 87<br />
Table 8.9 CNMI Visitor Ar riva ls for P urpose of Business,<br />
1992 to 1997<br />
Calendar Year<br />
Month 1997 1996 1995 1994 1993 1992<br />
Total 8,483 11,205 7,246 7,259 7,859 6,900<br />
January 646 2,561 610 683 566 605<br />
February 783 327 613 525 619 769<br />
March 702 1,704 680 385 663 607<br />
April 665 816 701 555 699 623<br />
May 718 718 592 640 646 56<br />
June 718 726 694 613 618 868<br />
July 793 671 707 689 625 604<br />
August 728 744 718 669 672 532<br />
September 700 731 37 655 669 557<br />
October 680 868 367 633 733 496<br />
November 702 738 796 638 583 577<br />
December 648 601 731 574 766 606<br />
Source: Marianas Visitors Bureau<br />
Table 8.1 0 CNMI Visitor Ar riv als by Country of Or ig in for<br />
P urpose of Business :1997<br />
Hong-<br />
Month Total Japan Korea Kong Taiwan Australia Others<br />
Total 8,483 1,160 3,547 480 74 56 3,166<br />
January 646 102 270 42 0 0 232<br />
February 783 106 327 41 0 0 309<br />
March 702 108 268 47 3 0 276<br />
April 665 98 267 41 12 0 247<br />
May 718 97 285 51 0 24 261<br />
June 718 112 314 35 0 0 257<br />
July 793 110 385 24 28 0 246<br />
August 728 88 310 35 22 0 273<br />
September 700 89 278 42 0 0 291<br />
October 680 83 288 34 9 0 266<br />
November 702 101 265 39 0 31 266<br />
December 648 66 290 49 0 1 242<br />
Source: Marianas Visitors Bureau<br />
Central Statistics Division, Department of Commerce
Page 88 <strong>1998</strong> CNMI <strong>Statistical</strong> <strong>Yearbook</strong>, Chapter 8<br />
Table 8 .11 CNMI Visitor Ar riva ls by Countr y of Orig in for<br />
P ur pose of Business :1992 to 1997<br />
Calendar Year<br />
Country of Origin 1997 1996 1995 1994 1993 1992<br />
Total 8,483 11,205 7,246 7,259 7,859 6,900<br />
Japan 1,160 6,265 1,136 1,223 1,220 1,153<br />
Korea 3,547 2,531 2,815 2,634 2,423 1,675<br />
Hong Kong 480 298 390 395 296 344<br />
Taiwan 74 180 97 167 316 765<br />
Australia 56 23 187 132 224 210<br />
Others 3,166 1,908 2,621 2,708 3,380 2,753<br />
Source: Marianas Visitors Bureau<br />
Figure 8.4 Average Visitor Arrivals, CNMI:<br />
Fiscal Year <strong>1998</strong><br />
Ta ble 8 .12 CNMI Selected Visitor Arriva ls by Age, Sex, a nd<br />
Country of Orig in : Fisca l Yea r 19 98<br />
Thousands<br />
25<br />
20<br />
15<br />
10<br />
5<br />
0<br />
0 - 17 25 - 29 35 - 44 55 - 64<br />
18 - 24 30 - 34 45 - 54 65 and over<br />
Age Group<br />
Japan Korea Taiwan Hong Kong<br />
Age Group Male Female Male Female Male Female Male Female<br />
Total 208,011 173,954 17,988 17,314 2,362 2,169 2,231 1,799<br />
0 - 17 20,350 19,392 1,084 994 186 175 186 155<br />
18 - 19 1,969 2,604 48 162 14 26 17 19<br />
20 - 24 19,570 33,829 735 3,058 93 275 126 137<br />
25 - 29 34,580 42,881 5,504 6,167 355 507 271 350<br />
30 - 34 30,183 22,700 3,576 2,048 404 364 482 413<br />
35 - 39 23,302 13,489 2,210 1,428 364 248 414 320<br />
40 - 44 19,298 9,055 1,728 992 341 219 333 185<br />
45 - 49 18,882 8,650 1,050 741 243 129 189 92<br />
50 - 54 15,270 7,498 815 597 142 66 101 48<br />
55 - 59 10,963 5,673 560 487 85 57 38 20<br />
60 - 64 7,037 3,925 347 305 52 48 40 20<br />
65 and over 6,607 4,258 331 335 83 55 34 40<br />
Source: Marianas Visitors Bureau<br />
Table 8 .13 CNMI Selected Visitor Arriva ls by Sex, Ag e, and<br />
Country of Origin : Fiscal Yea r 19 97<br />
Japan Korea Taiwan Hong Kong<br />
Age Group Male Female Male Female Male Female Male Female<br />
Total 232,141 197,829 76,918 88,196 3,290 2,897 2,112 1,813<br />
0 - 17 21,006 20,631 6,658 6,278 378 325 186 148<br />
18 - 19 2,351 3,403 206 769 16 36 19 22<br />
20 - 24 23,857 42,917 2,849 13,112 118 327 133 144<br />
25 - 29 40,040 48,707 19,781 24,455 439 676 274 397<br />
30 - 34 32,767 23,643 13,681 9,101 551 496 471 402<br />
35 - 39 25,419 14,092 9,369 8,154 453 329 400 331<br />
40 - 44 21,305 10,206 7,685 6,766 476 234 272 167<br />
45 - 49 22,622 10,457 4,841 5,102 335 151 175 93<br />
50 - 54 15,723 8,162 3,713 4,720 198 111 92 42<br />
55 - 59 11,706 6,279 3,253 4,302 139 96 36 22<br />
60 - 64 7,820 4,400 2,503 2,972 93 57 30 21<br />
65 and over 7,525 4,932 2,379 2,465 94 59 24 24<br />
Source: Marianas Visitors Bureau<br />
Central Statistics Division, Department of Commerce
Chapter 9<br />
HOUSING
Page 90 <strong>1998</strong> CNMI <strong>Statistical</strong> <strong>Yearbook</strong>, Chapter 9<br />
Summary of Housing<br />
In 1995, over 71 percent of all housing units had concrete<br />
walls, about 14.1 percent had metal walls and over 13 percent<br />
had wooden walls. This was a major change from 1980 and prior<br />
census years when more than half of all housing units had either<br />
metal or wooden walls. Also in 1995, over 50 percent of total units<br />
had concrete roofs and 46 percent had metal roofs. This was the<br />
turning point from 1990 when 48 percent of housing units had<br />
concrete roofs and about 50 percent had metal roofs and in<br />
1980, about 60 percent of housing units had metal roofs.<br />
The number of housing units (12,057) in the Commonwealth<br />
in 1995 increased 47 percent from 1990 (8,210). The increased<br />
number of units reflected the increased demand for housing by<br />
a growing population and a prospering economy. More than half<br />
of all units in 1995 were built between 1980 and 1995, a period of<br />
high growth in population and economic development in the<br />
CNMI. There were more multiple-unit structures in 1995,<br />
compared to 1990. Over 90 percent of all housing units were<br />
located in Saipan in 1995, where most people and businesses<br />
are located.<br />
Central Statistics Division, Department of Commerce
<strong>1998</strong> CNMI <strong>Statistical</strong> <strong>Yearbook</strong>, Chapter 9 Page 91<br />
About 40 percent of housing units in 1995 had complete<br />
plumbing. This was a major impact from 1990 when over 72<br />
percent of all units had complete plumbing and about 30 percent<br />
were without complete plumbing. In 1995, about 78 percent of<br />
housing units get their water solely from the public system, about<br />
16 percent depended on both the public system and private water<br />
catchments, and 4 percent relied solely on private water<br />
catchment systems. In 1990, over 66 percent of housing units got<br />
their water from the public system only.<br />
In 1995 over 35 percent of housing units were connected to<br />
public sewer systems, about 57 percent were using septic tanks/<br />
cesspools, and almost 8 percent used other means of disposing<br />
sewage.<br />
In absolute numbers, more housing units had electricity,<br />
cooking facilities, and refrigerators in 1995 than in 1990. CNMIwide,<br />
around 98 percent of housing units had electricity; by<br />
island,over 98 percent of Saipan's housing units, about<br />
99percent of Tinian’s housing units, 89 percent of Rota’s housing<br />
units had electricity. CNMI-wide , 90 percent of housing units had<br />
refrigerators; by island, 90 percent of Saipan’s total units, 94<br />
percent of Tinian’s total units, and 79 percent of Rota’s units had<br />
refrigerators. About 68 percent of total CNMI units had air<br />
conditioning; over 68 percent of Saipan’s units, over 58 percent of<br />
Rota’s units and about 67 percent of Tinian’s units had air<br />
conditioning.<br />
CNMI-wide, 90 percent of housing units had cooking facilities<br />
inside the building, almost 9 percent had cooking facilities<br />
outside the building and over 1 percent had no cooking facilities<br />
in 1995. About 39 percent of units in the CNMI had no telephones,<br />
around 15 percent had no radios, and a little over 13 percent had<br />
no television.<br />
The median number of rooms was 4.4 in 1995. This was not<br />
too far from 1990 median of 4.0. Median persons per unit was 4.0<br />
persons in 1995, a decline from 1990 median (4.2 persons) and<br />
1980 median (5.4 persons).<br />
Owner-occupied housing units constituted over 33 percent of<br />
total CNMI housing units, about 43 percent were renter-occupied<br />
units. Over 45 percent of Saipan’s units, 28 percent of Tinian’s<br />
units and about 21 percent of Rota’s units were renter-occupied<br />
in 1995. Over 80 percent of total population (58,846) in 1995 lived<br />
in housing units; of those in housing units, 36 percent (21,279<br />
persons) were in owner occupied units and 28 percent (16,648<br />
persons) were in renter occupied units. A higher proportion of<br />
Rota’s and Tinian’s populations were in owner-occupied units,<br />
compared to Saipan’s population.<br />
Central Statistics Division, Department of Commerce
Page 92 <strong>1998</strong> CNMI <strong>Statistical</strong> <strong>Yearbook</strong>, Chapter 9<br />
Total Housing Units<br />
The total number of housing units (12,057)<br />
in the Commonwealth increased 47 percent<br />
in 1995 from the total number of housing<br />
units (8,210) in 1990. The increased<br />
number of units reflected the increased<br />
demand for housing by a growing population<br />
and an expanding economy.<br />
Table 9 .1 Units in Structure: 1 990 a nd 1995<br />
Percent<br />
Change<br />
Number 1990 to Percent<br />
Units in Structure 1995 1990 1995 1995 1990<br />
Total 12,057 8,210 46.9 100.0 100.0<br />
1, detached 6,702 5,864 14.3 55.6 71.4<br />
1, attached 1,520 850 78.8 12.6 10.4<br />
2 286 126 127.0 2.4 1.5<br />
3 or 4 717 445 61.1 5.9 5.4<br />
5 to 9 1083 431 151.3 9.0 5.2<br />
10 to 19 671 276 143.1 5.6 3.4<br />
20 or more 466 71 556.3 3.9 0.9<br />
Other 612 147 316.3 5.1 1.8<br />
Source: 1990 CPH-6-CNMI Table 101, and 1995 Mid-Decade Census Table 147<br />
Housing Units by Islands<br />
About 90 percent of all housing units were<br />
located in Saipan in 1995, where most<br />
people and businesses are located.<br />
Ta ble 9.2 Units in Structur e by Isla nd: 19 95<br />
Numbers<br />
Percent<br />
Units in North. North.<br />
Structure Total Saipan Rota Tinian Is. Total Saipan Rota Tinian Is.<br />
Total 12,057 10,844 690 522 1 100.0 89.9 5.7 4.3 0.0<br />
1, detached 6,702 5,789 532 380 1 55.6 53.4 77.1 72.8 100.0<br />
1, attached 1,520 1,364 74 82 0 12.6 12.6 10.7 15.7 0.0<br />
2 286 266 11 9 0 2.4 2.5 1.6 1.7 0.0<br />
3 or 4 717 688 18 11 0 5.9 6.3 2.6 2.1 0.0<br />
5 to 9 1,083 1,032 26 25 0 9.0 9.5 3.8 4.8 0.0<br />
10 to 19 671 664 5 2 0 5.6 6.1 0.7 0.4 0.0<br />
20 or more 466 466 0 0 0 3.9 4.3 0.0 0.0 0.0<br />
Other 612 575 24 13 0 5.1 5.3 3.5 2.5 0.0<br />
Source: 1995 Mid-Decade Census Table Table 147<br />
Central Statistics Division, Department of Commerce
<strong>1998</strong> CNMI <strong>Statistical</strong> <strong>Yearbook</strong>, Chapter 9 Page 93<br />
Table 9.3 Yea r Structure Built by Isla nd: 1995<br />
Island<br />
Year Structure Built Total Saipan Rota Tinian North. Is.<br />
Total 12,057 10,844 690 522 1<br />
1994-March 1995 666 589 49 28 0<br />
1990-1993 2,641 2,300 199 142 0<br />
1980-1989 3,422 2,907 253 261 1<br />
1970-1979 790 645 97 48 0<br />
1960-1969 264 239 18 7 0<br />
1950-1959 138 134 1 3 0<br />
1940-1949 34 31 0 3 0<br />
1939 or earlier 22 19 2 1 0<br />
Source: 1995 CNMI Mid-Decade Census Table 147<br />
Table 9 .4 Ma ter ia l for Outside Wa lls: 1980, 1990, a nd 1995<br />
Percent Change<br />
Number 1990 1980 Percent<br />
Type of Material 1995 1990 1980 to 1995 to 1990 1995 1990 1980<br />
Year Structures were Built<br />
More than half of all existing units in 1995<br />
were built between 1980 and 1995, a<br />
period of high growth in population and<br />
economic development in the CNMI. There<br />
were more multiple-unit structures in 1995<br />
than in 1990.<br />
Outside Wall Materials<br />
In 1995, over 71 percent of all housing units<br />
had concrete walls, over 14 percent had metal<br />
walls and over 13 percent had wooden walls.<br />
This was a major change from 1980 and prior<br />
census years when more than half of all housing<br />
units had either metal or wooden walls.<br />
Figure 9.1 Materials for Outside Walls,<br />
1980, 1990 and 1995<br />
100<br />
Wood Wood Wood<br />
Total 12,057 8,210 3,373 46.9 143.4 100.0 100.0 100.0<br />
Concrete 8,619 5,460 1,408 57.9 287.8 71.5 66.5 41.7<br />
Poured 1,733 941 223 84.2 322.0 14.4 11.5 6.6<br />
Blocks 6,886 4,519 1,185 52.4 281.4 57.1 55.0 35.1<br />
Metal 1,695 1,625 1,068 4.3 52.2 14.1 19.8 31.7<br />
Wood 1,649 1,106 895 49.1 23.6 13.7 13.5 26.5<br />
Other 94 19 2 394.7 850.0 0.8 0.2 0.1<br />
Unknown 0 0 0 ... ... 0.0 0.0 0.0<br />
Source: HC80-1-A57A Table 9, 1990 CPH-6-CNMI Table 105, and 1995 Census Mid-Decade Table 148<br />
Percent<br />
80<br />
60<br />
40<br />
Metal<br />
Concrete<br />
Metal<br />
Concrete<br />
Metal<br />
Concrete<br />
20<br />
Table 9 .5 Ma ter ia l for Roof: 1980, 1990 , a nd 1995<br />
Percent Change<br />
Number 1990 1980 Percent<br />
Type of Material 1995 1990 1980 to 1995 to 1990 1995 1990 1980<br />
Total 12,057 8,210 3,373 46.9 143.4 100.0 100.0 100.0<br />
Concrete 6,081 3,952 1,125 53.9 251.3 50.4 48.1 33.4<br />
Metal 5,557 4,064 2,019 36.7 101.3 46.1 49.5 59.9<br />
Wood 317 124 206 155.6 -39.8 2.6 1.5 6.1<br />
Thatch 12 9 1 33.3 800.0 0.1 0.1 0.0<br />
Other 90 61 22 47.5 177.3 0.7 0.7 0.7<br />
Source: 1980 Census Table 9, 1990 Census Table 105, and 1995 CNMI Mid-Decade Census Table 148<br />
0<br />
Roof Materials<br />
1980 1990 1995<br />
Census Years<br />
Also in 1995, over 50 percent of total units had<br />
concrete roofs and 46 percent had metal roofs.<br />
This was a significant change from 1990 when<br />
48 percent of housing units had concrete roofs<br />
and about 50 percent had metal roofs. In<br />
1980, over 59 percent of housing units had<br />
metal roofs.<br />
Central Statistics Division, Department of Commerce
Page 94 <strong>1998</strong> CNMI <strong>Statistical</strong> <strong>Yearbook</strong>, Chapter 9<br />
Plumbing<br />
About 40 percent of housing units in 1995<br />
had complete plumbing, while about 60<br />
percent lacked complete plumbing. This was<br />
a major decline from 1990 when over 72<br />
percent of all units had complete plumbing.<br />
Table 9 .6 P lumbing Facilities: 1 990 a nd 1995<br />
Percent<br />
Change<br />
Number 1990 to Percent<br />
Plumbing Facilities 1995 1990 1995 1995 1990<br />
Total 12,057 8,210 46.9 100.0 100.0<br />
With complete plumbing 4,807 5,920 -18.8 39.9 72.1<br />
With hot & cold water 2,730 2,849 -4.2 22.6 34.7<br />
With cold water only 2,077 3,071 -32.4 17.2 37.4<br />
Lacking complete plumbing 7,250 2,290 216.6 60.1 27.9<br />
Source: 1990 CPH-6-CNMI Table 103, and 1995 CNMI Mid-Decade Census Table 150<br />
Source of Water<br />
In 1995, almost 78 percent of housing units<br />
got their water solely from the public water<br />
system, 16 percent depended on both the<br />
public water system and private water<br />
catchments, and about 4 percent relied solely<br />
on private water catchment systems. In 1990,<br />
over 66 percent of housing units got their water<br />
from the public system only.<br />
Table 9 .7 Sour ce of Wa ter: 1990 a nd 1995<br />
Percent<br />
Change<br />
Number 1990 to Percent<br />
Source of Water 1995 1990 1995 1995 1990<br />
Total 12,057 8,210 46.9 100.0 100.0<br />
Public system only 9,389 5,462 71.9 77.9 66.5<br />
Public system and catchment 1,921 2,236 -14.1 15.9 27.2<br />
Catchment, tanks, or drums only 456 267 70.8 3.8 3.3<br />
Individual well ... 123 -100.0 0.0 1.5<br />
Public standpipe or street hydrant 35 6 483.3 0.3 0.1<br />
Other source 256 116 120.7 2.1 1.4<br />
Source: 1990 CPH-6-CNMI Table 104, and 1995 CNMI Mid-Decade Census Table 151<br />
Table 9 .8 Sour ce of Wa ter by Island: 1995<br />
Island<br />
Source of Water Total Saipan Rota Tinian North. Is.<br />
Total 12,057 10,844 690 522 1<br />
Public system only 9,389 8,232 642 515 0<br />
Public system and catchment 1,921 1,909 6 6 0<br />
Catchment, drums, or tanks only 456 437 19 0 0<br />
Public standpipe or street hydrant 35 28 7 0 0<br />
Some other source 256 238 16 1 1<br />
Source: 1995 CNMI Mid-Decade Census Table 151<br />
Central Statistics Division, Department of Commerce
<strong>1998</strong> CNMI <strong>Statistical</strong> <strong>Yearbook</strong>, Chapter 9 Page 95<br />
Table 9 .9 Sewage Disposal by Isla nd: 1995<br />
Sewage Disposal<br />
Number<br />
Percent<br />
N. N.<br />
Sewage Disposal Total Saipan Rota Tinian Isl. Total Saipan Rota Tinian Isl.<br />
Total 12,057 10,844 690 522 1 100.0 100.0 100.0 100.0 100.0<br />
Public sewer 4,226 4,174 17 35 0 35.1 38.5 2.5 6.7 0.0<br />
Septic tank/cesspool 6,922 5,852 608 461 1 57.4 54.0 88.1 88.3 100.0<br />
Other means 909 818 65 26 0 7.5 7.5 9.4 5.0 0.0<br />
Source: 1995 CNMI Mid-Decade Census Table 151<br />
A littleover 35 percent of housing units were<br />
connected to public sewer systems, about 57<br />
percent were using septic tanks/cesspools, and<br />
almost 8 percent used other means of sewage<br />
disposal.<br />
Table 9 .10 Electricity, Cooking Facilities, a nd Refrig er ator : 1 990 a nd 1995<br />
Percent<br />
Change<br />
Number 1990 to Percent<br />
Characteristic 1995 1990 1995 1995 1990<br />
Total 12,057 8,210 46.9 100.0 100.0<br />
Electricity 11,800 7,481 57.7 97.9 91.1<br />
Cooking Facilities 11,890 7,209 64.9 98.6 87.8<br />
Refrigerator 10,853 6,787 59.9 90.0 82.7<br />
Source: 1990 CPH-6-CNMI Table 104, and 1995 CNMI Mid-Decade Census Table 152<br />
Electricity<br />
More housing units had electricity, cooking<br />
facilities, and refrigerators in 1995 than in 1990.<br />
CNMI-wide, around 98 percent of housing<br />
units had electricity; by island, over 98 percent<br />
of Saipan’s housing units, about 99 percent of<br />
Tinian’s housing units and 89 percent of Rota’s<br />
housing units had electricity.<br />
Table 9 .11 Electric P ower by Isla nd: 1995<br />
Numbers<br />
Percent<br />
N. N.<br />
Electric Power Total Saipan Rota Tinian Isl. Total Saipan Rota Tinian Isl.<br />
Total 12,057 10,844 690 522 1 100.0 100.0 100.0 100.0 100.0<br />
With electricity 11,800 10,670 614 516 0 97.9 98.4 89.0 98.9 0.0<br />
No electricity 257 174 76 6 1 2.1 1.6 11.0 1.1 100.0<br />
Source: 1995 CNMI Mid-Decade Census Table 152<br />
Central Statistics Division, Department of Commerce
Page 96 <strong>1998</strong> CNMI <strong>Statistical</strong> <strong>Yearbook</strong>, Chapter 9<br />
Home Air Conditioning<br />
In 1995, Over 67 percent of total CNMI<br />
units had air conditioning; over 68 percent of<br />
Saipan’s units, over 58 percent of Rota’s units<br />
and about 66 percent of Tinian’s units had air<br />
conditioning.<br />
Table 9 .12 Air Conditioning by Island: 1995<br />
Number<br />
Percent<br />
N. N.<br />
Air Conditioning Total Saipan Rota Tinian Isl. Total Saipan Rota Tinian Isl.<br />
Total 12,057 10,844 690 522 1 100.0 100.0 100.0 100.0 100.0<br />
None 3,897 3,436 286 174 1 32.3 31.7 41.4 33.3 100.0<br />
Central system 1,259 1,201 29 29 0 10.4 11.1 4.2 5.6 0.0<br />
Individual Room 3,981 3,626 187 168 0 33.0 33.4 27.1 32.2 0.0<br />
2 or more room units 2,920 2,581 188 151 0 24.2 23.8 27.2 28.9 0.0<br />
Source: 1995 CNMI Mid-Decade Census Table 152<br />
Home Refrigerators<br />
In 1995, CNMI-wide , about 90 percent of<br />
housing units had refrigerators; by island, 90<br />
percent of Saipan’s total units, 94 percent of<br />
Tinian’s total units, and 79 percent of Rota’s<br />
units had refrigerators.<br />
Table 9 .13 Refr igera tor by Isla nd: 1995<br />
Numbers<br />
Percent<br />
N. N.<br />
Refrigerator Total Saipan Rota Tinian Isl. Total Saipan Rota Tinian Isl.<br />
Total 12,057 10,844 690 522 1 100.0 100.0 100.0 100.0 100.0<br />
Electric 10,806 9,779 540 487 0 89.6 90.2 78.3 93.3 0.0<br />
Gas 47 42 2 3 0 0.4 0.4 0.3 0.6 0.0<br />
No refrigerator 1,204 1,023 148 32 1 10.0 9.4 21.4 6.1 100.0<br />
Source: 1995 CNMI Mid-Decade Census Table 152<br />
Home Telephones, Radios and Televisions<br />
In 1995, 39 percent of units in the CNMI had<br />
no telephones, around 15 percent had no<br />
radios, and a little over 13 percent had no<br />
television.<br />
Table 9 .14 Telephone, Radio, and Television by Isla nd: 1995<br />
Numbers<br />
Percent<br />
N. N.<br />
Characteristic Total Saipan Rota Tinian Isl. Total Saipan Rota Tinian Isl.<br />
Total 12,057 10,844 690 522 1 ... ... ... ... ...<br />
No telephone 4,697 4,124 322 250 0 39.0 38.0 46.7 47.9 0.0<br />
No radio 1,752 1,592 77 83 1 14.5 14.7 11.2 15.9 100.0<br />
No television 1,576 1,348 168 59 0 13.1 12.4 24.3 11.3 0.0<br />
Source: 1995 CNMI Mid-Decade Census Table 152<br />
Central Statistics Division, Department of Commerce
<strong>1998</strong> CNMI <strong>Statistical</strong> <strong>Yearbook</strong>, Chapter 9 Page 97<br />
Ta ble 9.15 Cooking Facilities, and Fuel for Cooking by Island: 1 995<br />
Numbers<br />
Percent<br />
COOKING FACILITIES Total Saipan Rota Tinian N. Is. Total Saipan Rota Tinian N. Is.<br />
Total 12,057 10,844 690 522 1 100.0 100.0 100.0 100.0 100.0<br />
Cook fac inside bldg 10,862 9,816 563 483 0 90.1 90.5 81.6 92.5 0.0<br />
Cook fac outside bldg 1,028 875 116 36 1 8.5 8.1 16.8 6.9 100.0<br />
No cooking facilities 167 153 11 3 0 1.4 1.4 1.6 0.6 0.0<br />
Home Cooking Facilities<br />
CNMI-wide, 90 percent of housing units had<br />
cooking facilities inside the building, almost 9<br />
percent had cooking facilities outside the building<br />
and a little over 1 percent had no cooking<br />
facilities in 1995.<br />
Complete kitchen fac 10,178 9,170 529 479 0 84.4 84.6 76.7 91.8 0.0<br />
Lacking complete kitchen fac 1,879 1,674 161 43 1 15.6 15.4 23.3 8.2 100.0<br />
Some but not all kitchen fac 1,795 1,602 149 43 1 14.9 14.8 21.6 8.2 100.0<br />
No kitchen facilities 84 72 12 0 0 0.7 0.7 1.7 0.0 0.0<br />
FUEL FOR COOKING<br />
Fuel used most for cooking 11,816 10,634 664 517 1 98.0 98.1 96.2 99.0 100.0<br />
Electricity 6,883 6,180 339 364 0 57.1 57.0 49.1 69.7 0.0<br />
Gas: bottled or tank (LPG) 3,804 3,475 222 107 0 31.6 32.0 32.2 20.5 0.0<br />
Kerosene 283 265 4 13 1 2.3 2.4 0.6 2.5 100.0<br />
Electricity and Gas 610 545 45 20 0 5.1 5.0 6.5 3.8 0.0<br />
Electricity and Kerosene 40 36 2 2 0 0.3 0.3 0.3 0.4 0.0<br />
Gas and Kerosene 21 16 4 1 0 0.2 0.1 0.6 0.2 0.0<br />
Elect., Gas, and Kerosene 23 16 1 6 0 0.2 0.1 0.1 1.1 0.0<br />
Other 119 68 47 4 0 1.0 0.6 6.8 0.8 0.0<br />
No cooking facilities 74 57 15 2 0 0.6 0.5 2.2 0.4 0.0<br />
Source: 1995 Mid-Decade Census Table 152<br />
Table 9 .16 Rooms in unit: 1980, 1990, and 1 995<br />
Percent Change<br />
Number 1990 to 1980 to Percent<br />
Rooms 1995 1990 1980 1995 1990 1995 1990 1980<br />
Rooms in Units<br />
The median number of rooms was 4.4<br />
in1995. In 1990, the median of 4.0 was not<br />
too far from the 1980 median of 4.1<br />
Total 12,057 8,210 3,373 46.9 143.4 100.0 100.0 100.0<br />
1 room 1,351 677 156 99.6 334.0 11.2 8.2 4.6<br />
2 rooms 1,623 1,007 316 61.2 218.7 13.5 12.3 9.4<br />
3 rooms 1,991 1,524 639 30.6 138.5 16.5 18.6 18.9<br />
4 rooms 2,733 1,975 886 38.4 122.9 22.7 24.1 26.3<br />
5 rooms 2,122 1,714 852 23.8 101.2 17.6 20.9 25.3<br />
6 rooms 1097 790 359 38.9 120.1 9.1 9.6 10.6<br />
7 rooms 552 265 98 108.3 170.4 4.6 3.2 2.9<br />
8 or more rooms 588 258 67 127.9 285.1 4.9 3.1 2.0<br />
Median 4.4 4.0 4.1 ... ... ... ... ...<br />
Source: 1980 Census Table 9, and 1990 Census Table 102, and 1995 CNMI Mid-Decade Census Table 149<br />
Central Statistics Division, Department of Commerce
Page 98 <strong>1998</strong> CNMI <strong>Statistical</strong> <strong>Yearbook</strong>, Chapter 9<br />
Persons in Units<br />
The median of persons per unit was 4.0<br />
persons in 1995, a definite decline from 1980<br />
median of 5.4 persons and 1990 median of<br />
4.2 persons. Persons per room decreased<br />
from 1990 to 1995.<br />
Table 9 .17 P ersons in Units: 1 980, 1990, and 1995<br />
Percent Change<br />
Number 1990 to 1980 to Percent<br />
Persons 1995 1990 1980 1995 1990 1995 1990 1980<br />
Total 12,057 6,873 3,028 75.4 127.0 100.0 100.0 100.0<br />
1 person 1,966 787 252 149.8 212.3 16.3 11.5 8.3<br />
2 persons 2,335 1,021 359 128.7 184.4 19.4 14.9 11.9<br />
3 persons 1,802 914 365 97.2 150.4 14.9 13.3 12.1<br />
4 persons 1,732 1,052 389 64.6 170.4 14.4 15.3 12.8<br />
5 persons 1,428 828 382 72.5 116.8 11.8 12.0 12.6<br />
6 persons 1,006 761 318 32.2 139.3 8.3 11.1 10.5<br />
7 persons 681 508 341 34.1 49.0 5.6 7.4 11.3<br />
8 or more persons 1,107 1,002 622 10.5 61.1 9.2 14.6 20.5<br />
Median 4.0 4.2 5.4 ... ... ... ... ...<br />
Source: 1980 Census Table 9, and 1990 Census Table 102, and 1995 CNMI Mid-Decade Census Table 149<br />
Table 9 .18 P ersons per Room : 1980, 1990, a nd 1995<br />
Percent Change<br />
Number 1990 to 1980 to Percent<br />
Persons per Room 1995 1990 1980 1995 1990 1995 1990 1980<br />
Total 12,057 6,873 3,028 75.4 127.0 100.0 100.0 100.0<br />
0.50 or less 1,437 1,191 464 20.7 156.7 11.9 17.3 15.3<br />
0.51 to 0.75 2,379 830 351 186.6 136.5 19.7 12.1 11.6<br />
0.76 to 1.00 1,221 1,704 581 -28.3 193.3 10.1 24.8 19.2<br />
1.01 to 1.50 4,183 1,489 629 180.9 136.7 34.7 21.7 20.8<br />
1.51 or more 2,837 1,659 1,003 71.0 65.4 23.5 24.1 33.1<br />
Median 0.98 1.13 1.10 ... ... ... ... ...<br />
Source: 1980 Census Table 9, and 1990 Census Table 102, and 1995 CNMI Mid-Decade Census Table 149<br />
Tenure and Persons per Occupied<br />
Housing Units<br />
Owner-occupied housing units constituted<br />
over 33 percent of total CNMI housing<br />
units, 43 percent were renter-occupied<br />
units. Over 45 percent of Saipan’s units, 28<br />
percent of Tinian’s units and over 21 percent<br />
of Rota’s units were renter-occupied in<br />
1995. Over 80 percent of total population<br />
(47,630) in 1995 lived in housing units; of<br />
those in housing units, 36 percent (21,279<br />
persons) were in owner occupied units and 28<br />
percent (16,648 persons) were in renter<br />
occupied units. A higher proportion of Rota’s<br />
and Tinian’s populations were in owneroccupied<br />
units, compared to Saipan’s<br />
population.<br />
Table 9 .19 Tenure and P ersons per Occupied Housing Unit by Isla nd: 1995<br />
Island<br />
Occupied Housing Units Total Saipan Rota Tinian N. Isl.<br />
Occupied housing units 12,057 10,844 690 522 1<br />
Owner-occupied 4,037 3,486 354 196 1<br />
Percent 33.5 32.1 51.3 37.5 100.0<br />
Renter-occupied 5,219 4,927 146 146 0<br />
Occupied without payment of cash rent 2,801 2,431 190 180 0<br />
Total persons 58,846 52,698 3,509 2,631 8<br />
Persons in occupied units 47,630 42,034 3,075 2,513 8<br />
Owner occupied 21,279 18,278 1,847 1,146 8<br />
Renter occupied 16,648 15,560 529 559 0<br />
Persons per occupied units 4.0 3.9 4.5 4.8 8.0<br />
Owner-occupied 5.3 5.2 5.2 5.8 8.0<br />
Renter-occupied 3.2 3.2 3.6 3.8 ...<br />
Source: 1995 CNMI Mid-Decade Census Table 6 and Table 146<br />
Central Statistics Division, Department of Commerce
<strong>1998</strong> CNMI <strong>Statistical</strong> <strong>Yearbook</strong>, Chapter 9 Page 99<br />
Table 9 .20 Va lue of Owner-occupied Housing Units by Isla nd:1995<br />
Numbers<br />
Percent<br />
N. N.<br />
Value Total Saipan Rota Tinian Isl. Total Saipan Rota Tinian Isl.<br />
Total 4,037 3,486 354 196 1 100.0 100.0 100.0 100.0 100.0<br />
Less than $10,000 85 79 3 3 0 2.1 2.3 0.8 1.5 0.0<br />
$10,000 to $14,999 30 27 1 2 0 0.7 0.8 0.3 1.0 0.0<br />
$15,000 to $19,999 25 22 1 2 0 0.6 0.6 0.3 1.0 0.0<br />
$20,000 to $29,999 89 77 9 3 0 2.2 2.2 2.5 1.5 0.0<br />
$30,000 to $39,999 114 96 15 2 1 2.8 2.8 4.2 1.0 100.0<br />
$40,000 to $49,999 86 63 17 6 0 2.1 1.8 4.8 3.1 0.0<br />
$50,000 to $59,999 154 124 22 8 0 3.8 3.6 6.2 4.1 0.0<br />
$60,000 to $69,999 76 53 15 8 0 1.9 1.5 4.2 4.1 0.0<br />
$70,000 to $79,999 136 119 10 7 0 3.4 3.4 2.8 3.6 0.0<br />
$80,000 to $89,999 133 114 16 3 0 3.3 3.3 4.5 1.5 0.0<br />
$90,000 to $99,999 30 26 3 1 0 0.7 0.7 0.8 0.5 0.0<br />
$100,000 to $149,999 572 484 53 35 0 14.2 13.9 15.0 17.9 0.0<br />
$150,000 to $199,999 468 390 49 29 0 11.6 11.2 13.8 14.8 0.0<br />
$200,000 to $299,999 638 542 62 34 0 15.8 15.5 17.5 17.3 0.0<br />
$300,000 to $399,999 326 275 40 11 0 8.1 7.9 11.3 5.6 0.0<br />
$400,000 to $499,999 91 82 6 3 0 2.3 2.4 1.7 1.5 0.0<br />
$500,000 or more 984 913 32 39 0 24.4 26.2 9.0 19.9 0.0<br />
Source: 1995 CNMI Mid-Decade Census Table 153<br />
Value of Owner-occupied Housing Units<br />
In 1995, 24.4 percent of home-owners<br />
valued their homes at $500,000, or more,<br />
15.8 percent valued their homes between<br />
$200,000 and $299,999; 14.2 percent<br />
valued their homes between $100,000 and<br />
$149,999, 11.6 percent valued their homes<br />
between 150,000 and $199,999 and 8.1<br />
percent valued their homes between<br />
$300,000 and $399,999.<br />
Table 9 .21 Contra ct Rent by Island: 1995<br />
Numbers<br />
Percent<br />
Contract Rent Total Saipan Rota Tinian Total Saipan Rota Tinian<br />
Total 8,020 7,358 336 326 100.0 100.0 100.0 100.0<br />
Contract Rent<br />
In 1995, the mean contract rent for renteroccupied<br />
housing units was $317.00. The<br />
median rent in 1995 was $429.00<br />
Less than $100 488 456 18 14 6.1 6.2 5.4 4.3<br />
$100 to $149 466 448 6 12 5.8 6.1 1.8 3.7<br />
$150 to $199 311 292 8 11 3.9 4.0 2.4 3.4<br />
$200 to $249 304 282 9 13 3.8 3.8 2.7 4.0<br />
$250 to $299 259 246 5 8 3.2 3.3 1.5 2.5<br />
$300 to $349 323 301 8 14 4.0 4.1 2.4 4.3<br />
$350 to $399 268 251 8 9 3.3 3.4 2.4 2.8<br />
$400 to $449 334 304 10 20 4.2 4.1 3.0 6.1<br />
$450 to $499 173 161 8 4 2.2 2.2 2.4 1.2<br />
$500 to $599 528 492 20 16 6.6 6.7 6.0 4.9<br />
$600 to $699 533 499 26 8 6.6 6.8 7.7 2.5<br />
$700 to $799 404 388 7 9 5.0 5.3 2.1 2.8<br />
$800 to $899 270 258 7 5 3.4 3.5 2.1 1.5<br />
$900 to $999 124 124 0 0 1.5 1.7 0.0 0.0<br />
$1000 to $1999 362 357 3 2 4.5 4.9 0.9 0.6<br />
$2000 or more 72 68 3 1 0.9 0.9 0.9 0.3<br />
No cash rent 2,801 2,431 190 180 34.9 33.0 56.5 55.2<br />
Median (dollars) 429 431 456 356 ... ... ... ...<br />
Mean (dollars) 317 329 197 164 ... ... ... ...<br />
Source: 1995 Mid-Decade Census Table 155<br />
Central Statistics Division, Department of Commerce
Chapter 10<br />
TRANSPORTATION<br />
AND<br />
COMMUNICATION
Page 102 <strong>1998</strong> CNMI <strong>Statistical</strong> <strong>Yearbook</strong>, Chapter 10<br />
Summary of Transportation and Communication<br />
According to the Bureau of Motor Vehicles, the number of registered<br />
vehicles in Saipan declined from 1992 to 1995, but increased<br />
significantly in 1996. The number of registered vehicles declined<br />
from 18,644 vehicles in 1996 to 15,221 in 1997. In Tinian, the number<br />
of registered vehicles fluctuated from 1992 to 1997, while in Rota,<br />
the number increased annually from 1992 to 1996.<br />
There were about the same number of vehicles per family in the<br />
Commonwealth in 1990 and 1995.<br />
Although the reported number may contain some inaccuracies,<br />
the number of government vehicles increased dramatically from<br />
1990 to 1991. Since then, the number of government vehicles declined,<br />
with the exception of 1997, in which 287 vehicles were registered.<br />
The number of sea vessels in Saipan increased annually since<br />
1992. Most of the increase was in the number of vessels for subsistence<br />
and/or recreational fishing and in the number of part-time<br />
commercial vessels.<br />
Since 1982, the number of installed telephones increased annually,<br />
both residential and business telephones increased.<br />
Central Statistics Division, Department of Commerce
<strong>1998</strong> CNMI <strong>Statistical</strong> <strong>Yearbook</strong>, Chapter 10 Page 103<br />
Table 10.1 Num ber of Reg istered Vehicles in Sa ipa n: 1992-1997<br />
Total Number of Registered Vehicles<br />
Year<br />
Type of Vehicle 1997 1996 1995 1994 1993 1992<br />
Saipan 15,221 18,644 13,214 16,167 17,249 17,372<br />
New registration 1,736 2,061 1,348 1,659 1,676 2,180<br />
Renewal 13,266 15,424 11,489 14,132 14,526 14,386<br />
Heavy equipment 219 1,159 377 376 1,047 806<br />
Source: Bureau of Motor Vehicles, Saipan<br />
The number of registered vehicles in Saipan<br />
declined from 1992 to 1995, but increased<br />
significantly in 1996. In 1997, the number of<br />
registered vehicles declined. In Tinian, the<br />
number of registered vehicles fluctuated from<br />
1992 to 1997, while in Rota, the number<br />
increased from 1992 to 1996.<br />
Table 10.2 Type and Number of Vehicles in Tinia n: 1992 - 1997<br />
Year<br />
Type of Vehicle 1997 1996 1995 1994 1993 1992<br />
All vehicles 747 827 633 751 853 332<br />
Sedan, jeep, wagon,<br />
pickup, and van 682 727 559 627 654 235<br />
Heavy equipment 28 35 21 58 44 50<br />
Moped and motorcycle 31 65 42 64 146 44<br />
Bus 6 0 11 2 9 3<br />
Source: Office of the Resident Director, Tinian<br />
Table 10 .3 Type a nd Number of Vehicles in Rota : 1992 - 1 996<br />
Year<br />
Type of Vehicle 1996 1995 1994 1993 1992<br />
All vehicles 1,228 1,069 1,051 1,031 999<br />
Sedan and wagon 526 472 411 399 384<br />
Pickup including 4x4 527 428 479 480 452<br />
Moped, scooter 12 6 3 4 6<br />
Buses 11 8 3 4 3<br />
Heavy equipment 32 41 52 44 46<br />
Passenger van 38 26 21 21 28<br />
Flatbed truck 14 13 14 1 8<br />
Jeep 65 65 66 73 66<br />
Motorcycle 3 4 1 3 3<br />
Others 0 6 1 2 3<br />
Source: Bureau of Motor Vehicles, Rota<br />
Central Statistics Division, Department of Commerce
Page 104 <strong>1998</strong> CNMI <strong>Statistical</strong> <strong>Yearbook</strong>, Chapter 10<br />
Table 10.4 Motor Vehicle Reg istra tion, Renewa ls: Saipan, 1992 to 1997<br />
Types of Vehicles 1997 1996 1995 1994 1993 1992<br />
Total 13,464 15,424 11,489 14,132 13,831 14,402<br />
Sedans, Jeeps, Station wagons 8848 9538 7246 8623 8,703 8,887<br />
Vans and Minibuses 385 567 397 584 538 517<br />
Commercial buses 99 334 123 165 121 115<br />
Trucks 4,103 4,920 3,700 4,706 4,408 4,818<br />
Light pickups and trucks 4004 4125 3126 3995 3,739 4,108<br />
Heavy equipment 66 795 574 711 653 696<br />
Combination 33 0 0 0 16 14<br />
Mopeds and motorcycles 29 65 23 54 61 65<br />
Up to 100 cc 18 23 5 25 15 12<br />
Over 100 cc 11 42 18 29 46 53<br />
Source: Bureau of Motor Vehicles<br />
Year<br />
Cars per Family<br />
There were about the same number<br />
of vehicles per family in 1990 and<br />
1995.<br />
Table 10.5 Vehicles Available by Island: 1995<br />
Island<br />
'Vehicles Number Percent<br />
Available Total Saipan Rota Tinian N. Is. Total Saipan Rota Tinian N. Is.<br />
Total 12,057 10,844 690 522 1 100.0 100.0 100.0 100.0 100.0<br />
None 1,264 1,136 92 35 1 10.5 10.5 13.3 6.7 100.0<br />
1 6,985 6,296 360 329 ... 57.9 58.1 52.2 63.0 0.0<br />
2 2,776 2,486 170 120 ... 23.0 22.9 24.6 23.0 0.0<br />
3 or more 1,032 926 68 38 ... 8.6 8.5 9.9 7.3 0.0<br />
Vehicles per hshld 1.3 1.3 1.4 1.4 ... ... ... ... ... ...<br />
Source: 1995 CNMI Mid-Decade Census Table 152<br />
Table 10.6 Vehicles Ava ila ble by Isla nd: 1990<br />
Island<br />
Numbers<br />
Percent<br />
Vehicles Available Total Saipan Rota Tinian N. Is. Total Saipan Rota Tinian N. Is.<br />
Total 6,877 6,086 417 367 6 100.0 100.0 100.0 100.0 100.0<br />
None 1,026 870 69 81 6 14.9 14.3 16.5 22.1 100.0<br />
1 3,521 3,116 213 192 ... 51.2 51.2 51.0 52.3 0.0<br />
2 1,641 1,492 93 56 ... 23.9 24.5 22.3 15.3 0.0<br />
3 or more 685 607 41 37 ... 10.0 10.0 9.8 10.1 0.0<br />
Vehicles per hsehld 1.3 1.3 1.3 1.2 ... ... ... ... ... ...<br />
Source: 1990 CPH-6-CNMI Table 104<br />
Central Statistics Division, Department of Commerce
<strong>1998</strong> CNMI <strong>Statistical</strong> <strong>Yearbook</strong>, Chapter 10 Page 105<br />
Table 10 .7 Registered and Inspected Gover nm ent Vehicles by Type,<br />
1984 to 1 998<br />
Motor-<br />
Trucks Station-<br />
YEAR Total cycle Sedan Jeep Pickup & H.E. wagon Van Bus<br />
<strong>1998</strong> 188 0 53 8 66 9 46 0 6<br />
1997 287 0 141 39 37 0 37 19 14<br />
1996 169 0 75 21 31 12 25 2 3<br />
1995 322 0 116 42 88 21 43 6 6<br />
1994 523 2 156 19 199 25 59 30 33<br />
1993 573 6 184 17 181 45 64 38 38<br />
1992 590 3 212 22 202 46 41 41 23<br />
1991 597 8 184 41 208 59 43 30 24<br />
1990 187 0 69 8 61 36 6 7 0<br />
1989* 104 4 27 24 25 11 8 5 0<br />
1988 348 3 106 19 142 16 27 18 17<br />
1987 31 0 8 2 15 3 1 2 0<br />
1986 30 3 15 0 6 0 4 1 1<br />
1985 17 0 7 1 6 0 1 2 0<br />
1984 28 0 6 1 7 0 1 0 13<br />
Source: Division of Procurement & Supply<br />
Note: "*" Figure is as of 1st quarter of 1989. From 1995 to present, Department of Public Safety has<br />
assumed Government vehicle registration.<br />
Government Registered Vehicles<br />
Although the reported number may contain<br />
some inaccuracies, the number of government<br />
vehicles increased dramatically from 1990 to<br />
1991. Since then, the number of government<br />
vehicles decllined, with the exception of 1997,<br />
in which 287 vehicles were registered.<br />
Table 10.8 Vessel Inventory for Sa ipa n: 1992 to 1997<br />
Year<br />
Type of Vessel 1997 1996 1995 1994 1993 1992<br />
Total 777 732 679 596 534 497<br />
Subsistance/Recreational fishing 300 342 301 272 213 227<br />
Part-time commercial fishing 124 62 69 59 54 138<br />
Number of Sea Vessels<br />
The number of sea vessels in Saipan increased<br />
annually since 1992. Most of the increase was<br />
in the number of vessels for subsistence and/or<br />
recreational fishing and in the number of nonfishing<br />
boats. Also increasing is in the full-time<br />
commercial fishing.<br />
Full-time commercial fishing 112 101 90 84 79 64<br />
Charter fishing 44 30 33 31 26 39<br />
Non-fishing boat 181 191 180 144 162 29<br />
Unspecified 16 6 6 6 0 0<br />
Source: Fish and Wildlife Division<br />
Ta ble 1 0.9 Number of Taxica b Vehicles Register ed<br />
a nd Not Reg istered: 1992 to 1997<br />
Figure 10.1 Number of Registered<br />
Taxicabs: 1992 to 1997<br />
600<br />
500<br />
Total<br />
Registered<br />
Not<br />
Year Total Registered Registered<br />
1997 530 332 198<br />
1996 520 520 0<br />
1995 239 239 0<br />
1994 49 32 17<br />
1993 95 68 27<br />
1992 124 104 20<br />
Source: Bureau of Taxicabs, Department of Commerce<br />
400<br />
300<br />
200<br />
100<br />
0<br />
1992 1993 1994 1995 1996 1997<br />
Central Statistics Division, Department of Commerce
Page 106 <strong>1998</strong> CNMI <strong>Statistical</strong> <strong>Yearbook</strong>, Chapter 10<br />
Number of Installed Telephones<br />
Since 1982, the number of installed<br />
telephones increased annually. Both<br />
residential and business telephones<br />
increased. The number of residential phones<br />
has been more than business phones.<br />
Figure 10.2 Number of Installed Telephones:<br />
1988 to <strong>1998</strong><br />
Number of phones<br />
Thousands<br />
12<br />
10<br />
8<br />
6<br />
4<br />
2<br />
0<br />
Residential<br />
Business<br />
88 89 90 91 92 93 94 95 96 97 98<br />
Year<br />
Table 10 .10 Num ber of Insta lled Telephones by<br />
Type of Subscriber s: 1982 to <strong>1998</strong><br />
Residential<br />
Business<br />
Year Total Subscribers Subscribers<br />
<strong>1998</strong> 19,610 10,393 9,217<br />
1997 16,306 10,242 6,064<br />
1996 14,567 9,052 5,515<br />
1995 15,460 8,038 7,422<br />
1994 14,358 7,356 7,002<br />
1993 13,618 6,919 6,699<br />
1992 12,971 6,999 5,972<br />
1991 12,240 6,761 5,479<br />
1990 9,773 5,264 4,509<br />
1989 7,232 3,826 3,406<br />
1988 5,634 3,334 2,300<br />
1987 5,022 2,819 2,203<br />
1986 4,576 2,870 1,706<br />
1985 2,389 1,264 1,125<br />
1984 2,245 1,214 1,031<br />
1983 1,829 1,012 817<br />
1982 1,603 879 724<br />
Source: Micronesian Telecommunications Corporation<br />
Table: 10 .11 CNMI Registered Motor Vehicles: 1989-1997<br />
Island<br />
Year Total New Dealer Import Renewal Trans<br />
1997 16,096 2,632 1,757 875 13,464 3,678<br />
1996 17,485 2,061 1,415 646 15,424 3,178<br />
1995 15,398 1,879 1,314 565 13,519 ...<br />
1994 17,327 1,772 1,288 484 15,555 3,792<br />
1993 16,043 1,662 1,290 372 14,381 3,354<br />
1992 16,566 2,180 1,707 473 14,386 1,744<br />
1991 15,014 3,300 2,798 502 11,714 1,823<br />
1990 13,239 3,572 2,918 654 9,667 1,549<br />
1989 11,357 2,899 2,344 555 8,458 829<br />
Source: Division of Highway Safety, Department of Public Safety<br />
Central Statistics Division, Department of Commerce
Chapter 11<br />
FINANCE<br />
BUSINESS ESTABLISHMENTS<br />
AND TRADE
Page 108 <strong>1998</strong> CNMI <strong>Statistical</strong> <strong>Yearbook</strong>, Chapter 11<br />
Summary of Finance, Business Establishments and Trade<br />
Total bank deposits increased annually from 1993 to <strong>1998</strong>.<br />
According to the 1992 Economic Census, there were 73 manufacturing<br />
business establishments, including 16 garment manufactures;<br />
616 retail trade establishments; 414 business establishments<br />
in the service industries, including 38 hotels; 103 construction<br />
and supplies establishments and 60 wholesale trade establishments<br />
in the Commonwealth in 1992. A total of 20,105 employees<br />
worked in these establishments in selected industries that year: 28<br />
percent of these employees were in the service industry, 23 percent<br />
were in retail trade, 31 percent were in manufacturing, and 15 percent<br />
were in construction and supplies industry.<br />
From 1992 to 1997, imported commodities in nominal US dollars,<br />
increased annually. Food stuff value fluctuated from 1992 to<br />
1997. The clothing and beverages value also fluctuated during this<br />
period. The value of imported passenger vehicles dropped from<br />
1992 to 1993, increased from 1993 to 1995, decreased again in 1996<br />
and eventually reached a high in 1997.<br />
Inbound ocean cargo into the CNMI, in revenue tons, increased<br />
annually from FY 1980 to FY 1991. It declined in 1992, and increased<br />
again in 1993 through 1996. FY 1997 witnessed a dramatic decrease.<br />
Outbound ocean cargo fluctuated from year to year from 1980 to<br />
1989, increased in 1990 through 1993, and declined in 1994, but<br />
rose again in 1995 through 1997.<br />
The total value of commodities imported into the commonwealth<br />
increased from 1991 through 1997.<br />
Central Statistics Division, Department of Commerce
<strong>1998</strong> CNMI <strong>Statistical</strong> <strong>Yearbook</strong>, Chapter 11 Page 109<br />
Table 11.1 Ag gr eg ated Banking Activities: 1 993 to <strong>1998</strong><br />
(Va lues in $ m illion)<br />
Calendar Years<br />
Banking Activity <strong>1998</strong> 1997 1996 1995 1994 1993<br />
Deposits 522.8 481.1 463.0 425.2 411.2 386.1<br />
Demand 133.6 140.8 136.7 134.3 121.7 107.3<br />
Savings 192.5 163.2 163.2 150.7 165.5 193.9<br />
TCDs 196.7 177.0 163.1 140.2 124.0 84.9<br />
Loans 304.7 239.4 280.2 216.3 200.3 186.7<br />
Consumer 83.6 71.9 71.3 64.7 64.9 63.9<br />
Commercial 165.3 134.5 173.5 133.3 120.0 110.3<br />
Real Estate Home Impr. 54.7 31.7 34.0 16.5 13.0 9.8<br />
Non-local 0.0 0.0 0.0 0.0 0.0 0.0<br />
Government 1.1 1.3 1.4 1.9 2.3 2.7<br />
Interest paid 37.6 39.6 35.1 33.0 24.0 26.1<br />
All deposit accounts 14.3 14.9 12.7 12.1 8.1 10.3<br />
By borrowers 23.4 24.8 22.3 20.9 15.9 15.8<br />
Commonwealth dev. authority 8.3 7.0 4.3 6.5 4.0 3.5<br />
Direct loans 2.2 0.5 1.0 4.1 3.7 2.5<br />
Guarantee loans 6.0 6.5 3.3 2.4 0.3 1.0<br />
Source: Department of Commerce, Commonwealth Development Authority<br />
Figure 11.1 Banking Acitivities: Bank<br />
Deposits, Loans and Interest<br />
paid, 1990 to <strong>1998</strong><br />
US $ million<br />
600<br />
Deposits Loans Interest paid<br />
500<br />
400<br />
300<br />
200<br />
100<br />
0<br />
'90 '91 '92 '93 '94 '95 '96 '97 '98<br />
Year<br />
Table 11.2<br />
Num ber of Business Establishm ents and Num ber of Employees<br />
in Selected Industries in the CNMI: 1987 a nd 1 992<br />
Establishment Percent Employees Percent<br />
Industry 1992 1987 change 1992 1987 change<br />
Total 1,266 768 64.8 20,105 9,090 121.2<br />
Figure 11.2 Number of Business<br />
Establishments in Selected<br />
Industry; 1987 and 1992<br />
700<br />
600<br />
500<br />
Manufacturing 73 39 87.2 6,267 2,257 177.7<br />
Garment 16 16 0.0 4,926 2,045 140.9<br />
Wholesale trade 60 28 114.3 534 187 185.6<br />
Retail trade 616 383 60.8 4,715 2,304 104.6<br />
Restaurant 111 70 58.6 1,026 396 159.1<br />
Night clubs and bars 56 35 60.0 485 307 58.0<br />
Construction and supplies 103 72 43.1 3,036 2,061 47.3<br />
Service industries 414 246 68.3 5,553 2,281 143.4<br />
Hotel 38 17 123.5 2,409 904 166.5<br />
Professional services 25 28 -10.7 124 72 72.2<br />
Source: 1987 and 1992 Economic Census<br />
400<br />
300<br />
200<br />
100<br />
0<br />
Mfg Wholesale Retail Const. Services<br />
1987<br />
1992<br />
Central Statistics Division, Department of Commerce
Page 110 <strong>1998</strong> CNMI <strong>Statistical</strong> <strong>Yearbook</strong>, Chapter 11<br />
Table 11 .3 Gener al Statistics: 1997, 1992 , a nd 1987<br />
Sales and Annual 1st quarter Number of<br />
Industry Division Number of receipts Payroll Payroll paid<br />
and Year establishment ($1,000) ($1,000) ($1,000) employees<br />
Total<br />
1997 1,232 2,082,740 323,069 75,159 28,906<br />
1992 1,266 1,132,039 161,184 37,551 20,105<br />
1987 768 373,946 57,311 12,495 9,090<br />
Construction<br />
1997 85 87,942 21,471 4,531 2,302<br />
1992 103 87,602 17,712 4,739 3,036<br />
1987 72 43,488 11,572 1,745 2,061<br />
Manufacturing<br />
1997 84 762,080 146,583 32,078 13,715<br />
1992 73 264,467 48,652 9,572 6,267<br />
1987 39 58,138 14,495 3,217 2,257<br />
Wholesale trade<br />
1997 57 222,655 9,417 2,175 745<br />
1992 60 132,095 5,877 1,290 534<br />
1987 28 49,746 1,598 361 187<br />
Retail trade<br />
1997 519 570,266 54,186 13,656 4,811<br />
1992 616 384,354 37,969 9,035 4,715<br />
1987 383 155,378 14,138 3,519 2,304<br />
Service industries<br />
1997 457 439,797 91,412 22,719 7,333<br />
1992 414 263,521 50,974 12,915 5,553<br />
1987 246 67,196 15,508 3,653 2,281<br />
Source: 1997, 1992, 1987 Economic Censuses<br />
Figure 11.3 Major Import Commodities by<br />
F.O.B. Value: FY1997<br />
Table 11.4 Va lue of Ma jor Comm odities Im ported: FY1992 to FY1997<br />
(In U.S. million $ dolla rs)<br />
Food stuff<br />
Petroleum prod.<br />
Clothing<br />
Vehicles (incl. parts)<br />
Const. Mat.<br />
Beverages<br />
Tobacco Products<br />
All Other<br />
Commodity 1997 1996 1995 1994 1993 1992<br />
Total 836.2 551.2 528.0 513.7 513.0 493.9<br />
Petroleum products 68.5 65.3 70.4 55.1 50.8 39.2<br />
Const. Materials (inc. fixtures) 35.1 16.8 17.2 23.3 21.3 28.8<br />
Food stuff 80.1 39.5 44.7 44.3 31.0 43.8<br />
Vehicles (incl. parts) 42.1 34.2 35.6 30.7 24.8 32.4<br />
Beverages ( other than dairy & juices) 12.8 15.1 20.4 16.0 15.1 15.9<br />
Tobacco Products 5.4 4.9 5.5 6.7 7.2 9.9<br />
Clothing 59.0 27.1 18.5 28.9 26.9 28.1<br />
All Other 533.2 348.1 315.8 308.7 335.9 295.8<br />
Source: Division of Customs Service, Department of Finance<br />
0 100 200 300 400 500 600<br />
F.O.B. Value<br />
Central Statistics Division, Department of Commerce
<strong>1998</strong> CNMI <strong>Statistical</strong> <strong>Yearbook</strong>, Chapter 11 Page 111<br />
Table 11 .5 Inbound a nd Outbound Ocea n Ca rg o Saipan Sea port:<br />
FY1980 to FY1997<br />
Figure 11.4 Inbound and Outbound Ocean<br />
Cargo of Saipan Port : 1987 to<br />
1997<br />
Inbound Ocean Cargo Outbound Ocean Cargo<br />
Revenue Percent Revenue Percent<br />
Fiscal Year Tons Change Tons Change<br />
1997 462,029 -33.3 138,985 17.9<br />
1996 692,268 10.8 117,863 27.6<br />
800<br />
700<br />
600<br />
Outbound<br />
Inbound<br />
1995 624,653 7.2 92,385 4.2<br />
1994 582,438 29.9 88,655 -25.1<br />
1993 448,352 11.9 118,442 13.4<br />
1992 400,577 -35.0 104,413 13.5<br />
1991 616,147 55.0 91,966 64.4<br />
1990 397,560 34.9 55,947 104.2<br />
1989 294,774 12.9 27,402 -11.8<br />
Revenue Tonnage<br />
Thousands<br />
500<br />
400<br />
300<br />
200<br />
1988 261,195 24.2 31,060 -6.5<br />
1987 210,321 20.8 33,214 -35.7<br />
1986 174,077 31.5 51,691 99.5<br />
1985 132,358 24.7 25,907 -10.0<br />
1984 106,129 52.6 28,788 65.5<br />
1983 69,566 14.7 17,391 14.7<br />
1982 60,647 -3.0 15,162 -3.0<br />
1981 62,491 0.8 15,623 0.9<br />
100<br />
0<br />
'87<br />
'88<br />
'89<br />
'90<br />
'91<br />
'92<br />
'93<br />
'94<br />
'95<br />
'96<br />
'97<br />
1980 61,967 ... 15,491 ...<br />
Source: Commonwealth Ports Authority Records<br />
Table 11 .6 Gross Revenue Tons and Conta iner Tr ends,<br />
Saipan' s P ort : FY 1979 to FY 1997<br />
Figure 11.5 Gross Revenue Tonnage at<br />
Saipan Port : 1987 to 1997<br />
800<br />
Gross Revenue Tons<br />
Containers<br />
Year Amount % Growth Number % Growth<br />
1997 601,014 18.7 17,687 11.7<br />
1996 506,140 3.1 15,839 5.0<br />
1995 491,127 -26.8 15,086 6.7<br />
1994 671,093 19.1 14,136 9.5<br />
1993 563,494 13.8 12,908 -6.0<br />
1992 495,018 -29.6 13,738 92.5<br />
1991 703,604 55.1 7,137 -23.3<br />
1990 453,507 40.8 9,307 2.9<br />
1989 322,175 10.2 9,042 -18.9<br />
1988 292,255 20.0 11,151 30.6<br />
1987 243,536 4.0 8,536 54.8<br />
1986 234,266 48.0 5,515 27.8<br />
1985 158,266 17.3 4,317 14.0<br />
1984 134,918 55.2 3,788 22.3<br />
1983 86,957 14.7 3,097 21.7<br />
1982 75,809 -3.0 2,545 -2.9<br />
1981 78,114 0.8 2,622 16.2<br />
1980 77,458 -2.1 2,257 -7.2<br />
1979 79,120 ... 2,432 ...<br />
Source : Commonwealth Ports Authority<br />
Thousands<br />
700<br />
600<br />
500<br />
400<br />
300<br />
200<br />
1987 '89 '91 '93 '95 1997<br />
'88 '90 '92 '94 '96<br />
Central Statistics Division, Department of Commerce
Page 112 <strong>1998</strong> CNMI <strong>Statistical</strong> <strong>Yearbook</strong>, Chapter 11<br />
Figure 11.6 Container Trend at Saipan Port :<br />
1987 to 1997<br />
Table11.7 Orig in a nd F.O.B. Va lue of Im por t Comm odities, CNMI<br />
Fisca l Yea rs 1991 to 1 997<br />
(in US million $ dollars)<br />
18<br />
Thousands<br />
15<br />
12<br />
9<br />
6<br />
3<br />
0<br />
1987 '89 '91 '93 '95 1997<br />
'88 '90 '92 '94 '96<br />
Commodity 1997 1996 1995 1994 1993 1992 1991<br />
Total 836.2 551.2 528.0 513.7 513.0 493.9 392.2<br />
United States 63.3 198.9 198.17 223.1 223.5 301.2 71.6<br />
Guam 298.0 53.1 39.36 37.2 36.9 39.7 158.5<br />
Japan 118.3 39.1 50.51 47.4 48.7 46.1 65.0<br />
Philppines 2.8 5.3 4.64 5.1 5.2 15.3 11.7<br />
Hong Kong 200.5 121.0 99.50 86.3 70.7 34.4 28.8<br />
Korea 80.6 60.1 64.90 49.9 68.8 27.6 0.0<br />
Other Areas 72.7 73.7 70.97 64.7 59.2 29.6 56.6<br />
Source: Department of Finance<br />
Table 11.8 Gener al Statistics by Industr y a nd SeIected Kind of Business: 1997<br />
Number Sales and Annual 1st quarter Number of<br />
of establish- receipts payroll payroll paid<br />
Industry and kind of business ments ($1,000) ($1,000) ($1,000) employees<br />
Total 1,232 2,082,740 323,069 75,159 28,906<br />
Construction 85 87,942 21,471 4,531 2,302<br />
General building contractor 52 42,829 10,032 2,111 1,172<br />
Manufacturing 84 762,080 146,583 32,078 13,715<br />
Food & kindred products 6 5,505 5,505 323 133<br />
Apparel & other textile products 39 699,631 D 28,985 12,457<br />
Wholesale trade 87 222,655 9,417 2,175 745<br />
Durable goods 26 50,451 3,152 772 227<br />
Non durable goods 61 172,204 6,265 1,403 518<br />
Retail trade 519 570,266 54,186 13,656 4,811<br />
Building materials and garden supplies 21 36,938 3,843 1,029 324<br />
Food stores 73 44,859 3,976 875 419<br />
Gasoline service stations 24 D D D c<br />
Eating and drinking places 129 55,440 12,369 3,121 1,459<br />
Service industries 457 439,797 91,412 22,719 7,333<br />
Tour operators 30 34,999 9,849 2,385 525<br />
Hotels and motels 33 195,159 34,446 8,887 2,912<br />
Personal services 38 8,867 2,291 537 249<br />
Amusement and recreation 88 91,028 14,904 3,693 1,178<br />
Source: 1997 Economic Census<br />
Note: Withheld data of individual companies; data are included in totals. "c" means 100 to 249 employees.<br />
Central Statistics Division, Department of Commerce
<strong>1998</strong> CNMI <strong>Statistical</strong> <strong>Yearbook</strong>, Chapter 11 Page 113<br />
Table 11.9 Num ber of Businesses by Leg al Form of Business: 1 997<br />
Individual<br />
Industry Total Corporations proprietorship Partnerships Others<br />
Total 1,233 1,046 160 17 10<br />
Construction 86 75 11 0 0<br />
Manufacturing 84 79 4 1 0<br />
Wholesale trade 87 81 5 0 1<br />
Retail trade 519 448 63 4 4<br />
Service industries 457 363 77 12 5<br />
Source: 1997 Economic Census<br />
Table 1 1.1 0 : General Statistics by Industry Group a nd Island: 19 97<br />
Paid<br />
employees<br />
First for pay period<br />
Unpaid<br />
Industry division Sales and Annual quarter including Proprietors family<br />
and island Establishments receipts payroll payroll Mar. 12 and partners workers<br />
(number) ($1,000) ($1,000) ($1,000) (number) (number) (number)<br />
To ta l 1 ,2 3 2 2 ,0 8 2 ,740 323 ,0 6 9 75,1 5 9 2 8 ,9 0 6 2 1 3 2 6<br />
Construction 85 87,942 21,471 4,531 2,302 13 0<br />
Manufacturing 84 762,080 146,583 32,078 13,715 5 0<br />
Wholesale trade 87 222,655 9,417 2,175 745 7 0<br />
Retail trade 519 570,266 54,186 13,656 4,811 78 14<br />
Service industries 457 439,797 91,412 22,719 7,333 110 12<br />
Sa i pa n 1 ,1 6 6 2 ,0 3 8 ,911 314 ,5 7 1 73,4 7 0 2 8 ,0 6 8 1 8 8 1 9<br />
Construction 80 D D D g D D<br />
Manufacturing 81 758,285 146,231 32,006 13,686 5 0<br />
Wholesale trade 83 D D D f D D<br />
Retail trade 489 557,146 52,705 13,277 4,580 60 10<br />
Service industries 433 430,262 87,954 21,835 6,989 103 9<br />
Ti ni a n 3 0 1 8 ,752 3 ,6 5 8 4 5 8 2 9 9 5 1<br />
Construction 3 D D D c D D<br />
Manufacturing 2 D D D a D D<br />
Wholesale trade 2 D D D a D D<br />
Retail trade 12 4,749 640 155 88 4 1<br />
Service industries 11 1,011 366 107 39 1 0<br />
Ro ta 3 6 2 5 ,077 4 ,8 4 0 1 ,2 3 1 5 3 9 2 0 6<br />
Construction 2 D D D b D D<br />
Manufacturing 1 D D D a D D<br />
Wholesale trade 2 D D D a D D<br />
Retail trade 18 8,371 841 224 143 14 3<br />
Service industries 13 8,524 3,092 777 305 6 3<br />
Source: 1997 Economic Census<br />
Central Statistics Division, Department of Commerce
Page 114 <strong>1998</strong> CNMI <strong>Statistical</strong> <strong>Yearbook</strong>, Chapter 11<br />
Ta ble 11 .11 Num ber of Esta blishm ents by Business Gross Receipts<br />
a nd Industry : 19 97<br />
Cons- Manu- Wholesale Retail Service<br />
Sales and receipts size Total truction facturing trade trade industries<br />
Total 1,232 85 84 87 519 457<br />
Less than $5,000 9 3 0 0 1 5<br />
$5,000 to $9,999 12 1 0 0 4 7<br />
$10,000 to $24.999 61 3 1 1 30 26<br />
$25,000 to $49,999 83 3 3 2 33 42<br />
$50,000 to $99,999 144 7 5 7 65 60<br />
$100,000 to $249,999 314 25 16 13 137 123<br />
$250,000 to $499,999 187 15 9 12 76 75<br />
$500,000 to $999,999 162 7 11 17 75 52<br />
$1,000,000 or more 260 21 39 35 98 67<br />
Source: 1997 Economic Census<br />
Ta ble 11.12 : Distr ibution of Esta blishm ents by Citiz enship Sta tus of Owner<br />
for Industr y Group a nd Isla nd: 1992<br />
Citizenship status of owner of establishment*<br />
Industry division<br />
Total United States United States<br />
and Islands establishments CNMI born Other Japan Philippines Korea Other<br />
(number) (number) (number) (number) (number) (number) (number)<br />
Tota l CNMI 1 ,266 440 298 124 6 1 226 106<br />
Construction 103 42 26 2 9 20 2<br />
Manufacturing 73 26 18 3 2 15 9<br />
Wholesale trade 60 18 21 5 3 7 3<br />
Retail trade 616 190 135 65 32 116 73<br />
Service industries 414 164 98 49 15 68 19<br />
Saipan 1 ,047 277 264 119 5 6 216 104<br />
Construction 73 21 20 2 8 18 2<br />
Manufacturing 62 16 18 2 2 15 9<br />
Wholesale trade 49 9 19 5 3 7 3<br />
Retail trade 530 129 121 63 30 111 71<br />
Service industries 333 102 86 47 13 65 19<br />
Tinia n 9 4 6 1 1 7 1 5 1 0 0<br />
Construction 7 3 1 0 1 2 0<br />
Manufacturing 4 4 0 0 0 0 0<br />
Wholesale trade 7 6 1 0 0 0 0<br />
Retail trade 40 25 8 0 2 5 0<br />
Service industries 36 23 7 1 2 3 0<br />
Rota 125 102 1 7 4 0 0 2<br />
Construction 23 18 5 0 0 0 0<br />
Manufacturing 7 6 0 1 0 0 0<br />
Wholesale trade 4 3 1 0 0 0 0<br />
Retail trade 46 36 6 2 0 0 2<br />
Service industries 45 39 5 1 0 0 0<br />
Source: 1992 Economic Census<br />
* Establishment counts by citizenship status do not equal total establishments.<br />
The difference represent establishments that did not report citizenship.<br />
Central Statistics Division, Department of Commerce
<strong>1998</strong> CNMI <strong>Statistical</strong> <strong>Yearbook</strong>, Chapter 11 Page 115<br />
Table 11 .13 Business Industry Div isions by Business Gross Receipts:<br />
(In US $1,000 dolla r s), 1992<br />
Cons- Manu- Wholesale Retail Service<br />
Sales and receipts size Total truction facturing trade trade industries<br />
Total 1,132,039 87,602 264,467 132,095 384,354 263,521<br />
Less than $5,000 97 (D) (D) (D) 38 47<br />
$5,000 to $9,999 356 (D) 0 (D) 176 123<br />
$10,000 to $24.999 2,019 132 (D) (D) 848 972<br />
$25,000 to $49,999 5,921 294 198 108 3,106 2,215<br />
$50,000 to $99,999 13,258 1,024 546 350 6,795 4,543<br />
$100,000 to $249,999 39,084 3,631 2,144 587 20,087 12,365<br />
$250,000 to $499,999 53,498 5,643 2,370 3,469 26,323 15,693<br />
$500,000 to $999,999 81,902 8,397 5,795 4,852 43,524 19,334<br />
$1,000,000 or more 935,904 68,432 253,384 122,402 283,457 208,229<br />
Source: 1992 Economic Census<br />
Note: (D) means withheld to avoid disclosing figures for individual establishments. Data included in totals.<br />
Table 11.14 Num ber of Business Activities issued in the CNMI: 1 994 to <strong>1998</strong><br />
Year<br />
Acitivity <strong>1998</strong> 1997 1996 1995 1994<br />
Total 7,449 9,751 8,507 9,749 14,633<br />
Agriculture, forestry, and fishing 128 122 117 125 254<br />
Mining 7 9 0 7 2<br />
Construction 405 607 440 520 797<br />
Manufacturing 201 325 198 178 195<br />
Transportation, communication,<br />
electric, and sanitary services 504 688 551 669 764<br />
Wholesale trade 312 628 307 352 338<br />
Retail trade 2,447 2,598 2,287 2,613 3,663<br />
Finance, insurance, and real estate 1,064 1,316 1,182 1,451 1,729<br />
Services 2,378 3,455 2,653 2,808 4,242<br />
Public Administration 3 3 3 0 11<br />
Nonclassifiable establishments 0 0 769 1,026 2,638<br />
Source: Business License Section, Department of Commerce<br />
Note: 1996 data 1/96 thru 6/96.<br />
Central Statistics Division, Department of Commerce
Page 116 <strong>1998</strong> CNMI <strong>Statistical</strong> <strong>Yearbook</strong>, Chapter 11<br />
Ta bl e 1 1 .1 5 : Genera l Sta ti sti c s by Empl oy ment: 1 9 9 2<br />
Paid<br />
employees<br />
First for pay period<br />
Unpaid<br />
Industry division Establish- Sales and Annual quarter including Proprietors family<br />
and employment ment receipts payroll payroll Mar. 12 and partners workers<br />
(number) ($1,000) ($1,000) ($1,000) (number) (number) (number)<br />
To ta l 1 ,2 6 6 1 ,1 3 2 ,0 3 9 1 6 1 ,1 8 4 3 7 ,5 5 1 2 0 ,1 0 5 6 1 8 2 6 8<br />
With no paid employees 70 2,248 0 0 0 65 69<br />
With paid employees 1,196 1,129,791 161,184 37,551 20,105 553 199<br />
No employees 121 11,588 1,104 0 0 71 28<br />
1 to 4 employees 511 60,441 7,898 2,024 1,131 273 115<br />
5 to 9 employees 221 132,142 11,923 2,903 1,458 103 29<br />
10 to 19 employees 146 106,565 15,088 3,499 1,922 59 18<br />
20 to 49 employees 129 281,906 31,963 7,928 3,923 39 8<br />
50 employees or more 68 537,149 93,208 21,197 11,671 8 1<br />
Construc ti on 1 0 3 8 7 ,6 0 2 1 7 ,7 1 2 4 ,7 3 9 3 ,0 3 6 5 7 2 0<br />
With no paid employees 0 0 0 0 0 0 0<br />
With paid employees 103 87,602 17,712 4,739 3,036 57 20<br />
No employees 2 (D) (D) (D) (D) (D) (D)<br />
1 to 4 employees 31 (D) (D) (D) (D) (D) (D)<br />
5 to 9 employees 17 2,816 765 162 122 11 6<br />
10 to 19 employees 16 9,548 1,205 321 213 9 3<br />
20 to 49 employees 25 32,266 5,137 1,415 804 12 2<br />
50 employees or more 12 (D) (D) (D) (D) (D) (D)<br />
Ma nufac turi ng 7 3 2 6 4 ,4 6 7 4 8 ,6 5 2 9 ,5 7 2 6 ,2 6 7 2 2 4<br />
With no paid employees 0 0 0 0 0<br />
With paid employees 73 264,467 48,652 9,572 6,267 22 4<br />
No employees 1 (D) (D) (D) (D) (D) (D)<br />
1 to 4 employees 21 (D) (D) (D) (D) (D) (D)<br />
5 to 9 employees 8 2,128 507 120 60 5 0<br />
10 to 19 employees 14 11,285 1,467 392 198 6 0<br />
20 to 49 employees 8 7,688 1,720 374 267 0 0<br />
50 employees or more 21 241,380 44,614 8,595 5,683 2 3<br />
Who l esa l e trade 6 0 1 3 2 ,0 9 5 5 ,8 7 7 1 ,2 9 0 5 3 4 8 3<br />
With no paid employees 0 0 0 0 0 0 0<br />
With paid employees 60 132,095 5,877 1,290 534 8 3<br />
No employees 7 295 30 0 0 1 0<br />
1 to 4 employees 25 (D) (D) (D) (D) (D) (D)<br />
5 to 9 employees 12 60,049 1,109 248 77 0 0<br />
10 to 19 employees 8 17,633 1,078 254 98 1 0<br />
20 to 49 employees 6 30,096 1,804 421 183 0 0<br />
50 employees or more 2 (D) (D) (D) (D) (D) (D)<br />
Reta i l trade 6 1 6 3 8 4 ,3 5 4 3 7 ,9 6 9 9 ,0 3 5 4 ,7 1 5 3 0 0 1 5 7<br />
With no paid employees 40 1,756 0 0 0 34 38<br />
With paid employees 576 382,598 37,969 9,035 4,715 266 119<br />
No employees 77 4,219 763 0 0 44 19<br />
1 to 4 employees 255 32,997 3,480 866 551 134 70<br />
5 to 9 employees 110 42,487 4,734 1,205 722 53 17<br />
10 to 19 employees 65 37,327 5,335 1,214 853 23 11<br />
20 to 49 employees 58 179,356 15,685 3,846 1,708 12 2<br />
50 employees or more 11 86,212 7,972 1,904 881 0 0<br />
Servi c e i ndustri es 4 1 4 2 6 3 ,5 2 1 5 0 ,9 7 4 1 2 ,9 1 5 5 ,5 5 3 2 3 1 8 4<br />
With no paid employees 30 492 0 0 0 31 31<br />
With paid employees 384 263,029 50,974 12,915 5,553 200 53<br />
No employees 34 (D) (D) (D) (D) (D) (D)<br />
1 to 4 employees 179 (D) (D) (D) (D) (D) (D)<br />
5 to 9 employees 74 24,662 4,808 1,168 477 34 6<br />
10 to 19 employees 43 30,772 6,003 1,318 560 20 4<br />
20 to 49 employees 32 32,500 7,617 1,872 961 15 4<br />
50 employees or more 22 159,334 29,266 7,802 3,166 3 0<br />
Source: 1992 Economic Census<br />
Note :(D) means data withheld to avoid disclosing figures for individual establishments. Data are included in higher level totals.<br />
Central Statistics Division, Department of Commerce
Chapter 12<br />
FISHING<br />
AND<br />
AGRICULTURE
Page 118 <strong>1998</strong> CNMI <strong>Statistical</strong> <strong>Yearbook</strong>, Chapter 12<br />
Summary of Fishing and Agriculture<br />
In calendar year 1997, 380,135 pounds of fish were caught and<br />
sold in the CNMI. Reef fishes were the largest common species<br />
that landed in 1997, followed by the skipjack tuna and mahi-mahi<br />
(dolphin).<br />
Although, the CNMI is a net importer of fish: there has been a<br />
dramatic decrease in total imports between the years of 1992 to<br />
1997. Despite this, imports still comprise for more than half of total<br />
fish sold in the CNMI each year. In 1996 and 1997, Palau by far,<br />
was the largest single source of fish imports into the CNMI. During<br />
the same period, Guam came in second in total fish products imports.<br />
In 1990, there were 346 farms in the CNMI; the average size of a<br />
farm was 48 acres. The approximate land area was 117,760 acres.<br />
There were 281 farms with crops; 36 farms had cattle for a total of<br />
4,513 cattle; 66 farms had pigs and hogs with a total of 1,260 animals;<br />
21 farms had goats with a total of 482 animals. Thirty seven of<br />
the livestock farms sold livestock products worth a total of $367,383.<br />
There were 81 farms that had poultry; six of these farms sold<br />
poultry worth a total of $6,690; and eight of these farms sold poultry<br />
and eggs worth a combined total of $12,115 in 1990.<br />
Central Statistics Division, Department of Commerce
<strong>1998</strong> CNMI <strong>Statistical</strong> <strong>Yearbook</strong>, Chapter 12 Page 119<br />
Table 12.1 Am ount and Value of CNMI Com mercia l Fish Landing<br />
by Com mon Species: 1997<br />
Common Species Weight (lb) Value ($) Price per lb.<br />
Total 380,135 893,940 2.35<br />
Bigeye scad (atulai) 6,060 18,703 3.09<br />
Jacks 2,758 8,859 3.21<br />
Mullet 381 951 2.50<br />
Bottom fish 3,198 8,941 2.80<br />
Gindai (flower snap) 657 2,082 3.17<br />
Grouper 7,269 21,479 2.95<br />
Onaga 13,290 56,722 4.27<br />
Opakapaka (pink snp) 2,224 7,201 3.24<br />
Silvermouth (lehi) 1,100 4,708 4.28<br />
Reef fish 110,213 240,705 2.18<br />
Wrasse 11 33 3.00<br />
Rabbitfish 875 2,702 3.09<br />
Rudderfish (guilli) 2,815 7,040 2.50<br />
Emperor (mafute) 20,355 58,899 2.89<br />
Squirrelfish 7,080 14,228 2.01<br />
Parrotfish 6,157 16,029 2.60<br />
Snapper 421 1,175 2.79<br />
Surgeonfish 3,725 9,311 2.50<br />
Unicornfish 1,374 3,442 2.50<br />
Goatfish 14,077 27,649 1.96<br />
Troll Fish 1,962 3,987 2.03<br />
Barracuda 177 387 2.19<br />
Dolphin (mahimahi) 25,021 50,325 2.01<br />
Marlin 5,655 10,425 1.84<br />
Sailfish 100 199 1.99<br />
Rainbow runner 740 1,967 2.66<br />
Wahoo 6,064 13,696 2.26<br />
Tuna 3,862 7,460 1.93<br />
Skipjack tuna 106,757 231,251 2.17<br />
Dogtooth tuna 7,646 17,344 2.27<br />
Yellowfin tuna 17,121 42,580 2.49<br />
Invertebrates 49 318 6.55<br />
Lobster 347 1,643 4.74<br />
Octopus 598 1,502 2.51<br />
Source: Fish and Wildlife Division, Department of Natural Resources<br />
Central Statistics Division, Department of Commerce
Page 120 <strong>1998</strong> CNMI <strong>Statistical</strong> <strong>Yearbook</strong>, Chapter 12<br />
Table 12.2 Am ount and Va lue of CNMI Comm ercia l Fish Landing<br />
by Com mon Species: 1996<br />
Common Species Weight (lb) Value ($) Price per lb.<br />
Total 397,069 846,686 2.13<br />
Bigeye scad (atulai) 3,200 8,591 2.69<br />
Jacks 1,357 3,764 2.77<br />
Mullet 137 341 2.50<br />
Bottom fish 6,277 16,307 2.60<br />
Gindai (flower snap) 1,561 5,000 3.20<br />
Grouper 4,834 13,326 2.76<br />
Onaga (red snapper) 11,113 48,277 4.34<br />
Opakapaka (pink snp) 3,503 9,773 2.79<br />
Silvermouth (lehi) 2,053 7,908 3.85<br />
Reef fish 86,578 184,055 2.13<br />
Wrasse 313 713 2.28<br />
Rabbitfish (hitting) 1,061 2,937 2.77<br />
Rudderfish (guilli) 1,498 3,744 2.50<br />
Emperor (mafute) 9,225 24,565 2.66<br />
Squirrelfish 7,649 14,167 1.85<br />
Parrotfish 5,141 13,167 2.56<br />
Snapper 112 283 2.53<br />
Surgeonfish 2,574 6,370 2.48<br />
Unicornfish 3,193 7,981 2.50<br />
Goatfish 21,300 39,375 1.85<br />
Troll Fish 3,633 6,107 1.68<br />
Barracuda 194 351 1.81<br />
Dolphin (mahimahi) 28,524 54,439 1.91<br />
Marlin 5,632 9,412 1.67<br />
Sailfish 545 1,089 2.00<br />
Rainbow runner 823 2,084 2.53<br />
Wahoo 8,089 18,614 2.30<br />
Tuna 2,558 4,608 1.80<br />
Skipjack tuna 131,905 243,023 1.84<br />
Dogtooth tuna 8,946 18,763 2.10<br />
Yellowfin tuna 30,218 62,295 2.06<br />
Invertebrates 119 595 5.00<br />
Lobster 3,064 13,911 4.54<br />
Octopus 144 751 5.23<br />
Source: Fish and Wildlife Division, Department of Natural Resources<br />
Central Statistics Division, Department of Commerce
<strong>1998</strong> CNMI <strong>Statistical</strong> <strong>Yearbook</strong>, Chapter 12 Page 121<br />
Table 12.3 Com mercial Fish P urcha ses: 1997<br />
Average Weight Value<br />
Species Price/lb (Pounds) (Dollars)<br />
Total 2.35 380,135 893,940<br />
Troll fish 2.21 183,921 407,182<br />
Atulai 3.09 6,060 18,703<br />
Barracuda 2.19 177 387<br />
Other tuna 1.93 3,862 7,460<br />
Dogtooth tuna 2.27 7,646 17,344<br />
Jacks 3.21 2,758 8,859<br />
Mahi mahi 2.01 25,021 50,325<br />
Marlin 1.84 5,655 10,425<br />
Rainbow runner 2.66 740 1,967<br />
Sailfish 1.99 100 199<br />
Skipjack 2.17 106,757 231,251<br />
Wahoo 2.26 6,064 13,696<br />
Yellowfin tuna 2.49 17,121 42,580<br />
Assorted 2.03 1,962 3,987<br />
Reef fish 2.20 147,127 323,265<br />
Goat fish 1.96 14,077 27,649<br />
Rabbitfish 3.09 875 2,702<br />
Mullet 2.50 381 951<br />
Parrotfish 2.60 6,157 16,029<br />
Rudderfish 2.50 2,815 7,040<br />
Snapper 2.79 421 1,175<br />
Squirrelfish 2.01 7,080 14,228<br />
Surgeonfish 2.50 3,725 9,311<br />
Unicorn 2.50 1,374 3,442<br />
Wrasse 3.00 11 33<br />
Assorted 2.18 110,213 240,705<br />
Bottom fish 3.33 48,093 160,031<br />
Gindai 3.17 657 2,082<br />
Grouper 2.95 7,269 21,479<br />
Silvermouth 4.28 1,100 4,708<br />
Mafute 2.89 20,355 58,899<br />
Onaga 4.27 13,290 56,722<br />
Opakapaka 3.24 2,224 7,201<br />
Assorted 2.80 3,198 8,941<br />
Invertebrates 3.49 993 3,462<br />
Lobster 4.74 347 1,643<br />
Octupus 2.51 598 1,502<br />
Assorted 6.55 49 318<br />
Source: Fish and Wildlife Division, Department of Natural Resources<br />
Figure 12.1 Commericial fish landing by<br />
Pounds, 1990 to 1997<br />
Pounds<br />
Thousands<br />
600<br />
500<br />
400<br />
300<br />
200<br />
100<br />
0<br />
1990 '91 '92 '93 '94 '95 '96 1997<br />
Year<br />
Central Statistics Division, Department of Commerce
Page 122 <strong>1998</strong> CNMI <strong>Statistical</strong> <strong>Yearbook</strong>, Chapter 12<br />
Table 12.4 Com mercial Fish P urcha ses: 1996<br />
Average Weight Value<br />
Species Price/lb (Pounds) (Dollars)<br />
Total 2.13 397,069 846,686<br />
Troll fish 1.91 222,423 424,548<br />
Barracuda 1.81 194 351<br />
Other tuna 1.80 2,558 4,608<br />
Dogtooth tuna 2.10 8,946 18,763<br />
Jacks 2.77 1,357 3,764<br />
Mahi mahi 1.91 28,524 54,439<br />
Marlin 1.67 5,632 9,412<br />
Rainbow runner 2.53 823 2,084<br />
Sailfish 2.00 545 1,089<br />
Skipjack 1.84 131,905 243,023<br />
Wahoo 2.30 8,089 18,614<br />
Yellowfin tuna 2.06 30,218 62,295<br />
Assorted 1.68 3,633 6,107<br />
Reef fish 2.12 132,643 281,442<br />
Atulai 2.69 3,200 8,591<br />
Goat fish 1.85 21,300 39,375<br />
Hitting 2.77 1,061 2,937<br />
Mullet 2.50 137 341<br />
Parrotfish 2.56 5,141 13,167<br />
Rudderfish 2.50 1,498 3,744<br />
Squirrelfish 1.85 7,649 14,167<br />
Surgeonfish 2.48 2,574 6,370<br />
Unicorn 2.50 3,193 7,981<br />
Wrasse 2.28 313 713<br />
Assorted 2.13 86,578 184,055<br />
Bottom fish 3.24 38,677 125,439<br />
Gindai 3.20 1,561 5,000<br />
Grouper 2.76 4,834 13,326<br />
Silvermouth 3.85 2,053 7,908<br />
Mafute 2.66 9,225 24,565<br />
Onaga 4.34 11,113 48,277<br />
Opakapaka 2.79 3,503 9,773<br />
Snapper 2.53 112 283<br />
Assorted 2.60 6,277 16,307<br />
Invertebrates 4.59 3,327 15,257<br />
Lobster 4.54 3,064 13,911<br />
Octupus 5.23 144 751<br />
Assorted 5.00 119 595<br />
Source: Fish and Wildlife Division, Department of Natural Resources<br />
Central Statistics Division, Department of Commerce
<strong>1998</strong> CNMI <strong>Statistical</strong> <strong>Yearbook</strong>, Chapter 12 Page 123<br />
Table 12 .5 P ounds of Fish P r oducts Im por ted by Month:1992 to 1 997<br />
Year<br />
Month 1997 1996 1995 1994 1993 1992<br />
Figure 12.2 Fish Imports into CNMI by<br />
Pounds, 1992 to 1997<br />
Total 184,363 410,690 515,900 649,204 677,613 1,193,668<br />
January 48,691 44,451 31,964 77,124 64,209 44,614<br />
February 19,174 37,791 37,626 70,836 56,496 65,897<br />
March 17,914 43,669 58,131 82,670 69,990 191,367<br />
April 9,386 34,385 45,963 41,889 38,917 261,742<br />
May 12,988 30,432 49,274 33,443 51,098 360,790<br />
June 4,472 36,944 53,959 43,116 61,103 12,084<br />
July 5,477 35,972 43,807 40,169 59,212 31,662<br />
August 12,439 30,891 39,297 43,730 63,731 30,558<br />
September 12,090 33,270 39,673 66,158 56,753 23,419<br />
October 10,179 28,170 34,441 41,185 34,069 58,275<br />
November 16,313 22,171 42,090 61,988 42,502 37,499<br />
December 15,239 32,545 39,675 46,896 79,533 75,761<br />
Pounds<br />
Thousands<br />
1200<br />
800<br />
400<br />
0<br />
1992<br />
1993<br />
1994<br />
1995<br />
1996<br />
1997<br />
Source: Fish and Wildlife Division, Department of Natural Resources<br />
Table 12 .6 P ounds of Fish P roducts Im por ted by<br />
Countr y of Origin:1992 to 1997<br />
Country of<br />
Year<br />
Origin 1997 1996 1995 1994 1993 1992<br />
Total 184,363 410,690 515,900 649,204 677,613 1,193,668<br />
Palau 59,171 97,664 107,140 151,595 236,577 678,561<br />
Philippines 4,707 66,866 159,896 255,196 328,728 191,059<br />
Guam 49,670 97,203 103,037 112,062 48,069 46,279<br />
Chuuk 6,251 13,287 28,650 70,707 16,793 33,529<br />
Yap 8,082 48,064 33,489 12,119 18,597 92,557<br />
Pohnpei 12,154 27,694 27,315 7,831 11,705 87,004<br />
Japan 0 529 35 8,754 10,995 4,629<br />
Hong Kong 116 986 3,938 6,064 4,705 2,291<br />
U.S.A. 0 0 0 942 851 2,766<br />
Hawaii 7,677 41,597 32,648 20,600 0 0<br />
Kosrae 83 3,643 16,143 1,065 535 331<br />
Marshalls 35,159 12,562 1,539 394 44 188<br />
Others 1,293 596 2,070 1,874 14 54,474<br />
Source: Fish and Wildlife Division, Department of Natural Resources<br />
Figure 12.3 Annual Average Fish Pounds<br />
Imported by Country of Origin:<br />
1992 to1997<br />
Thousands<br />
250<br />
200<br />
150<br />
100<br />
50<br />
0<br />
Palau<br />
Guam<br />
Philippines<br />
Chuuk<br />
Yap<br />
Others<br />
Pohnpei<br />
Central Statistics Division, Department of Commerce
Page 124 <strong>1998</strong> CNMI <strong>Statistical</strong> <strong>Yearbook</strong>, Chapter 12<br />
Table 12 .7 Farms, Land in Fa rm s, and La nd Use: 1990 and 1 980<br />
1990 1980<br />
Number Farm size Number Farm size<br />
Land Use of Farms (acres) of Farms (acres)<br />
Farms 346 ... 299 ...<br />
Land in farms' ... 16,442 ... 12,187<br />
Average size of farm ... 48 ... 41<br />
Approximate land area ... 117,760 ... 117,760<br />
Proportion in farms (percent) ... 14.0 ... 10.3<br />
Cropland 281 5,235 289 2,643<br />
Used for crops 270 769 280 950<br />
Used for other purposes 80 4,466 146 1,693<br />
Pastureland, except cropland pastured 124 5,534 129 8,706<br />
Other land 218 5,673 132 839<br />
Source: 1990 Census of Agriculture AC87-A-56 Table 1<br />
Note: Detail may not add to total due to rounding<br />
Table 12.8 Num ber of Livestock Fa rm s, Livestock P roducts a nd Sales in CNMI,<br />
1989 : 1990<br />
Sales<br />
No. of No. of No. of No. of Amount of<br />
Livestock farms Livestock farms Livestock sales ($)<br />
Cattle and calves of all ages 36 4,513 14 702 329,598<br />
Milk cows 6 80 ... 22 13,200<br />
Other cattle and calves 33 4,433 ... 680 316,398<br />
Hog and pigs of all ages 66 1,260 28 360 33,565<br />
Goats and kids of all ages 21 482 3 8 (D)<br />
Horses, mules,<br />
and colts of all ages 2 (D) 1 (D) (D)<br />
Other livestock 4 32 1 (D) (D)<br />
Livestock sales ... ... 37 ... 367,383<br />
Source: 1990 Census of Agriculture, AC87-A-56, Table 8<br />
Note: (D)=Withheld to avoid disclosing figures for individual establishments. Data are included in higher level totals.<br />
Central Statistics Division, Department of Commerce
<strong>1998</strong> CNMI <strong>Statistical</strong> <strong>Yearbook</strong>, Chapter 12 Page 125<br />
Table 12 .9 Num ber of P oultr y Fa rm s, P oultr y P roducts, a nd Sales<br />
in 1989: 1990<br />
Sales<br />
No. of No. of No. of No. of Amount of<br />
Poultry & Products farms poultry farms poultry sales ($)<br />
Chickens 63 9,580 6 1,305 6,690<br />
Other poultry 18 562 1 (D) (D)<br />
Chicken egg sales ... ... 2 ... (D)<br />
Poultry and egg sales ... ... 8 ... 12,115<br />
Source: 1990 Census of Agriculture, AC87-A-56, Table 8<br />
Note: (D) means withheld to avoid disclosing figures for individual establishments. Data are included<br />
in higher level totals.<br />
Table 12 .10 Com mercia l Fish La nding s by P ound, CNMI: 1993 to 1997<br />
Calendar Year<br />
Type 1997 1996 1995 1994 1993<br />
Total 380,135 397,069 423,563 312,670 298,747<br />
Troll fish 183,921 222,423 190,283 116,583 145,169<br />
Reef fish 147,127 132,643 194,530 172,931 136,600<br />
Bottom fish 48,093 38,677 34,720 19,136 14,406<br />
Invertebrates 993 3,327 4,029 4,021 2,574<br />
Source: Division of Fish & Wildlife<br />
Table 12.11 Fish La nding s by Va lue and Avera ge P er P ound: 1993 to 1 997<br />
Type 1997 1996 1995 1994 1993<br />
Troll fish 407,182 424,548 358,518 206,006 249,682<br />
Reef fish 323,265 281,442 441,367 403,926 324,935<br />
Bottom fish 160,031 125,439 115,005 53,319 36,387<br />
Invertebrates 3,462 15,257 22,434 22,155 11,542<br />
Troll fish 2.21 1.91 1.88 1.77 1.72<br />
Reef fish 2.20 2.12 2.27 2.34 2.38<br />
Bottom fish 3.33 3.24 3.31 2.79 2.53<br />
Invertebrates 3.49 4.59 5.57 5.51 4.48<br />
Source: Division of Fish & Wildlife<br />
Central Statistics Division, Department of Commerce
Chapter 13<br />
REVENUES<br />
AND<br />
EXPENDITURES
Page 128 <strong>1998</strong> CNMI <strong>Statistical</strong> <strong>Yearbook</strong>, Chapter 13<br />
Summary of Revenues<br />
The actual revenues collected by the CNMI government increased<br />
from 1993 through 1997. Gross receipt tax slightly declined<br />
in 1994, but still remains the largest component of total internal<br />
revenues followed by the wage and salary tax. Important sources<br />
of revenue that have also increased from 1993 through 1997 included<br />
the user fee tax and the hotel room tax.<br />
Reported business gross revenues, in nominal dollars, increased<br />
from calendar year 1993 to 1997. The garment industry, retail trade,<br />
and restaurant and bars, recorded steady increases during this<br />
period.<br />
Reported total wages and salary paid in 1996 amounted to<br />
515,774,000. By selected activities, the government paid the highest<br />
total amount of wages and salary, followed by the garment, retail<br />
trade, hotels, construction, wholesalers and banking/finance in<br />
1996.<br />
The tables in this chapter show annual revenues and wage and<br />
salary figures in the CNMI in recent years.<br />
Central Statistics Division, Department of Commerce
<strong>1998</strong> CNMI <strong>Statistical</strong> <strong>Yearbook</strong>, Chapter 13 Page 129<br />
Table 13.1 Commonwea lth of the Nor thern Maria na Isla nds Actua l<br />
Revenue Collected: 1993 to 1997<br />
(in $US thousand dollars)<br />
Fiscal Year<br />
Resources 1997 1996 1995 1994 1993<br />
Total Revenue 250,853 222,355 199,779 152,199 139,770<br />
Internal Resources 250,853 222,355 199,779 152,199 139,770<br />
NMTIT income tax 25,795 26,427 22,387 8,069 5,079<br />
Wage & salary tax 29,438 29,861 24,998 22,950 18,745<br />
Gross receipt tax 71,041 67,187 59,104 57,631 58,526<br />
Excise tax 29,048 25,007 26,818 18,250 16,634<br />
User fee tax 27,736 17,981 13,897 9,576 8,907<br />
Beverage container tax 1,585 1,646 3,461 1,212 1,326<br />
Liquid fuel tax 4,925 7,523 6,459 5,973 3,051<br />
Hotel room occupancy tax 11,397 9,932 8,656 7,771 6,951<br />
Business license fees 784 748 675 367 304<br />
Hospital fees 12,343 7,601 6,385 6,637 6,591<br />
Immigration fees 2,449 1,795 1,738 1,363 1,429<br />
Other internal resources 34,312 26,647 25,200 12,401 12,227<br />
Source: Department of Finance<br />
Table 13 .2 Repor ted Business Gross Revenue by Business Activity:<br />
Ca lenda r Years 1993 to 1997 (in $US million dolla rs)<br />
Calendar Year<br />
Business Activity 1997 1996 1995 1994 1993<br />
Total 2,610.3 2,224.4 1,830.9 1,452.7 1,398.5<br />
Agriculture/fishing 4.4 4.4 2.3 3.0 1.0<br />
Air transportation 18.8 7.5 13.1 13.1 4.5<br />
Banking 51.7 49.6 27.7 0.1 5.9<br />
Construction 76.9 84.6 103.3 82.6 87.4<br />
Garment manufacturing 524.4 484.3 209.3 250.3 293.1<br />
Hotels/motels 167.6 170.8 136.2 107.2 111.7<br />
Manufacturing 163.4 69.4 201.7 31.1 6.8<br />
Restaurants/bars 65.4 60.2 51.4 48.1 44.4<br />
Retail trade 635.4 458.5 393.3 266.4 347.6<br />
Shipping 5.1 4.2 7.9 7.8 0.6<br />
Wholesale trade 154.6 153.8 133.3 125.8 43.4<br />
Professional service 136.5 153.9 103.2 71.8 34.3<br />
Petroleum 54.4 114.9 48.5 ... 3.4<br />
Land lease 12.2 10.3 13.0 9.1 15.0<br />
Transportation services 18.3 14.7 13.0 10.1 15.1<br />
Gas service stations 4.8 5.5 6.9 8.7 8.8<br />
Freight forwarders ... ... ... ... 2.4<br />
Others 516.4 377.9 367.0 417.3 372.9<br />
Sale of leasehold 0.0 0.0 0.0 0.0 0.2<br />
Source: Department of Finance<br />
Figure 13.1 Reported Business Gross<br />
Revenue by Activities in US $<br />
million dollars: 1996 and<br />
1997.<br />
Construction<br />
Professional service<br />
Garment manufactu<br />
Wholesale trade<br />
Hotels/motels<br />
Manufacturing<br />
Retail trade<br />
Other<br />
0<br />
150 450 750<br />
300 600 900<br />
1997<br />
1996<br />
Central Statistics Division, Department of Commerce
Page 130 <strong>1998</strong> CNMI <strong>Statistical</strong> <strong>Yearbook</strong>, Chapter 13<br />
Figure 13.2 Percent Distribution of<br />
Reported Wages and Salary by<br />
Sector, 1996<br />
Petroleum<br />
Banking/finance<br />
Wholesalers<br />
Construction<br />
Hotels<br />
Retail trade<br />
Garment mfg<br />
Government<br />
All others<br />
Percent<br />
0 5 10 15 20 25 30 35<br />
Table 13.3 Reported Wage a nd Sala ry by Selected Activity: Calendar Yea r<br />
1992 to 1996 (in $ US thousands dollars)<br />
Calendar Year<br />
Wages and Salary 1996 1995 1994 1993 1992<br />
Total 515,774 464,774 415,444 384,775 366,972<br />
Government 165,820 154,345 140,726 133,642 78,600<br />
Retail trade 46,929 46,520 46,176 42,419 29,310<br />
Construction 29,230 29,870 26,768 27,444 36,160<br />
Hotels 31,775 19,829 21,959 23,831 23,347<br />
Banking and finance 4,016 4,376 3,612 3,550 3,313<br />
Wholesalers 4,905 3,904 5,560 5,053 6,536<br />
Garment manufacturing 92,147 72,963 64,204 52,659 51,711<br />
Petroleum 477 239 211 334 1,032<br />
All others 140,476 132,728 106,228 95,844 136,964<br />
Source: Department of Finance<br />
Note: Government includes a utonomous a gencies, federa l a gencies, a nd retirement fund.<br />
Table 13.4 : CNMI Opera ting Expenditur es by Function, 1992 to 1 996,<br />
Gener al Fund<br />
(in $US thousand dollars)<br />
Fiscal Year<br />
Function 1996 1995 1994 1993 1992<br />
Operating Expenditures 212,961 191,446 181,501 154,064 156,939<br />
Health 40,099 39,533 43,610 41,499 36,674<br />
Education 42,424 39,575 38,773 34,572 37,083<br />
Public Safety 20,740 14,808 14,033 13,734 11,821<br />
Public Works 10,436 10,789 6,310 6,197 8,409<br />
Community & Social Services 11,000 7,887 8,732 3,617 2,373<br />
Lands & Natural Resources 10,036 11,746 4,807 5,142 4,332<br />
Economic Development 7,646 7,747 7,187 5,608 7,192<br />
Judiciary 4,222 3,538 2,886 2,001 1,579<br />
Legislature 4,910 4,835 4,825 4,871 4,638<br />
Other elected Officials 19,566 15,020 14,885 11,957 12,752<br />
General Government 41,882 35,967 35,452 24,865 30,086<br />
Source: Department of Finance<br />
Central Statistics Division, Department of Commerce
<strong>1998</strong> CNMI <strong>Statistical</strong> <strong>Yearbook</strong>, Chapter 13 Page 131<br />
Table 13 .5 Cha racter istics of Gener al Fund Revenues : FY1993 - FY1997<br />
(in $ US thousa nds)<br />
Fiscal Year<br />
1997 1996 1995 1994 1993<br />
Revenues: 242,562 216,765 193,656 141,715 139,770<br />
Taxes 200,879 186,444 166,493 124,166 120,600<br />
Business gross revenue 74,568 67,062 59,104 57,631 58,526<br />
Wages and salary/Income 46,564 53,883 47,384 22,396 23,824<br />
Excise 56,828 25,007 26,818 18,250 16,634<br />
Fuel 4,925 7,523 6,459 5,973 3,051<br />
Beverage container 3,998 1,646 1,746 1,212 1,326<br />
Hotel room occupancy 10,801 9,941 8,656 7,771 6,951<br />
Other 3,196 21,382 16,326 10,933 10,287<br />
Covenant funding 0 0 0 0 0<br />
Licenses and fees 9,182 7,264 6,560 4,763 5,109<br />
Amusement machines 3,949 2,971 2,347 1,630 1,669<br />
Business licenses 683 748 675 367 304<br />
Immigration / Alien<br />
Reg. Fees 2,065 1,795 1,738 1,363 1,429<br />
Other 2,485 1,750 1,800 1,403 1,707<br />
Charges for services 20,864 9,505 7,817 8,227 7,714<br />
Hospital Services 11,806 7,467 6,385 6,637 6,591<br />
Other 9,058 2,038 1,432 1,591 1,123<br />
Penalties/Interest<br />
Delinquent Taxes 0 1,977 2,396 2,225 1,535<br />
Other 11,637 11,575 10,390 2,334 4,812<br />
Source: Department of Finance<br />
Table 13.6 Character istics of Gener al Fund Expenditur es : FY1992 - FY1996<br />
(in $ US thousands dolla rs)<br />
Fiscal Year<br />
1996 1995 1994 1993 1992<br />
Expenditures: 212,961 191,446 181,501 154,064 156,939<br />
General Government 41,882 35,967 35,452 24,865 30,086<br />
Administration (Liaison, other<br />
Offices of the Governor) 4,932 2,831 1,613 1,408 1,028<br />
Office of Management & Budget 1,668 1,328 1,013 904 1,045<br />
Attorney General 1,742 1,656 3,463 3,473 3,782<br />
Public Defender 523 527 470 412 346<br />
Dept. of Finance 10,859 8,925 7,620 6,836 14,145<br />
Dept. of Labor & Immigration 5,600 4,641 0 0 0<br />
Dept. of Personnel 1,304 1,731 2,218 2,164 2,139<br />
Boards and Commissions 2,076 501 1,684 1,718 393<br />
Office of the Public Auditor 1,245 988 1,015 933 941<br />
Other expenditures 11,933 12,839 16,355 7,019 6,267<br />
Health 40,099 39,533 43,610 41,499 36,674<br />
Education 42,424 39,575 38,773 34,572 37,083<br />
Public Safety 20,740 14,808 14,033 13,734 11,821<br />
Public Works 10,436 10,789 6,310 6,197 8,409<br />
Community & Social Services 11,000 7,887 8,732 3,617 2,373<br />
Lands & Natural Resources 10,036 11,746 4,807 5,142 4,332<br />
Economic Development 7,646 7,747 7,187 5,608 7,192<br />
Judiciary 4,222 3,538 2,886 2,001 1,579<br />
Legislature 4,910 4,835 4,825 4,871 4,638<br />
Other Elected Offices 19,566 15,020 14,885 11,957 12,752<br />
Source: Department of Finance<br />
Note: Labor & Immigration was established in 1994.<br />
Note: Data for FY91, 92, 93, 94, 95 and 96 have been updated to reflect FY91 to FY96 Audit Report.<br />
Central Statistics Division, Department of Commerce
Page 132 <strong>1998</strong> CNMI <strong>Statistical</strong> <strong>Yearbook</strong>, Chapter 13<br />
Table 13.7 CNMI Statem ent of Revenue Type by Sour ce: FY 1993 to FY 1997<br />
(in $US thousands dolla rs)<br />
Fiscal Year<br />
Resource 1997 1996 1995 1994 1993<br />
Revenues 288,642 261,015 233,449 187,559 168,590<br />
Taxes 200,879 190,941 168,891 134,922 122,135<br />
Business gross revenue 74,568 67,187 59,104 57,631 52,526<br />
Wages and salary/income 46,564 56,288 47,386 31,019 23,824<br />
Excise 56,828 42,988 40,715 27,827 25,541<br />
Fuel 4,925 7,523 6,459 5,973 3,051<br />
Beverage container 3,998 4,130 3,461 1,812 1,924<br />
Hotel room occupancy 10,801 9,932 8,656 7,771 6,951<br />
Other 3,196 2,892 3,111 2,890 8,319<br />
Covenant funding 0 0 0 0 0<br />
Federal contributions 26,597 28,478 25,334 20,862 18,807<br />
Other contributions 4,332 1,941 2,322 2,215 427<br />
Licenses and fees 9,263 7,720 6,743 5,054 5,359<br />
Charges for services 20,864 12,612 9,033 9,333 7,762<br />
Land leases 6,293 6,541 4,448 4,657 2,825<br />
Other 20,413 12,783 16,679 10,516 11,276<br />
Source: Deloitte & Touche Annual Report<br />
Central Statistics Division, Department of Commerce
Chapter 14<br />
PRICE INDEX
Page 134 <strong>1998</strong> CNMI <strong>Statistical</strong> <strong>Yearbook</strong>, Chapter 14<br />
Summary of Price Index<br />
The consumer price index increased in almost all quarters since<br />
1988, except for the second quarter of 1990, third quarter of 1991,<br />
fourth quarter of 1992, third quarter of 1994, second quarter of<br />
1996 and along with first and fourth quarter of 1997. The base<br />
year for the CNMI price index is 1977 third quarter prices. By major<br />
consumer commodity group, the health and recreation index<br />
increased faster than all other commodity group indexes, followed<br />
by the transportation index. Indexes for food, apparel, and housing<br />
increased, but at comparatively lower rates.<br />
Central Statistics Division, Department of Commerce
<strong>1998</strong> CNMI <strong>Statistical</strong> <strong>Yearbook</strong>, Chapter 14 Page 135<br />
Table 14.1 Consum er Pr ice Index: 1977 .3 to 1997.4<br />
Weig hted<br />
(1977 .3 = 100)<br />
Year Apparel Health<br />
and and Trans- and<br />
Quarter Total Food Housing Upkeep portation Recreation<br />
1977.3 100.0 100.0 100.0 100.0 100.0 100.0<br />
1988.2 177.8 162.4 161.3 146.6 184.8 271.8<br />
1988.3 178.6 163.7 161.7 146.6 185.2 272.7<br />
1988.4 182.3 165.3 164.6 146.6 182.5 290.9<br />
1989.1 188.4 166.4 183.8 159.5 183.4 295.0<br />
1989.2 188.5 165.8 181.3 160.5 192.2 295.5<br />
1989.3 190.2 164.8 186.2 166.2 188.7 302.9<br />
1989.4 193.7 167.9 190.8 181.8 187.3 301.0<br />
1990.1 195.8 172.4 191.1 181.8 191.4 297.4<br />
1990.2 194.6 170.8 190.0 181.8 189.5 297.4<br />
1990.3 200.2 173.4 187.4 187.4 205.4 319.1<br />
1990.4 206.7 177.0 184.6 194.3 240.6 331.4<br />
1991.1 214.4 187.5 195.0 173.6 242.6 347.8<br />
1991.2 215.5 184.9 190.2 199.5 239.7 355.9<br />
1991.3 214.4 189.1 184.3 203.8 236.6 340.5<br />
1991.4 215.4 190.6 186.6 203.8 236.3 339.3<br />
1992.1 225.4 187.4 186.5 204.4 244.5 417.5<br />
1992.2 227.4 187.0 191.7 209.2 248.0 421.0<br />
1992.3 239.5 201.6 201.2 185.2 252.1 456.5<br />
1992.4 239.3 198.4 200.7 189.5 251.3 464.4<br />
1993.1 240.1 199.1 200.5 191.5 258.6 462.7<br />
1993.2 240.6 199.3 200.2 192.2 261.7 463.9<br />
1993.3 244.3 203.9 204.3 192.2 263.1 467.4<br />
1993.4 247.7 203.8 209.2 194.3 263.8 483.2<br />
1994.1 249.2 207.1 208.4 195.2 263.8 482.8<br />
1994.2 249.8 205.7 206.6 195.3 262.3 495.7<br />
1994.3 249.6 202.5 206.3 196.1 274.0 498.7<br />
1994.4 251.4 201.8 210.6 198.2 284.1 500.3<br />
1995.1 252.5 203.2 212.5 199.3 286.7 498.2<br />
1995.2 254.1 205.3 214.2 199.4 287.2 499.7<br />
1995.3 254.8 204.9 213.7 203.5 299.2 497.3<br />
1995.4 256.5 208.5 213.5 203.5 298.0 497.3<br />
1996.1 259.4 210.8 213.5 208.5 309.6 500.4<br />
1996.2 258.1 206.8 214.7 211.0 311.3 500.3<br />
1996.3 262.7 209.1 214.0 211.7 313.7 524.5<br />
1996.4 267.7 214.7 219.4 211.7 316.4 532.1<br />
1997.1 264.7 210.2 225.4 211.4 318.1 517.1<br />
1997.2 265.4 211.4 225.1 212.6 318.1 517.3<br />
1997.3 265.4 209.1 227.3 212.2 318.5 522.3<br />
1997.4 264.3 207.8 223.5 212.8 320.4 522.6<br />
Source : Central Statistics Division, Department of Commerce<br />
Central Statistics Division, Department of Commerce
Chapter 15<br />
LAND USE
Page 138 <strong>1998</strong> CNMI <strong>Statistical</strong> <strong>Yearbook</strong>, Chapter 15<br />
Summary of Land Use<br />
The biggest island, among the fourteen islands in the CNMI, is<br />
Saipan, followed by Tinian, then Rota. The highest peak in the CNMI<br />
is in Agrihan, 3,166 feet above sea level. Most of the land mass in<br />
the Commonwealth is public land, only about 27 percent of the total<br />
land area is privately owned.<br />
According to the Marianas Public Land Corporation’s Annual<br />
Report of the 6612.7 hectares of public land, about 13 percent was<br />
set aside for conservation and wildlife, while, 5 percent was used<br />
for temporary agriculture grazing. Another 10 percent of public<br />
land was used for public facilities and 8.4 percent was used for<br />
village homestead. Roughly 6 percent of the land was used for<br />
resort hotels with golf courses, and another 6.3 percent was used<br />
for transportation. A little over 6 percent was also set aside for proposed<br />
golf courses. Over 1 percent was reserved for land exchanges,<br />
1.4 percent was used for commercial lease, less than 1 percent was<br />
used for hotel leases, and 42.1 percent was used for other purposes.<br />
During the period between 1992 to 1997, a total of 1,646 homestead<br />
permits were issued to private individuals. At the same time,<br />
during this period, the number of permits issued fluctuated.<br />
Central Statistics Division, Department of Commerce
<strong>1998</strong> CNMI <strong>Statistical</strong> <strong>Yearbook</strong>, Chapter 15 Page 139<br />
Table 15 .1 CNMI Geog ra phic Character istics : 1995<br />
Highest Distance Private<br />
Area Elevation from Saipan Land<br />
Islands (Sq. Mi) (Feet) (Naut. Mi.) (Percent)<br />
Total 176.5 3,166 ... 27<br />
Rota 32.8 1,625 69 South 35<br />
Aguijan (Goat Is.) 2.7 584 12 S. 0<br />
Tinian 39.2 583 6 S. 20<br />
Saipan 46.5 1,554 ... 62<br />
Farallon de Medinilla 0.4 266 45 North 0<br />
Anatahan 12.5 2,585 75 N. 0<br />
Sarigan 1.9 1,801 95 N. 0<br />
Guguan 1.5 988 130 N. 0<br />
Alamagan 4.4 2,441 146 N. 0<br />
Pagan 18.6 1,870 173 N. 0<br />
Agrihan 11.4 3,166 206 N. 0<br />
Asuncion 2.8 2,923 260 N. 0<br />
Maug (3 islands) 0.8 746 280 N. 0<br />
Farallon de Pajaros 1.0 1,047 315 N. 0<br />
Source: Division of Public Lands<br />
Table 15 .2 P ublic La nd by Land Use Ca ter gory in 1997<br />
Area<br />
Land Use Category Hectares Percent<br />
Total 6,612.7 57.9<br />
Conservation and wildlife areas 845.33 12.8<br />
Temporary agriculture grazing 323.87 4.9<br />
Public facilities 655.78 9.9<br />
Village homestead 554.07 8.4<br />
Resort hotels with golf courses 406.80 6.2<br />
Proposed new golf courses 415.00 6.3<br />
Transportation 415.31 6.3<br />
Reserved for land exchanges 79.27 1.2<br />
Commercial lease 91.39 1.4<br />
Hotel leases 40.53 0.6<br />
Other 2,785.35 42.1<br />
Source: Division of Public Lands<br />
Central Statistics Division, Department of Commerce
Page 140 <strong>1998</strong> CNMI <strong>Statistical</strong> <strong>Yearbook</strong>, Chapter 15<br />
Ta ble 15.3 Num ber of Village Hom estea d P er m its Issued by Island:<br />
1992 - 1997<br />
Island 1997 1996 1995 1994 1993 1992<br />
Total 173 77 90 750 201 355<br />
Saipan 16 77 90 750 45 100<br />
Dandan 0 0 0 1 20 42<br />
Lower Navy Hill 0 0 2 3 0 0<br />
Kagman III 16 76 82 734 0 0<br />
Kagman II 0 0 3 8 5 41<br />
Kagman I 0 0 0 0 0 3<br />
As Matuis 0 1 3 3 16 11<br />
Rota 157 0 0 0 0 255<br />
Sinapalo III 82 0 0 0 0 0<br />
Sinapalo II 61 0 0 0 0 255<br />
Sinapalo I 14 0 0 0 0 0<br />
Tinian 0 0 0 0 156 0<br />
Source: Division of Public Lands<br />
Table 15.4 Num ber of Land Exchange Ca ses: 1993 to 1 997<br />
Year<br />
Case Status 1997 1996 1995 1994 1993<br />
Saipan<br />
Completed 34 33 2 27 61<br />
Pending 10 30 36 7 49<br />
Rota<br />
Completed 0 5 0 13 0<br />
Pending 0 2 0 4 6<br />
Source: Division of Public Land<br />
Table 15.5 Type and Number of Perm its a nd Com mercia l Lea ses Issued<br />
by Division of P ublic Land in 1992 to 1996<br />
Number of Permits Issued<br />
Type of Permit 1996 1995 1994 1993 1992<br />
Commercial Pemits, 1-5 year 0 13 4 5 20<br />
Quarry Permits 1 3 0 1 21<br />
Maintenance Permits 0 0 1 4 0<br />
Agriculture/Grazing Permits 0 2 2 3 468<br />
Saipan 0 0 2 0 251<br />
Rota 0 0 0 3 200<br />
Tinian 0 0 0 0 17<br />
Commercial Lease 9 12 3 2 105<br />
Source: Division of Public Lands, Department of Land & Natural Resources<br />
Central Statistics Division, Department of Commerce
Chapter 16<br />
TERRITORIAL<br />
COMPARISONS
Page 142 <strong>1998</strong> CNMI <strong>Statistical</strong> <strong>Yearbook</strong>, Chapter 16<br />
Summary of Territorial Comparisons<br />
Compared to other island territories and island nations, the CNMI<br />
is small in land area. The CNMI has seen an increase in population<br />
in recent years, but its population is small compared to other<br />
territories and island nations. Similarly, population density has<br />
increased in the Commonwealth in recent years, but it is still<br />
comparatively lower than population densities in other territories<br />
and island nations.<br />
Compared to the United States and other U.S. territories—Guam,<br />
American Samoa, and Virgin Islands—and according to the 1995<br />
Census, the CNMI had,<br />
• the second lowest population,<br />
• the lowest percent of population 65 years and over,<br />
• the lowest number of married couples,<br />
• the second lowest number of children ever born per 1000<br />
women,<br />
Central Statistics Division, Department of Commerce
<strong>1998</strong> CNMI <strong>Statistical</strong> <strong>Yearbook</strong>, Chapter 16 Page 143<br />
• the lowest percent (37.8) of own population born inside the<br />
area,<br />
• the highest proportion of own population who lived in a<br />
different house in 1990,<br />
• the second highest, next to the U.S., percentage of own<br />
population with a high school diploma,<br />
• the highest labor force participation rate,<br />
• the highest proportion of female population in labor force,<br />
• the second highest median number of rooms per housing<br />
unit,<br />
The tables in this chapter show detailed comparisons of the<br />
CNMI, U.S., and other territories.<br />
Central Statistics Division, Department of Commerce
Page 144 <strong>1998</strong> CNMI <strong>Statistical</strong> <strong>Yearbook</strong>, Chapter 16<br />
Table 16.1 P hysica l and Demog ra phic Fea tures of P acific Isla nd Countr ies: 1995<br />
Midyear Population 1995<br />
Annual<br />
Land Sea Density growth<br />
area area Total (Persons rate (%)<br />
Country (sq.mi.) (sq.mi.) (1,000) /sq.mi.) (1990-2000)<br />
Northern Mariana Is. 177 704 58 328 3.5<br />
American Samoa 76 151 57 747 3.8<br />
Cook Islands 93 706 19 208 1.1<br />
Fed. States Micronesia 271 1,150 123 454 2.0<br />
Fiji 7,053 498 773 110 1.1<br />
French Polynesia 1,260 1,942 220 156 2.2<br />
Guam 209 84 153 734 2.4<br />
Kiribati 266 1,370 79 287 1.9<br />
Marshall Islands 70 823 56 804 3.9<br />
Nauru 8 124 10 1,252 1.3<br />
New Caledonia 7,374 672 185 25 1.7<br />
Palau 191 243 17 94 1.7<br />
Papua New Guinea 178,426 1,204 4,295 25 2.3<br />
Solomon Islands 10,637 517 399 38 3.4<br />
Tonga 270 270 106 381 0.8<br />
Tuvalu 24 347 10 995 1.6<br />
Vanuatu 4,586 262 174 30 2.2<br />
Wallis and Futuna 98 116 14 137 1.1<br />
Western Samoa 1,133 46 209 190 2.3<br />
Source: International Data Base, U.S. Bureau of the Census<br />
Table 16.2 Selected Demographic Cha ra cter istics: 1995<br />
Northern United American Virgin<br />
Characteristics Marianas States Guam Samoa Islands FSM Palau<br />
Total Population 58,846 262,105,000 140,910 49,775 100,130 105,506 17,225<br />
Persons per household 3.95 2.67 3.9 5.88 3.05 6.8 4.86<br />
Males per 100 Females 97.1 95.6 99.6 103.2 88.5 104.5 103.8<br />
Percent:<br />
Under 18 years 27.6 26.9 34.6 45.7 35.2 50.9 32.7<br />
65 years and over 1.6 11.9 7.6 3.7 8.9 3.6 5.7<br />
Median Age<br />
Total 28.0 33.6 26.9 20.6 29.7 17.8 28.1<br />
Female 26.7 34.6 27.1 21.1 30.9 18.1 27.3<br />
Percent:<br />
Married Couples 51.1 77.7 73.1 77.6 57.2 78.7 73.8<br />
Female Householder, no husband 10.3 17.6 18.1 15.7 33.8 13.8 19.8<br />
CEB per 1000 woman 15-44 yrs 1,356 1,242 2,568 1,823 1,923 2,254 1,446<br />
Source: 1995 Census of Population and Housing; Various reports from Insular Areas and the United States Bureau of the Census.<br />
Note: CEB stands for Children Ever Born<br />
Central Statistics Division, Department of Commerce
<strong>1998</strong> CNMI <strong>Statistical</strong> <strong>Yearbook</strong>, Chapter 16 Page 145<br />
Ta ble 16 .3 Selected Socia l Cha ra cter istics: 19 95<br />
Northern United American Virgin<br />
Characteristics Marianas States Guam Samoa Islands FSM Palau<br />
Population 58,846 262,105,000 140,910 49,775 100,130 105,506 17,225<br />
Percent:<br />
Born in this area 37.8 91.2 58.2 60.6 51.0 96.8 72.0<br />
Not a US Citizen 53.3 6.1 14.4 27.8 14.7 2.6 24.3<br />
5 years and over:<br />
Residence 5 years ago:<br />
This House 28.6 ... 59.1 79.4 62.2 ... 56.4<br />
Outside this Area 46.4 ... 16.6 8.6 11.7 2.4 25.4<br />
Speak only English at home 14.1 ... 44.7 7.1 75.1 1.6 20.7<br />
25 years and over:<br />
Total High school graduates 75.8 87.1 73.1 61.0 58.6 31.8 60.8<br />
Female High School Graduates 70.7 88.2 70.8 60.8 60.1 22.4 58.6<br />
Total Completed 4 yr. College 17.7 25.0 17.7 5.9 16.6 4.7 12.2<br />
Total Female Completed 4 yr. Coll. 17.1 24.9 18.9 4.5 17.0 2.1 12.8<br />
Source: 1995 Cenus of Population and Housing. Various reports from Insular Areas and the United States Bureau of the Census.<br />
Table 16.4 Selected Econom ic Character istics: 1995<br />
Northern United American Virgin<br />
Characteristics Marianas States Guam Samoa Islands FSM Palau<br />
Population 16 years and over 43,846 198,022,000 94,535 29,250 61,980 59,573 12,114<br />
Total in labor force (%) 85.6 66.2 57.1 44.6 61.9 43.6 68.5<br />
Females in labor force (%) 81.2 58.7 47.5 35.7 56.5 30.1 58.8<br />
Private wage and salary workers (%) 82.7 76.2 66.8 57.0 60.9 44.5 63.3<br />
Manufacturing industries (%) 22.3 ... ... 32.2 7.7 3.4 1.0<br />
Professional occupation (%) 19.9 26.9 ... 22.0 21.4 16.3 23.8<br />
Median household income in 1994 ($) 19,094 32,264 30,035 12,278 27,422 4,494 11,810<br />
Median family income in 1994 ($) 21,166 38,782 25,745 11,532 29,501 4473 12791<br />
Per capita income in 1994 ($) 6,897 16,555 11,552 2,861 12,748 940 3508<br />
Percent below poverty level (%) 54.2 11.6 25.4 67.7 29.1 91.0 62.8<br />
Source: U.S. Census of Population and Housing; Various reports from Insular Areas and the United States Bureau of the Census.<br />
Central Statistics Division, Department of Commerce
Page 146 <strong>1998</strong> CNMI <strong>Statistical</strong> <strong>Yearbook</strong>, Chapter 16<br />
Ta ble 16 .5 Characteristics of Year-Round Housing Units: 199 5<br />
Northern United American Virgin<br />
Characteristics Marianas States Guam Samoa Islands FSM Palau<br />
Housing units 14,590 106,611,000 36,505 8,460 43,707 16,609 3,235<br />
Percent:<br />
One family house detached 55.6 60.3 59.7 84.1 43.5 88.9 74.6<br />
Outside walls concrete 71.5 ... 91.2 52.0 ... 42.1 35.0<br />
Roof poured concrete 50.4 ... 82.9 2.8 ... 14.8 12.8<br />
Median no. of rooms 4.4 5.3 4.3 4.1 4.3 3.2 4.0<br />
Percent:<br />
Complete plumbing 39.9 97.8 97.4 59.0 86.5 6.3 45.2<br />
Hot and cold water 41.1 99.9 88.1 17.5 81.1 4.0 20.5<br />
Flush toilet 92.5 99.8 99.0 95.2 99.2 34.4 62.3<br />
Water from public system 93.8 84.7 99.6 74.1 49.2 17.8 92.1<br />
Connected to public sewer 35.0 75.8 73.8 29.4 54.6 10.7 41.3<br />
Source: 1995 U.S. Census of Population and Housing; Various reports from Insular Areas and the United States<br />
Bureau of the Census<br />
Note: "..." means not available.<br />
Table 16.6 Characteristics of Occupied Housing Units: 1995<br />
Northern United American Virgin<br />
Characteristics Marianas States Guam Samoa Islands FSM Palau<br />
Housing Units 14,590 106,611,000 36,505 8,460 43,707 16,609 3,235<br />
Percent:<br />
Owner occupied 33.5 64.7 54.6 81.2 52.4 73.8 75.7<br />
Complete kitchen facilities 69.8 96.4 91.3 59.5 ... 11.3 72.4<br />
Electricity 80.9 100.0 99.7 98.1 ... 51.2 99.2<br />
With refrigerator 74.4 97.4 98.8 84.5 ... 23.5 82.0<br />
Air conditioning 55.9 69.6 81.2 9.6 11.5 5.4 24.2<br />
With telephone 50.4 6.6 94.4 67.8 90.0 28.0 53.4<br />
With automobile 74.0 89.7 98.5 53.4 74.6 23.3 36.5<br />
Median monthly rent paid ($) 429 494 708 321 412 467 372<br />
Median value of house ($) 203,213 86,418 179,286 29,670 124,400 4,968 28,676<br />
Source: U.S. Census of Population and Housing; Various reports from Insular Areas and the United States Bureau of the Census.<br />
Central Statistics Division, Department of Commerce