169. Aerial Wildlife Survey of the Edehzhie Candidate Protected ...
169. Aerial Wildlife Survey of the Edehzhie Candidate Protected ...
169. Aerial Wildlife Survey of the Edehzhie Candidate Protected ...

You also want an ePaper? Increase the reach of your titles
YUMPU automatically turns print PDFs into web optimized ePapers that Google loves.
AERIAL WILDLIFE SURVEY OF<br />
THE EDÉHZHÍE CANDIDATE PROTECTED<br />
AREA AND VICINITY, FEBRUARY 2003<br />
NICHOLAS C. LARTER 1 , DEBORAH JOHNSON 2 & DANNY G. ALLAIRE 1<br />
DEPARTMENT OF ENVIRONMENT & NATURAL RESOURCES<br />
GOVERNMENT OF THE NORTHWEST TERRITORIES<br />
FORT SIMPSON 1 , FORT SMITH 2 , NWT<br />
2006<br />
Manuscript Report No. 169<br />
The contents <strong>of</strong> this report are <strong>the</strong> sole responsibility <strong>of</strong> <strong>the</strong> authors
iii<br />
ABSTRACT<br />
We conducted an aerial wildlife survey <strong>of</strong> <strong>the</strong> Edéhzhíe candidate protected area and<br />
vicinity from 19-22 February, 2003. <strong>Survey</strong> legs <strong>of</strong> 4-5 hours duration were flown daily, with<br />
each leg being conducted in an area to <strong>the</strong> sou<strong>the</strong>ast <strong>of</strong> <strong>the</strong> previous one to maximize <strong>the</strong><br />
area <strong>of</strong> total coverage and minimize overlapping coverage. All flights originated from Fort<br />
Simpson. <strong>Survey</strong> conditions were exceptional with cold, clear wea<strong>the</strong>r following<br />
immediately after a new snow fall <strong>of</strong> 10-30cm. We observed 44 boreal caribou (Rangifer<br />
tarandus caribou), 63 moose (Alces alces), 13 bison (Bison bison athabascae), and 1<br />
wolverine (Gulo gulo) during <strong>the</strong> survey. Although caribou were observed in areas <strong>of</strong><br />
higher elevation, both on <strong>the</strong> Horn Plateau and hills/mountains in <strong>the</strong> Wrigley area, we<br />
observed fresh feeding craters and tracks north <strong>of</strong> Fort Simpson toward <strong>the</strong> Ebbutt Hills<br />
and 25km east <strong>of</strong> Jean Marie River, north <strong>of</strong> <strong>the</strong> Mackenzie River. Caribou, and fresh<br />
cratering by caribou, were located in areas both with and without a recent (1991-2000) fire<br />
history. Although caribou and <strong>the</strong>ir fresh cratering tended to be found in areas predicted<br />
to be <strong>of</strong> low and medium late winter occupancy by Gunn et al. (2004), <strong>the</strong> majority <strong>of</strong> <strong>the</strong><br />
survey was flown over areas predicted to be <strong>of</strong> low and medium caribou occupancy. Most<br />
moose were observed in lowlands surrounding <strong>the</strong> Horn Plateau to <strong>the</strong> south, north and<br />
west, and were most plentiful in burnt areas on <strong>the</strong> Laferte River. More moose were<br />
observed in <strong>the</strong> recently burned areas (1991-2000), and in areas predicted to have a<br />
medium or low level <strong>of</strong> occupancy <strong>of</strong> boreal caribou. Bison were observed on <strong>the</strong> east flank<br />
<strong>of</strong> <strong>the</strong> Horn Plateau and in <strong>the</strong> Mills Lake and Mink Lake areas. Fresh sign was seen as<br />
far north as <strong>the</strong> Horn River 35km NW <strong>of</strong> Fawn Lake (62 o 17'N x 117 o 55'W) and as far west<br />
along both <strong>the</strong> Laferte and Rabbitskin Rivers at Rabbitskin Lake (61 o 38'N x 119 o 20'W).<br />
This is <strong>the</strong> far<strong>the</strong>st west report for bison. Bison and fresh craters were found in areas that<br />
had burnt in <strong>the</strong> 1970's and in areas predicted to have a low level <strong>of</strong> boreal caribou<br />
occupancy. The wolverine was sighted on <strong>the</strong> Horn Plateau in an area that had not burnt<br />
since 1970.
v<br />
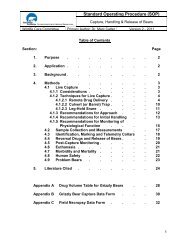
TABLE OF CONTENTS<br />
ABSTRACT .......................................................... iii<br />
TABLE OF CONTENTS ................................................ v<br />
LIST OF TABLES .................................................... vii<br />
LIST OF FIGURES .................................................... ix<br />
INTRODUCTION ..................................................... 1<br />
METHODS .......................................................... 5<br />
<strong>Survey</strong> Route Design ............................................ 5<br />
<strong>Survey</strong> Flights and Data Collection .................................. 5<br />
Post-survey Data Manipulation and Analysis ........................... 9<br />
RESULTS .......................................................... 11<br />
DISCUSSION ....................................................... 17<br />
RECOMMENDATIONS ............................................... 21<br />
ACKNOWLEDGMENTS ............................................... 23<br />
PERSONAL COMMUNICATIONS ....................................... 23<br />
LITERATURE CITED ................................................. 25<br />
APPENDIX 1 ........................................................ 27
vii<br />
LIST OF TABLES<br />
Table 1. Detailed descriptions <strong>of</strong> <strong>the</strong> 4 flight legs <strong>of</strong> <strong>the</strong> survey indicating <strong>the</strong> date, travel<br />
route, departure time, flight time (hours), wea<strong>the</strong>r at departure time, and flight<br />
distance (km) ................................................... 8
viii
ix<br />
LIST OF FIGURES<br />
Figure 1. The study area with <strong>the</strong> boundaries <strong>of</strong> Edéhzhíe candidate protected area<br />
indicated ............................................................ 2<br />
Figure 2. The flight routes for each <strong>of</strong> <strong>the</strong> 4 survey legs ....................... 6<br />
Figure 3. The observed distribution <strong>of</strong> wildlife species in relation to fire history ..... 13<br />
Figure 4. The observed distribution <strong>of</strong> wildlife species in relation to <strong>the</strong> predicted<br />
occupancy <strong>of</strong> boreal caribou based upon Gunn et al. (2004) .............. 14<br />
Figure 5. The observed distribution <strong>of</strong> fresh caribou and bison feeding craters in relation<br />
to fire history .................................................. 15<br />
Figure 6. The observed distribution <strong>of</strong> fresh caribou and bison feeding craters in relation<br />
to <strong>the</strong> predicted occupancy <strong>of</strong> boreal caribou based upon Gunn et al. (2004) . 16
1<br />
INTRODUCTION<br />
The Edéhzhíe candidate protected area covers some 25 000 km 2 north <strong>of</strong> <strong>the</strong><br />
Mackenzie River, west <strong>of</strong> Great Slave Lake, and is dominated by <strong>the</strong> Horn Plateau. This<br />
area has long been recognized for its ecological, and cultural importance and as a central<br />
First Nations’ spiritual ga<strong>the</strong>ring place. In March 2002, <strong>the</strong> Dehcho and Tlicho First Nations<br />
formally agreed to combine <strong>the</strong>ir efforts into legally protecting Edéhzhíe and in June 2002<br />
a five year land withdrawal was secured through <strong>the</strong> Northwest Territories <strong>Protected</strong> Areas<br />
Strategy (PAS) (Fig. 1). The area supports a variety <strong>of</strong> large mammal populations including<br />
moose (Alces alces), boreal caribou (Rangifer tarandus caribou), wood bison (Bison bison<br />
athabascae), and a variety <strong>of</strong> furbearers including marten (Martes americana), lynx (Lynx<br />
canadensis) and wolverine (Gulo gulo). In 2002, <strong>the</strong> Committee on <strong>the</strong> Status <strong>of</strong><br />
Endangered <strong>Wildlife</strong> in Canada (COSEWIC) designated boreal caribou and wood bison as<br />
threatened species and wolverine as a species <strong>of</strong> special concern. Under <strong>the</strong> PAS <strong>the</strong><br />
ecological resources <strong>of</strong> this area were to be fur<strong>the</strong>r assessed over <strong>the</strong> next 5 years starting<br />
in 2002.<br />
To assist in land use planning in <strong>the</strong> Dehcho, a previous study conducted jointly by<br />
<strong>the</strong> DFN and <strong>the</strong> Department <strong>of</strong> Resources, <strong>Wildlife</strong> & Economic Development (DRWED),<br />
Yellowknife, had been conducted to predict late winter occupancy <strong>of</strong> boreal caribou and<br />
map <strong>the</strong> late winter distribution <strong>of</strong> boreal caribou habitat in <strong>the</strong> Dehcho (Gunn et al. 2004).<br />
The results <strong>of</strong> this study were encouraging, however poor wea<strong>the</strong>r had limited <strong>the</strong> area <strong>of</strong><br />
<strong>the</strong> March 2002 survey creating a need to collect fur<strong>the</strong>r empirical data to delineate <strong>the</strong><br />
distribution <strong>of</strong> boreal caribou habitat and to better test <strong>the</strong> predictions <strong>of</strong> <strong>the</strong> boreal caribou<br />
occupancy model. Also, <strong>the</strong> nor<strong>the</strong>rn boundary <strong>of</strong> proposed Edéhzhíe candidate protected<br />
area had changed and now included new areas which had not been part <strong>of</strong> <strong>the</strong> study area<br />
when <strong>the</strong> previous study (Gunn et al. 2004) was conducted.<br />
This survey provided <strong>the</strong> opportunity to collect baseline information on mid-winter<br />
animal distribution <strong>of</strong> <strong>the</strong> Edéhzhíe candidate protected area and vicinity to assist in<br />
assessing <strong>the</strong> ecological resources <strong>of</strong> this newly proposed protected area. It also provided<br />
an opportunity to collect more empirical data that could be used to test <strong>the</strong> predictions <strong>of</strong><br />
and/or improve <strong>the</strong> predictability <strong>of</strong> <strong>the</strong> Dehcho boreal caribou late winter occupancy
Figure 1. The study area with <strong>the</strong> boundaries <strong>of</strong> Edéhzhíe candidate protected area indicated.<br />
2
3<br />
model. Although <strong>the</strong> survey was designed to assess <strong>the</strong> distribution <strong>of</strong> ungulates and large<br />
furbearers (e.g. wolverine) in <strong>the</strong> Edéhzhíe, it was tailored to optimize information<br />
collected on boreal caribou in order to validate and build upon previous boreal caribou work<br />
in <strong>the</strong> Dehcho, The survey was not designed to estimate animal numbers or density, but<br />
it was flown in such a manner where estimates could be generated. The survey was<br />
designed with 3 major objectives:<br />
1) To provide an opportunity for hunters/trappers from four Dehcho First Nations<br />
and biologists to participate toge<strong>the</strong>r in an aerial reconnaissance survey <strong>of</strong><br />
<strong>the</strong> Edéhzhíe and vicinity,<br />
2) To collect information on <strong>the</strong> mid-winter distribution <strong>of</strong> wildlife, particularly<br />
boreal caribou, moose, and wood bison, <strong>of</strong> <strong>the</strong> Edéhzhíe and vicinity,<br />
3) To collect empirical data that could be used to test and/or improve <strong>the</strong><br />
predictability <strong>of</strong> <strong>the</strong> boreal caribou late winter occupancy model by:<br />
a) flying areas <strong>of</strong> <strong>the</strong> Edéhzhíe and vicinity that were flown in previous<br />
surveys as well as areas that had not been flown in previous surveys<br />
and,<br />
b) flying areas <strong>of</strong> <strong>the</strong> Edéhzhíe and vicinity that were flown in previous<br />
surveys, but at a greater search intensity.
5<br />
METHODS<br />
<strong>Survey</strong> Route Design<br />
In a previous study (Gunn et al. 2004), <strong>the</strong> Dehcho was divided into 10 km X 10 km<br />
cells and aerial surveys were conducted over a representative samples <strong>of</strong> <strong>the</strong>se cells in<br />
March 2001 and 2002. Coverage during <strong>the</strong>se surveys had been standardized to<br />
approximately 10% as a single line, surveying a 1km wide swath <strong>of</strong> ground that was flown<br />
through <strong>the</strong> middle <strong>of</strong> <strong>the</strong> 10 km X 10 km survey cells. We used <strong>the</strong> same 10 km X 10 km<br />
cells to determine <strong>the</strong> survey routes for this study. We had been provided with <strong>the</strong> latitude<br />
and longitude <strong>of</strong> <strong>the</strong> centres <strong>of</strong> each <strong>of</strong> <strong>the</strong>se cells, <strong>the</strong> flight routes <strong>of</strong> <strong>the</strong> March 2002<br />
survey, <strong>the</strong> observational data from <strong>the</strong> March 2002 survey, and <strong>the</strong> predicted occupancy<br />
<strong>of</strong> caribou for each cell based upon <strong>the</strong> late winter caribou occupancy model (Gunn et al.<br />
2004). We used OziExplorer s<strong>of</strong>tware to assist in plotting flight routes (Fig. 2). These<br />
routes covered all representative areas <strong>of</strong> <strong>the</strong> study area, including areas not flown in <strong>the</strong><br />
previous survey, and were designed to provide empirical data that could test <strong>the</strong> robustness<br />
<strong>of</strong> <strong>the</strong> boreal caribou late winter occupancy model (Gunn et al. 2004). Specifically, some<br />
<strong>of</strong> our flight routes covered <strong>the</strong> same routes through low, medium, and high caribou<br />
occupancy areas as in <strong>the</strong> March 2002 survey. Also, we flew some <strong>of</strong> <strong>the</strong> medium and<br />
high caribou occupancy areas at 20% coverage i.e. having 2 flight lines per 10 km X 10 km<br />
survey cell. In total <strong>the</strong> survey covered 250 different 10 km X 10 km survey cells, 233<br />
different that had been delineated by Gunn et al. (2004). This broke down into 138 cells<br />
(55.2%) <strong>of</strong> predicted low caribou occupancy, 69 cells (27.6%) <strong>of</strong> predicted medium caribou<br />
occupancy, 26 (10.4%) <strong>of</strong> predicted high caribou occupancy, and 17cells (6.8%) which had<br />
not been included in <strong>the</strong> area used for <strong>the</strong> boreal caribou late winter occupancy model<br />
(Gunn et al. 2004).<br />
<strong>Survey</strong> Flights and Data Collection<br />
The survey was conducted using a Cessna 206 fixed-wing aircraft. The survey crew<br />
consisted <strong>of</strong> a pilot and local observer in <strong>the</strong> front seats, two observers (DJ and DGA) in<br />
<strong>the</strong> middle seats, and one recorder (NCL) in <strong>the</strong> rear seat. All occupants could<br />
communicate freely between each o<strong>the</strong>r using headsets with a live microphone.
Figure 2. The flight routes for each <strong>of</strong> <strong>the</strong> 4 survey legs.<br />
6
7<br />
For survey legs flown on 19 and 22 February <strong>the</strong> local observer was picked up and dropped<br />
<strong>of</strong>f en route from Wrigley and Jean Marie River, respectively. Transects were flown at 400<br />
feet (122 m) above ground level (agl) at an approximate speed <strong>of</strong> 160 km/h. Although a<br />
previous wildlife survey <strong>of</strong> <strong>the</strong> Dehcho had been conducted at 75m (Gunn et al. 2004), we<br />
increased <strong>the</strong> altitude agl to be more consistent with o<strong>the</strong>r surveys for boreal caribou<br />
elsewhere (Nagy, J. pers. comm.; Cross, D. pers. comm.; Hillis T. pers. comm.).<br />
Observations were made in a 500 m wide strip on each side <strong>of</strong> <strong>the</strong> aircraft. Tape marks<br />
were placed on <strong>the</strong> inside <strong>of</strong> <strong>the</strong> windows so <strong>the</strong> observers in <strong>the</strong> second row <strong>of</strong> <strong>the</strong> aircraft<br />
could delineate <strong>the</strong> transect boundaries (following Norton-Griffiths 1978). On 18 February<br />
<strong>the</strong> aircraft made passes over <strong>the</strong> airstrip at 400 feet agl to ensure that <strong>the</strong> 500 m transect<br />
widths had been calibrated correctly for both sides <strong>of</strong> <strong>the</strong> aircraft. Markers had previously<br />
been placed on <strong>the</strong> airstrip to indicate 500 m distances. Flights were generally conducted<br />
from mid-morning to mid-afternoon and were 4-5 h in length (Table 1). On 20 February we<br />
were delayed in leaving until almost noon because <strong>the</strong> temperature had not risen to <strong>the</strong><br />
required -37 o C until <strong>the</strong>n.<br />
The recorder used a handheld Garmin 12XL global positioning system (GPS) to<br />
record <strong>the</strong> locations <strong>of</strong> observed animals and assign a waypoint (WGS84 datum). The<br />
GPS was equipped with an external antenna which was positioned underneath <strong>the</strong> front<br />
window <strong>of</strong> <strong>the</strong> aircraft. Waypoints were also taken at <strong>the</strong> start and end <strong>of</strong> each flight leg;<br />
<strong>the</strong>se waypoints were used to determine flight time and flight distance. The GPS was also<br />
programmed to record locations for a flight track log every 20 s. Observation data were<br />
written directly onto datasheets during <strong>the</strong> flight, and included caribou feeding craters<br />
(ei<strong>the</strong>r fresh or old), caribou tracks (ei<strong>the</strong>r fresh or old), moose tracks (ei<strong>the</strong>r fresh or old),<br />
bison feeding craters (ei<strong>the</strong>r fresh or old), bison tracks (ei<strong>the</strong>r fresh or old), and observed<br />
animals. Observed animals were subdivided into calf and non-calf age classes with sex<br />
being recorded if possible. We also recorded whe<strong>the</strong>r observations were on <strong>the</strong> left or right<br />
side <strong>of</strong> <strong>the</strong> aircraft and whe<strong>the</strong>r on or <strong>of</strong>f transect. If craters and tracks were observed<br />
bisecting <strong>the</strong> flight line <strong>the</strong>y were recorded as being on both sides. At <strong>the</strong> completion <strong>of</strong><br />
each flight we downloaded both <strong>the</strong> waypoint and track files from <strong>the</strong> GPS into a laptop<br />
computer using OziExplorer s<strong>of</strong>tware.
8<br />
Table 1. Detailed descriptions <strong>of</strong> <strong>the</strong> 4 flight legs <strong>of</strong> <strong>the</strong> survey indicating <strong>the</strong> date, travel route, departure time, flight time<br />
(hours), wea<strong>the</strong>r at departure time (MST), and flight distance (km).<br />
Date<br />
Travel Route<br />
Departure<br />
Time<br />
Flight<br />
Time<br />
Departure Wea<strong>the</strong>r<br />
Flight<br />
Distance<br />
19 February Fort Simpson - Wrigley 0858 1.3H -35 o C, light cloud, calm 202<br />
19 February Wrigley - Wrigley 1053 3.8H -24 o C, clearing, NW 20km/h 613<br />
19 February Wrigley - Fort Simpson 1521 1.4H -24 o C, clear, W 10km/h 236<br />
20 February Fort Simpson - Fort Simpson 1154 3.9H -37 o C, clear, calm 631<br />
21 February Fort Simpson - Fort Simpson 1026 4.4H -35 o C, clear, calm 713<br />
22 February Fort Simpson - Jean Marie River 0955 0.5H -36 o C, clear, calm 61<br />
22 February Jean Marie River - Jean Marie River 1026 3.3H -36 o C, clear, calm 545<br />
22 February Jean Marie River - Fort Simpson 1347 0.6H n/a, clear, calm 83
9<br />
Post-survey Data Manipulation and Analysis<br />
For each survey leg we plotted <strong>the</strong> track files and waypoints. For <strong>the</strong> 6 instances<br />
where we had lost satellite coverage, we manually corrected <strong>the</strong> flight line by connecting<br />
<strong>the</strong> two points <strong>of</strong> <strong>the</strong> broken line using OziExplorer. All instances where <strong>the</strong> coverage was<br />
lost was minor and happened on straight sections <strong>of</strong> <strong>the</strong> transect; in one instance <strong>the</strong> lost<br />
line amounted to ca. 5 km in length all <strong>the</strong> o<strong>the</strong>rs were
11<br />
RESULTS<br />
Wea<strong>the</strong>r conditions, immediately prior to, and throughout <strong>the</strong> survey were ideal. A<br />
heavy snowstorm occurred throughout <strong>the</strong> region from 14-16 February, tapering <strong>of</strong>f on 15<br />
February and leaving 10-30cm <strong>of</strong> fresh snow. Hence fresh animal tracks observed on <strong>the</strong><br />
survey were from 2-5 days old. Following <strong>the</strong> snowstorm, a high pressure system moved<br />
into <strong>the</strong> region bringing with it low (-32 to -42 o C) temperatures and clear, cloudless skies.<br />
Conditions were ideal for making observations throughout <strong>the</strong> entire survey except for<br />
some minor turbulence and ice crystals around <strong>the</strong> Ebbutt Hills and crossing <strong>the</strong> Mt.<br />
Connell Range <strong>of</strong> <strong>the</strong> Franklin Mountains on <strong>the</strong> first day <strong>of</strong> <strong>the</strong> survey. Although <strong>the</strong>se<br />
were not ideal conditions, <strong>the</strong>y did not preclude observations <strong>of</strong> 1 km from <strong>the</strong> aircraft in<br />
any direction.<br />
We flew approximately 3100 km <strong>of</strong> survey lines over <strong>the</strong> 4 days. A total <strong>of</strong> 44 boreal<br />
caribou (on and <strong>of</strong>f transect), 63 moose (on and <strong>of</strong>f transect), 13 bison (on and <strong>of</strong>f<br />
transect), and 1 wolverine (on transect) were observed during <strong>the</strong> survey (Figs. 3 and 4).<br />
We observed a total <strong>of</strong> 132 fresh (2-5 day old) boreal caribou cratering sites, 82<br />
(62%) were located in areas that had not burnt since 1970, <strong>the</strong> remaining 50 (38%) were<br />
located in areas that had burnt since 1970 with 30 crater sites being located in areas that<br />
had burnt recently (1991-2000) (Fig. 5). Sixty-six <strong>of</strong> 132 fresh caribou cratering sites were<br />
located in areas predicted by <strong>the</strong> Gunn et al. (2004) model to have medium late winter<br />
caribou occupancy. The remaining 63 were located in areas predicted to have high (n=23)<br />
and low (n=40) late winter caribou occupancy (Fig. 6). Three crater sites were located out<br />
<strong>of</strong> <strong>the</strong> area where caribou occupancy had been modelled. We observed 44 adult caribou,<br />
29 (66%) located in areas unburnt since 1970, and 15 (34%) in areas that had burnt since<br />
1970; 5 were in recently (1991-2000) burnt areas (Fig. 3). Six <strong>of</strong> <strong>the</strong> 44 caribou (14%) were<br />
located in areas predicted to have high late winter caribou occupancy by <strong>the</strong> Gunn et al.<br />
(2004) model while 30 caribou (68%) were observed in areas predicted to have medium<br />
late winter caribou occupancy (Fig. 4). The remaining 8 caribou (18%) were observed in<br />
areas predicted to have low late winter caribou occupancy. We surveyed 233 blocks for<br />
which late winter caribou occupancy had been predicted; 138 blocks (59%) were predicted<br />
low caribou occupancy, 69 blocks (30%) were predicted medium caribou occupancy and
12<br />
26 blocks (11%) were predicted high caribou occupancy.<br />
Fresh (2-5 day old) bison cratering sites (n=3) and <strong>the</strong> 13 observed bison were<br />
located adjacent to or within areas that had burnt during <strong>the</strong> 1970's (Figs. 3 and 5). All 3<br />
crater sites and 11 <strong>of</strong> <strong>the</strong> 13 observed bison were located in areas predicted by <strong>the</strong> Gunn<br />
et al. (2004) model to have low late winter caribou occupancy (Fig. 6). The o<strong>the</strong>r 2 bison<br />
were observed in an area <strong>of</strong> predicted medium late winter caribou occupancy (Fig. 4).<br />
We observed 63 moose, 43 (68%) were located within areas that had burnt recently<br />
(1991-2000) with only 12 animals (32%) located in areas that had not burnt since 1970 (Fig.<br />
3). Only 2 <strong>of</strong> 58 moose were observed in areas predicted by Gunn et al. 2004 to have high<br />
late winter caribou occupancy. The majority (n=39) were located in areas predicted to have<br />
low late winter caribou occupancy (Fig. 4). We surveyed ca. 5 times more survey blocks<br />
predicted to have low late winter caribou occupancy than blocks predicted to have high<br />
caribou occupancy.
Figure 3. The observed distribution <strong>of</strong> wildlife species in relation to fire history.<br />
13
14<br />
Figure 4. The observed distribution <strong>of</strong> wildlife species in relation to <strong>the</strong> predicted occupancy <strong>of</strong> boreal caribou based upon<br />
Gunn et al. (2004).
Figure 5. The observed distribution <strong>of</strong> fresh (2-5 days old) caribou and bison feeding craters in relation to fire history.<br />
15
16<br />
Figure 6. The observed distribution <strong>of</strong> fresh (2-5 days old) caribou and bison feeding craters in relation to <strong>the</strong> predicted<br />
occupancy <strong>of</strong> boreal caribou based upon Gunn et al. (2004).
17<br />
DISCUSSION<br />
The relatively low snow depth and <strong>the</strong> ideal survey conditions make this an important<br />
baseline survey. It is likely that animal distribution was minimally affected by <strong>the</strong> snow<br />
depth and animals were wherever <strong>the</strong>y chose to be. Snow depth in winter 2002-03 was<br />
low and lower than in <strong>the</strong> previous winter (Environment Canada 2005), when <strong>the</strong> survey<br />
was conducted that fed into <strong>the</strong> boreal caribou occupancy model (Gunn et al. 2004). Snow<br />
depths most likely affected animal distribution by restricting <strong>the</strong> movements and<br />
distributions <strong>of</strong> those ungulates less capable <strong>of</strong> moving through deep snow in comparison<br />
to those ungulates more capable <strong>of</strong> moving through deeper snow.<br />
We observed an abundance <strong>of</strong> areas which were frequented by caribou during this<br />
survey in comparison to previous surveys. Ideal snow and survey conditions were<br />
undoubtably a factor; sightability was excellent, and low snow depth likely did not curtail<br />
animal movements and distribution. This survey included areas to <strong>the</strong> north which had not<br />
been flown in previous surveys and where boreal caribou were believed to frequent (K.<br />
Davidge pers. comm.). We observed fresh caribou signs in <strong>the</strong>se areas. We did not<br />
observe <strong>the</strong> majority <strong>of</strong> fresh caribou signs or animals in areas predicted by <strong>the</strong> caribou<br />
occupancy model to have high caribou occupancy, however <strong>the</strong> majority <strong>of</strong> <strong>the</strong> survey was<br />
flown over areas where late winter caribou occupancy was predicted to be medium (28%<br />
<strong>of</strong> <strong>the</strong> survey) or low (55% <strong>of</strong> <strong>the</strong> survey). Relative to <strong>the</strong> amount <strong>of</strong> survey coverage, <strong>the</strong><br />
number <strong>of</strong> caribou and fresh craters observed in areas predicted to be <strong>of</strong> low late winter<br />
caribou occupancy was generally consistent with model predictions.<br />
The caribou late winter occupancy model is based on 100 km 2 blocks <strong>of</strong> land and<br />
thus a fairly coarse scale, especially in relation to <strong>the</strong> habitat patchiness <strong>of</strong> <strong>the</strong> boreal forest<br />
in <strong>the</strong> Dehcho, which has been subjected to an active fire history (eg. Fig. 3). It is also<br />
based upon limited empirical data from flights that covered <strong>the</strong> entire area and only reflects<br />
data collected from one year. Consequently, it would not be unexpected for our<br />
observations <strong>of</strong> caribou and caribou activity to differ from those predicted by <strong>the</strong> model<br />
regardless <strong>of</strong> <strong>the</strong> proportions <strong>of</strong> late winter high, medium, and low predicted caribou<br />
occupancy blocks flown. Additional empirical data from aerial surveys and/or <strong>the</strong> locations<br />
<strong>of</strong> collared caribou are required to test <strong>the</strong> robustness <strong>of</strong> and to potentially refine this<br />
model. We plan on incorporating <strong>the</strong> observational data from this survey into <strong>the</strong> current
18<br />
caribou late winter occupancy model in hopes <strong>of</strong> improving its predictive capability.<br />
We anticipated finding more moose signs in areas with a more frequent burn history<br />
(burns < 20 years old), and caribou signs to be found in areas which hadn’t burned recently<br />
(in <strong>the</strong> last 30 years). Our observations are consistent with this (Figs. 3 and 5). The<br />
majority <strong>of</strong> moose were observed in areas that had burned since 1999, with only 12/63<br />
(19%) animals being observed in areas which had not burned since 1970. The majority<br />
(82/132) <strong>of</strong> fresh caribou cratering sites were located in areas which had not burned<br />
recently, but 30 sites were found in areas that had burned more recently, 1991-2000.<br />
Because approximately 40% <strong>of</strong> <strong>the</strong> survey was flown over areas that had burned from<br />
1991-2000 <strong>the</strong> number <strong>of</strong> fresh caribou cratering sites found in recently burned areas<br />
relative to less burned areas may be somewhat inflated.<br />
In general caribou and fresh caribou signs dominated <strong>the</strong> hills and higher elevations<br />
<strong>of</strong> <strong>the</strong> survey area, with moose and fresh moose signs dominating <strong>the</strong> lower elevations<br />
along water courses and <strong>the</strong> sou<strong>the</strong>rn face <strong>of</strong> <strong>the</strong> Horn Plateau which has had an active<br />
recent fire history and <strong>the</strong> high amount <strong>of</strong> blow down is only favourable to moose. Bison<br />
and fresh bison signs was limited to <strong>the</strong> eastern portions <strong>of</strong> <strong>the</strong> survey area and although<br />
most observations were found in <strong>the</strong> lower elevations <strong>the</strong>y were also found on <strong>the</strong> slopes<br />
<strong>of</strong> <strong>the</strong> eastern part <strong>of</strong> <strong>the</strong> Horn Plateau that were open and not heavily treed. In <strong>the</strong> lower<br />
elevations south <strong>of</strong> <strong>the</strong> Horn Plateau, east <strong>of</strong> <strong>the</strong> Rabbitskin River and north <strong>of</strong> <strong>the</strong><br />
Mackenzie River <strong>the</strong>re was an overlapping distribution <strong>of</strong> <strong>the</strong> three species.<br />
Our observation <strong>of</strong> wood bison signs on <strong>the</strong> Rabbitskin River in <strong>the</strong> vicinity <strong>of</strong><br />
Rabbitskin Lake (61 o 38'N x 119 o 20'W) is <strong>the</strong> most western report <strong>of</strong> wood bison. In recent<br />
years <strong>the</strong> core <strong>of</strong> <strong>the</strong> Mackenzie wood bison herd distribution has been shifting northward<br />
and westward (John Nishi pers. comm.; NCL, DJ pers. obs.). The extensive high water<br />
table throughout <strong>the</strong> Mackenzie Bison Sanctuary has reduced forage availability in <strong>the</strong><br />
meadows that were historically used by a large proportion <strong>of</strong> <strong>the</strong> bison population and has<br />
likely contributed to <strong>the</strong> changing bison distribution. Although a majority <strong>of</strong> <strong>the</strong> bison tracks<br />
we observed west <strong>of</strong> Mills Lake were likely made by individual or small groups <strong>of</strong> adult<br />
males at least one set <strong>of</strong> tracks was likely made by a group <strong>of</strong> mixed sex and age animals.<br />
Given <strong>the</strong> history <strong>of</strong> range expansion <strong>of</strong> <strong>the</strong> Mackenzie bison herd, once adult males begin<br />
to occupy areas, groups <strong>of</strong> mixed sex and age animals are likely to follow (Gates and Larter
1990; Larter et al. 2000).<br />
19
21<br />
RECOMMENDATIONS<br />
1) The observational data collected from this survey should be incorporated with <strong>the</strong><br />
previous data that were used to create <strong>the</strong> boreal caribou late winter occupancy<br />
model to test and enhance its predictions.<br />
2) Areas determined by this survey to be <strong>of</strong> high boreal caribou late winter occupancy<br />
should be visited during <strong>the</strong> summer if possible to investigate <strong>the</strong> habitat<br />
characteristics at a finer scale.<br />
3) Areas determined by this survey to be <strong>of</strong> high boreal caribou occupancy should be<br />
included in a list <strong>of</strong> potential sites for measuring winter snow severity throughout <strong>the</strong><br />
Northwest Territories.<br />
4) Data about moose presence from this survey should be incorporated into assisting<br />
with <strong>the</strong> stratification <strong>of</strong> various areas <strong>of</strong> <strong>the</strong> Dehcho into high and low moose<br />
density for future studies and surveys <strong>of</strong> moose in <strong>the</strong> Region.<br />
5) Data about bison presence should be incorporated into future work with <strong>the</strong><br />
Mackenzie Bison population pertaining to evaluating areas <strong>of</strong> known occupancy,<br />
winter distribution and range expansion to <strong>the</strong> west.
23<br />
ACKNOWLEDGMENTS<br />
We thank Anne Gunn for providing unpublished data from <strong>the</strong> Dehcho boreal caribou<br />
occupancy predictive model, which were key components used to determine our survey<br />
routes and design. Bruno Cr<strong>of</strong>t provided copies <strong>of</strong> both <strong>the</strong> digital and hard copy maps <strong>of</strong><br />
<strong>the</strong> Dehcho and Edéhzhíe. We would like to thank all <strong>of</strong> <strong>the</strong> staff <strong>of</strong> Wolverine Air for<br />
providing a well maintained aircraft for this work and especially thank Aaron Close for his<br />
excellent piloting which made this survey a success. We thank all <strong>of</strong> <strong>the</strong> observers who<br />
assisted with <strong>the</strong> survey: Raymond Pellissey (Pehdzeh Ki First Nation), Ronnie Antoine<br />
(Fort Simpson Métis Local), Peter Corneille (Liidlii Kue First Nation), and Douglas<br />
Norwegian Sr. (Jean Marie First Nation). Funding for this project came from RWED<br />
<strong>Protected</strong> Area Secretariat, RWED Dehcho and South Slave Regions.<br />
PERSONAL COMMUNICATIONS<br />
D. Cross, Resource Technician, Government <strong>of</strong> Manitoba, The Pas.<br />
K. Davidge, Renewable Resources Officer, Department <strong>of</strong> Environment & Natural<br />
Resources, Government <strong>of</strong> <strong>the</strong> Northwest Territories, Fort Simpson.<br />
T. Hillis, Climate Change Biologist, Department <strong>of</strong> Environment & Natural Resources,<br />
Government <strong>of</strong> <strong>the</strong> Northwest Territories, Yellowknife.<br />
J. Nagy, Senior <strong>Wildlife</strong> Researcher, Department <strong>of</strong> Environment & Natural Resources,<br />
Government <strong>of</strong> <strong>the</strong> Northwest Territories, Inuvik.<br />
J. Nishi, Bison Ecologist, Department <strong>of</strong> Environment & Natural Resources, Government<br />
<strong>of</strong> <strong>the</strong> Northwest Territories, Fort Smith.
25<br />
LITERATURE CITED<br />
Environment Canada. 2005. Online Climate Data, Fort Simpson, 2000-2005.<br />
http://www.climate.wea<strong>the</strong>r<strong>of</strong>fice.ec.gc.ca/climateData/canada_e.html<br />
Gates, C.C. and N.C. Larter. 1990. Growth and dispersal <strong>of</strong> an erupting large herbivore<br />
population in Nor<strong>the</strong>rn Canada: The Mackenzie Wood Bison (Bison bison<br />
athabascae). Arctic 43: 231-238.<br />
Gunn, A., Antoine, J., Boulanger, J., Bartlett, J., Cr<strong>of</strong>t, B. and D’Hont, A. 2004. Boreal<br />
caribou habitat and land use planning in <strong>the</strong> Deh Cho region, Northwest Territories.<br />
Manuscript Rep. No. 153, Dept. <strong>of</strong> Resources, <strong>Wildlife</strong> & Economic Development,<br />
Yellowknife, 48pp.<br />
Larter, N.C., Sinclair, A.R.E., Ellsworth, T., Nishi, J. and Gates, C.C. 2000. Dynamics <strong>of</strong><br />
reintroduction in an indigenous large ungulate: <strong>the</strong> wood bison <strong>of</strong> nor<strong>the</strong>rn Canada.<br />
Animal Conservation 4: 299-309.<br />
Norton-Griffiths, M. 1978. Counting animals. African <strong>Wildlife</strong> Leadership Foundation, Kenya<br />
139pp.
27<br />
APPENDIX 1<br />
A breakdown <strong>of</strong> <strong>the</strong> various observations recorded by survey leg.<br />
Leg 1 Leg 2 Leg 3 Leg 4<br />
Fresh Moose Tracks On Transect 35 21 96 50<br />
Fresh Moose Tracks Off Transect 0 0 0 0<br />
Old Moose Tracks On Transect 2 14 86 41<br />
Old Moose Tracks Off Transect 0 0 0 0<br />
Moose, non-calf, On Transect 8 11 21 9<br />
Moose, non-calf, Off Transect 0 3 5 1<br />
Moose calf On Transect 1 0 3 1<br />
Moose calf Off Transect 0 0 0 0<br />
Fresh Caribou Feeding Crater On Transect 43 51 18 13<br />
Fresh Caribou Feeding Crater Off Transect 0 5 2 0<br />
Old Caribou Feeding Crater On Transect 65 155 45 23<br />
Old Caribou Feeding Crater Off Transect 0 0 3 0<br />
Fresh Caribou Tracks On Transect 178 103 31 14<br />
Fresh Caribou Tracks Off Transect 0 0 0 0<br />
Old Caribou Tracks On Transect 8 0 0 0<br />
Old Caribou Tracks Off Transect 0 0 0 0<br />
Caribou, non-calf, On Transect 18 16 5 0<br />
Caribou, non-calf, Off Transect 0 5 0 0<br />
Caribou calf On Transect 0 0 0 0<br />
Caribou calf Off Transect 0 0 0 0<br />
Fresh Bison Feeding Crater On Transect 0 0 3 0<br />
Fresh Bison Feeding Crater Off Transect 0 0 0 0<br />
Old Bison Feeding Crater On Transect 0 0 0 0<br />
Old Bison Feeding Crater Off Transect<br />
0 0<br />
0<br />
0
28<br />
Appendix 1. cont.<br />
Fresh Bison Tracks On Transect 0 0 0 0<br />
Fresh Bison Tracks Off Transect 0 0 0 0<br />
Old Bison Tracks On Transect 0 0 5 107<br />
Old Bison Tracks Off Transect 0 0 0 1<br />
Bison, non-calf, On Transect 0 0 0 3<br />
Bison, non-calf, Off Transect 0 0 0 10<br />
Bison calf On Transect 0 0 0 0<br />
Bison calf Off Transect 0 0 0 0