DESeq for Alternative Splicing - Bioconductor
DESeq for Alternative Splicing - Bioconductor
DESeq for Alternative Splicing - Bioconductor

You also want an ePaper? Increase the reach of your titles
YUMPU automatically turns print PDFs into web optimized ePapers that Google loves.
<strong>DESeq</strong><br />
and<br />
ExonSeq<br />
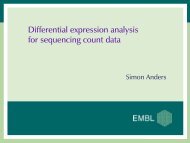
Simon Anders<br />
Coworkers: Alejandro Reyes, Wolfgang Huber
Two questions<br />
Assume you measure some quantity in different<br />
samples and/or conditions.<br />
Example here: concentration of a transcript in samples<br />
of extracted mRNA<br />
There are two different questions you may want to<br />
ask.
1. Given two samples, is the concentration of the<br />
transcript of interest different in the two samples<br />
You may say yes if the difference between the<br />
measured values is large compared to the accuracy of<br />
the measurement.
1. Given two samples, is the concentration of the<br />
transcript of interest different in the two samples<br />
You may say yes if the difference between the<br />
measured values is large compared to the accuracy of<br />
the measurement.<br />
2. Given samples from two conditions (treatment vs<br />
control), did the treatment cause a difference in<br />
transcript concentration<br />
You may say yes if the difference between the<br />
measured values is large compared to the typical<br />
variation of concentration between replicates.
In comparative RNA-Seq and ChIP-Seq,<br />
• the technical noise can be predicted from theory<br />
• the biological variation needs to be assessed by<br />
comparing replicates.<br />
Many currently available tools ignore this issue and so<br />
produce false positives.<br />
<strong>DESeq</strong> estimates biological variation properly and<br />
then tests <strong>for</strong> differential expression.<br />
(also: edgeR, BaySeq)
<strong>DESeq</strong><br />
comparison of<br />
two replicates<br />
comparison of<br />
treatment vs control
<strong>Alternative</strong> iso<strong>for</strong>m regulation<br />
Data: Brooks et al., Genome Res., 2010
Count table <strong>for</strong> a gene<br />
number of reads mapped to each exon (or part of exon) in gene msn:<br />
treated_1 treated_2 control_1 control_2<br />
E01 398 556 561 456<br />
E02 112 180 153 137<br />
E03 238 306 298 226<br />
E04 162 171 183 146<br />
E05 192 272 234 199<br />
E06 314 464 419 331<br />
E07 373 525 481 404<br />
E08 323 427 475 373<br />
E09 194 213 273 176<br />
E10 90 90 530 398