Speed Time Graphs
Speed Time Graphs
Speed Time Graphs

You also want an ePaper? Increase the reach of your titles
YUMPU automatically turns print PDFs into web optimized ePapers that Google loves.
Similar to Distance (d) vs <strong>Time</strong> (t) graphs, there are <strong>Speed</strong> (v) vs.<br />
<strong>Time</strong> (t)graphs used to represent the speed of an object. Plotting<br />
data on these graphs is very similar to plotting data on a position<br />
(d) vs time (t) graph.<br />
However the line/slope on<br />
a (v) vs (t) graph<br />
represents acceleration
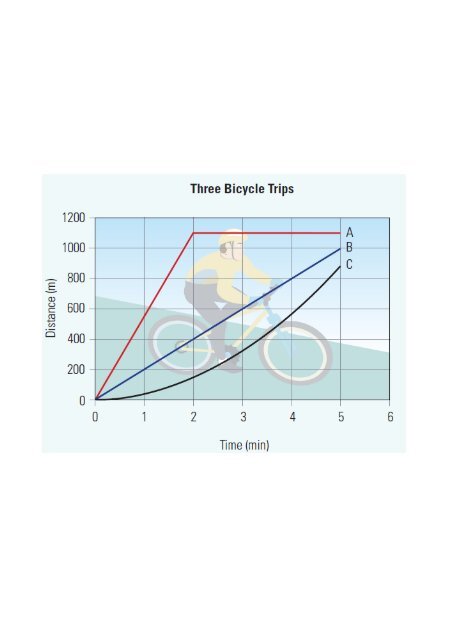
Describe the motion of the objects:
Describe the<br />
motion of the<br />
object:<br />
Which object has the greatest<br />
acceleration, the line<br />
represented in yellow or blue
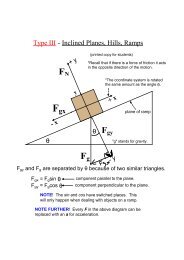
<strong>Speed</strong> <strong>Time</strong> <strong>Graphs</strong><br />
A speedtime graph can give you information about the<br />
acceleration of an object. You can find acceleration the<br />
same as finding velocity from a d t graph (find the slope)<br />
Velocity <strong>Time</strong> graphs also communicate information about<br />
the distance traveled by the object. The area between the<br />
graph and the timeaxis is the distance traveled. The next<br />
page shows that relationship through an example.
p. 393 #1, 4, 5, 11<br />
Analyzing Velocity <strong>Time</strong> Graph Example<br />
What is the acceleration during the first 10 seconds Final<br />
10 seconds<br />
Calculate the distance traveled during each time interval.<br />
Calculate the average velocity for the full 30 seconds.
Attachments<br />
Answers Extra Practice Acceleration WS.notebook<br />
answers acceleration worksheet.notebook