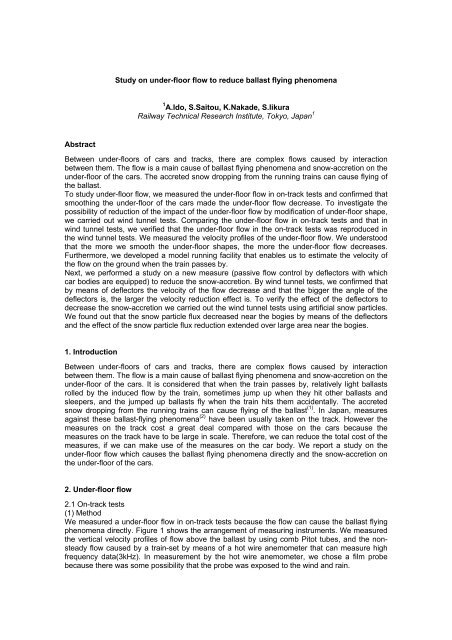
Study on under-floor flow to reduce ballast flying phenomena ... - UIC
Study on under-floor flow to reduce ballast flying phenomena ... - UIC
Study on under-floor flow to reduce ballast flying phenomena ... - UIC

You also want an ePaper? Increase the reach of your titles
YUMPU automatically turns print PDFs into web optimized ePapers that Google loves.
<str<strong>on</strong>g>Study</str<strong>on</strong>g> <strong>on</strong> <strong>under</strong>-<strong>floor</strong> <strong>flow</strong> <strong>to</strong> <strong>reduce</strong> <strong>ballast</strong> <strong>flying</strong> <strong>phenomena</strong><br />
1 A.Ido, S.Sai<strong>to</strong>u, K.Nakade, S.Iikura<br />
Railway Technical Research Institute, Tokyo, Japan 1<br />
Abstract<br />
Between <strong>under</strong>-<strong>floor</strong>s of cars and tracks, there are complex <strong>flow</strong>s caused by interacti<strong>on</strong><br />
between them. The <strong>flow</strong> is a main cause of <strong>ballast</strong> <strong>flying</strong> <strong>phenomena</strong> and snow-accreti<strong>on</strong> <strong>on</strong> the<br />
<strong>under</strong>-<strong>floor</strong> of the cars. The accreted snow dropping from the running trains can cause <strong>flying</strong> of<br />
the <strong>ballast</strong>.<br />
To study <strong>under</strong>-<strong>floor</strong> <strong>flow</strong>, we measured the <strong>under</strong>-<strong>floor</strong> <strong>flow</strong> in <strong>on</strong>-track tests and c<strong>on</strong>firmed that<br />
smoothing the <strong>under</strong>-<strong>floor</strong> of the cars made the <strong>under</strong>-<strong>floor</strong> <strong>flow</strong> decrease. To investigate the<br />
possibility of reducti<strong>on</strong> of the impact of the <strong>under</strong>-<strong>floor</strong> <strong>flow</strong> by modificati<strong>on</strong> of <strong>under</strong>-<strong>floor</strong> shape,<br />
we carried out wind tunnel tests. Comparing the <strong>under</strong>-<strong>floor</strong> <strong>flow</strong> in <strong>on</strong>-track tests and that in<br />
wind tunnel tests, we verified that the <strong>under</strong>-<strong>floor</strong> <strong>flow</strong> in the <strong>on</strong>-track tests was reproduced in<br />
the wind tunnel tests. We measured the velocity profiles of the <strong>under</strong>-<strong>floor</strong> <strong>flow</strong>. We <strong>under</strong>s<strong>to</strong>od<br />
that the more we smooth the <strong>under</strong>-<strong>floor</strong> shapes, the more the <strong>under</strong>-<strong>floor</strong> <strong>flow</strong> decreases.<br />
Furthermore, we developed a model running facility that enables us <strong>to</strong> estimate the velocity of<br />
the <strong>flow</strong> <strong>on</strong> the ground when the train passes by.<br />
Next, we performed a study <strong>on</strong> a new measure (passive <strong>flow</strong> c<strong>on</strong>trol by deflec<strong>to</strong>rs with which<br />
car bodies are equipped) <strong>to</strong> <strong>reduce</strong> the snow-accreti<strong>on</strong>. By wind tunnel tests, we c<strong>on</strong>firmed that<br />
by means of deflec<strong>to</strong>rs the velocity of the <strong>flow</strong> decrease and that the bigger the angle of the<br />
deflec<strong>to</strong>rs is, the larger the velocity reducti<strong>on</strong> effect is. To verify the effect of the deflec<strong>to</strong>rs <strong>to</strong><br />
decrease the snow-accreti<strong>on</strong> we carried out the wind tunnel tests using artificial snow particles.<br />
We found out that the snow particle flux decreased near the bogies by means of the deflec<strong>to</strong>rs<br />
and the effect of the snow particle flux reducti<strong>on</strong> extended over large area near the bogies.<br />
1. Introducti<strong>on</strong><br />
Between <strong>under</strong>-<strong>floor</strong>s of cars and tracks, there are complex <strong>flow</strong>s caused by interacti<strong>on</strong><br />
between them. The <strong>flow</strong> is a main cause of <strong>ballast</strong> <strong>flying</strong> <strong>phenomena</strong> and snow-accreti<strong>on</strong> <strong>on</strong> the<br />
<strong>under</strong>-<strong>floor</strong> of the cars. It is c<strong>on</strong>sidered that when the train passes by, relatively light <strong>ballast</strong>s<br />
rolled by the induced <strong>flow</strong> by the train, sometimes jump up when they hit other <strong>ballast</strong>s and<br />
sleepers, and the jumped up <strong>ballast</strong>s fly when the train hits them accidentally. The accreted<br />
snow dropping from the running trains can cause <strong>flying</strong> of the <strong>ballast</strong> (1) . In Japan, measures<br />
against these <strong>ballast</strong>-<strong>flying</strong> <strong>phenomena</strong> (2) have been usually taken <strong>on</strong> the track. However the<br />
measures <strong>on</strong> the track cost a great deal compared with those <strong>on</strong> the cars because the<br />
measures <strong>on</strong> the track have <strong>to</strong> be large in scale. Therefore, we can <strong>reduce</strong> the <strong>to</strong>tal cost of the<br />
measures, if we can make use of the measures <strong>on</strong> the car body. We report a study <strong>on</strong> the<br />
<strong>under</strong>-<strong>floor</strong> <strong>flow</strong> which causes the <strong>ballast</strong> <strong>flying</strong> <strong>phenomena</strong> directly and the snow-accreti<strong>on</strong> <strong>on</strong><br />
the <strong>under</strong>-<strong>floor</strong> of the cars.<br />
2. Under-<strong>floor</strong> <strong>flow</strong><br />
2.1 On-track tests<br />
(1) Method<br />
We measured a <strong>under</strong>-<strong>floor</strong> <strong>flow</strong> in <strong>on</strong>-track tests because the <strong>flow</strong> can cause the <strong>ballast</strong> <strong>flying</strong><br />
<strong>phenomena</strong> directly. Figure 1 shows the arrangement of measuring instruments. We measured<br />
the vertical velocity profiles of <strong>flow</strong> above the <strong>ballast</strong> by using comb Pi<strong>to</strong>t tubes, and the n<strong>on</strong>steady<br />
<strong>flow</strong> caused by a train-set by means of a hot wire anemometer that can measure high<br />
frequency data(3kHz). In measurement by the hot wire anemometer, we chose a film probe<br />
because there was some possibility that the probe was exposed <strong>to</strong> the wind and rain.
Figure 2 shows the <strong>under</strong>-<strong>floor</strong> shapes of the train-set of which we measured the <strong>flow</strong> in <strong>on</strong>track<br />
tests. In the figure, two types of <strong>under</strong>-<strong>floor</strong> shapes are indicated:<br />
Type1: Equipment covers<br />
Type2: Body mount<br />
The equipment covers are composed of flat plates <strong>to</strong> cover the <strong>under</strong>-<strong>floor</strong> equipment, and the<br />
body mount means the covers c<strong>on</strong>sisting of curved side surfaces and plane bot<strong>to</strong>m surfaces <strong>to</strong><br />
shroud the <strong>under</strong>-<strong>floor</strong> equipment.<br />
Hot wire anemometer<br />
Comb Pi<strong>to</strong>t tubes<br />
Rail<br />
Ballast<br />
Running directi<strong>on</strong><br />
Figure 1 Measurement of <strong>flow</strong> above the <strong>ballast</strong><br />
Type 1<br />
a<br />
b<br />
c<br />
a-a'<br />
b-b'<br />
c-c'<br />
a'<br />
b'<br />
c'<br />
Equipment covers<br />
Equipment covers<br />
Type 2<br />
Body mount<br />
Body mount<br />
Figure 2 Under-<strong>floor</strong> shape of the car<br />
(2) Results and discussi<strong>on</strong><br />
Figure 3 shows the velocity of the <strong>flow</strong> measured by the hot wire anemometer. By dividing the<br />
measured velocity by the train speed, we obtain the n<strong>on</strong>dimensi<strong>on</strong>al velocity. The <strong>flow</strong> was<br />
str<strong>on</strong>gly turbulent above the <strong>ballast</strong>s; therefore in order <strong>to</strong> analyze the <strong>flow</strong>, we averaged these<br />
data in the following way.<br />
- choose the data of the same series of the train-sets of nearly the same speed<br />
- average these train speeds<br />
- standardize the each train speed <strong>to</strong> the averaged speed<br />
- add all time series data<br />
- divide added time series data by the number of time series data<br />
Owing <strong>to</strong> the above menti<strong>on</strong>ed averaging method, it seems that we can <strong>reduce</strong> the signal noise<br />
and some comp<strong>on</strong>ents of the turbulent <strong>flow</strong> that was independent of the local <strong>under</strong>-<strong>floor</strong><br />
shapes like differences between bogies and other parts. When the train passed above the<br />
<strong>ballast</strong>, the velocity of the <strong>flow</strong> above the <strong>ballast</strong> increased gradually, reached roughly the<br />
c<strong>on</strong>stant value after the 3rd car passed, and became larger temporarily at a tail part. We<br />
<strong>under</strong>s<strong>to</strong>od that in both the Type1 and the Type2, the local <strong>under</strong>-<strong>floor</strong> shapes like differences<br />
between bogies and other parts did not affect the velocity of the <strong>flow</strong> above the <strong>ballast</strong> directly.<br />
The Figure 4 shows the vertical velocity profiles of the <strong>flow</strong> above the <strong>ballast</strong>. In the Figure 4,<br />
the distance from the <strong>ballast</strong> surface <strong>to</strong> each measurement points is plotted <strong>on</strong> the vertical axis.<br />
The velocity is the value averaged over the secti<strong>on</strong> between the 3rd car and the 15th car where<br />
the <strong>flow</strong> velocity is almost c<strong>on</strong>stant. The <strong>flow</strong> velocity of the Type2 is smaller than that of the
Type1. We <strong>under</strong>s<strong>to</strong>od that smoothing the <strong>under</strong>-<strong>floor</strong> of the cars decreased the velocity of the<br />
<strong>flow</strong> above the <strong>ballast</strong>.<br />
Head<br />
Running directi<strong>on</strong><br />
16cars<br />
Tail<br />
Velocity of the <strong>flow</strong><br />
Exp.1<br />
Exp.2<br />
Exp.3<br />
Average<br />
Type 1<br />
time<br />
Head<br />
Running directi<strong>on</strong><br />
16cars<br />
Tail<br />
Exp.1<br />
Velocity of the <strong>flow</strong><br />
Exp.2<br />
Exp.3<br />
Exp.4<br />
Average<br />
Type 2<br />
time<br />
Figure 3 Time series data measured by hot wire anemometer<br />
Figure 4 Velocity profiles of the <strong>flow</strong> above the <strong>ballast</strong>
2.2 Wind tunnel tests<br />
In the <strong>on</strong>-track tests, we c<strong>on</strong>firmed that the <strong>under</strong>-<strong>floor</strong> shapes of the cars influenced the <strong>flow</strong><br />
above the <strong>ballast</strong>. Then, we investigated the possibility of reducti<strong>on</strong> of the <strong>flow</strong> by modificati<strong>on</strong> of<br />
<strong>under</strong>-<strong>floor</strong> shape in the wind tunnel tests.<br />
(1) Method<br />
The wind tunnel tests were carried out by using a closed type test secti<strong>on</strong> of the Large-scale<br />
wind tunnel of Railway Technical Research Institute. The size of the test secti<strong>on</strong> is 5m wide, 3m<br />
high and 20m l<strong>on</strong>g. The wind velocity was 50m/s in the tests. In the research of the <strong>under</strong>-<strong>floor</strong><br />
<strong>flow</strong> of the cars by using the wind tunnel, it is very important <strong>to</strong> simulate the ground effect. So,<br />
we used the moving-belt and the boundary layer sucti<strong>on</strong> device <strong>to</strong> simulate the <strong>flow</strong> between<br />
the car models and the ground. The size of the moving-belt is 2.7m wide and 6m l<strong>on</strong>g. The<br />
speed of the moving belt is the same as the wind velocity.<br />
Figure 5 shows the arrangement of the models in the test secti<strong>on</strong> and measurement points of<br />
the <strong>under</strong>-<strong>floor</strong> <strong>flow</strong>. We used 1/7-scale car models c<strong>on</strong>sisting of three cars (representing head,<br />
intermediate and tail cars). The <strong>under</strong>-<strong>floor</strong> shapes are the same as those of the Type 2 (<strong>on</strong>track<br />
tests). When we adopt the car width as the representative length and the maximum train<br />
speed or the maximum velocity of wind tunnel tests as the representative velocity, the Reynolds<br />
number of the wind tunnel tests (Re=2×10 6 ) is smaller than that of the <strong>on</strong>-track tests (Re=2×10 7 )<br />
by a fac<strong>to</strong>r of 10. The blockage ratio is 1.5%. Since we cannot set the three cars <strong>on</strong> the<br />
moving-belt at the same time, we set the intermediate car <strong>on</strong> the center of the moving belt. We<br />
measured the velocity profiles of the <strong>under</strong>-<strong>floor</strong> <strong>flow</strong> of the intermediate car by using hot wire<br />
anemometers that was installed in a traverser mounted in the car model.<br />
Closed type test secti<strong>on</strong><br />
z<br />
y<br />
x<br />
Flow<br />
Head<br />
vehicle<br />
Intermediate<br />
vehicle<br />
Tail<br />
vehicle<br />
Boundary<br />
layer sucti<strong>on</strong><br />
Boundary<br />
layer sucti<strong>on</strong><br />
Details<br />
Moving belt<br />
Pre-load<br />
[unit:mm]<br />
Measurement points: m1 m2 m3 m4 m5 m1-m5<br />
Figure 5 Test secti<strong>on</strong> arrangements and velocity measurement points<br />
(2) Results and discussi<strong>on</strong><br />
Figure 6 shows the velocity profiles of the <strong>under</strong>-<strong>floor</strong> <strong>flow</strong> of the wind tunnel tests. In the wind<br />
tunnel tests fast <strong>flow</strong> means slow <strong>flow</strong> <strong>on</strong> the ground because we measured the velocity of the<br />
<strong>flow</strong> relative <strong>to</strong> the car in the wind tunnel tests. The <strong>flow</strong> velocity means n<strong>on</strong>dimensi<strong>on</strong>al velocity<br />
divided by the wind tunnel velocity. In the Figure 6, the distance from the car bot<strong>to</strong>m <strong>to</strong> the<br />
measurement points is plotted <strong>on</strong> the vertical axis and the bot<strong>to</strong>m of the axis indicates the
ground. We subtracted the result of the Type2 (<strong>on</strong>-track tests) from 1.0 and also illustrated it in<br />
Figure 6, where the measurement height of the <strong>on</strong>-track tests was scaled down <strong>to</strong> the model<br />
scale <strong>to</strong> compare the results of the wind tunnel tests with those of the <strong>on</strong>-track tests. Since<br />
Figure 6 shows that the velocity profiles in the <strong>on</strong>-track tests are similar <strong>to</strong> those in the wind<br />
tunnel tests near the bot<strong>to</strong>m range, though the velocity profiles have some variati<strong>on</strong>s according<br />
<strong>to</strong> the measurement points. We c<strong>on</strong>sider that the <strong>under</strong>-<strong>floor</strong> <strong>flow</strong> in the <strong>on</strong>-track tests was<br />
reproduced in the wind tunnel tests.<br />
To estimate the influence of smoothing the <strong>under</strong>-<strong>floor</strong> shapes <strong>on</strong> the <strong>under</strong>-<strong>floor</strong> <strong>flow</strong>, we<br />
changed the <strong>under</strong>-<strong>floor</strong> shapes and performed the wind tunnel tests. Figure 7 shows three<br />
types of the <strong>under</strong>-<strong>floor</strong> shapes of the car models.<br />
Type A: body mount<br />
Type B: body mount with fairings around bogies<br />
Type C: without bogies, with bogie skirts, and <strong>under</strong>-bogie flat covers<br />
Figure 8 shows that the <strong>flow</strong> velocity became faster in ascending order of the type A, type B,<br />
and type C. So, we <strong>under</strong>stand that the smoothing the <strong>under</strong>-<strong>floor</strong> shapes decreased the <strong>under</strong><strong>floor</strong><br />
<strong>flow</strong> which included the <strong>flow</strong> above the <strong>ballast</strong>.<br />
Figure 6 Velocity profile of the <strong>under</strong>-<strong>floor</strong> <strong>flow</strong>
Type A<br />
a<br />
b<br />
c<br />
a-a'<br />
b-b' c-c'<br />
a' b' c' Body mount<br />
Measurement point<br />
Body mount<br />
Measurement point<br />
Type B<br />
Fairing<br />
Bogie skirts<br />
Measurement point<br />
Bogie skirts<br />
Measurement point<br />
Type C<br />
No bogie<br />
Under-bogie covers<br />
Measurement point<br />
Measurement point<br />
Figure 7 Improvement around bogies and velocity measurement points<br />
Figure 8 Velocity profiles of the <strong>under</strong>-<strong>floor</strong> <strong>flow</strong><br />
2.3 Development of model running facility<br />
We <strong>under</strong>s<strong>to</strong>od that smoothing the <strong>under</strong>-<strong>floor</strong> shapes decreased the <strong>under</strong>-<strong>floor</strong> <strong>flow</strong> in the<br />
wind tunnel tests. However, in the wind tunnel tests, it is difficult <strong>to</strong> estimate the averaged<br />
velocity of the <strong>flow</strong> above the <strong>ballast</strong> when the train-set passes by, because in the wind tunnel<br />
tests the measurement points of the <strong>under</strong>-<strong>floor</strong> <strong>flow</strong> are fixed <strong>to</strong> the train and the velocity of the<br />
<strong>under</strong>-<strong>floor</strong> <strong>flow</strong> depends <strong>on</strong> the locati<strong>on</strong> of the measurement point. So we developed a model<br />
running facility that enables us <strong>to</strong> estimate the velocity of the <strong>flow</strong> <strong>on</strong> the ground when the trainset<br />
passes by.<br />
(1) Method<br />
We have <strong>to</strong> remove disturbance like a natural wind <strong>to</strong> estimate the velocity of the <strong>flow</strong> near the<br />
ground by means of the model running facility set outdoors, therefore it is desirable that it<br />
should be installed indoors. Meanwhile we need a space large enough in length and in cross<br />
secti<strong>on</strong> for models running. To meet these requirements, we installed the facility in the Towing
Wind Tunnel Facility (3) owned by Tohoku University. It has a large closed test secti<strong>on</strong>, 3.5m in<br />
width, 3.3m in height, and 500m l<strong>on</strong>g.<br />
Figure 9 shows the arrangement of the model running facility. The model scale is 1/8.4. The<br />
blockage ratio of secti<strong>on</strong>al area of model against that of test secti<strong>on</strong> is 1%. We used three car<br />
models (representing head, intermediate and tail cars). In the Towing Wind Tunnel Facility, we<br />
laid the tracks c<strong>on</strong>sisting of rails and sleepers for 200m, placed the three cars <strong>on</strong> it, and pulled<br />
them by an au<strong>to</strong>mobile. To avoid the influence of wake <strong>flow</strong> of the au<strong>to</strong>mobile, it ran outside the<br />
Towing Wind Tunnel Facility. We measured the velocity of the <strong>flow</strong> near the ground by means of<br />
a hotwire anemometer installed <strong>on</strong> the ground. The car models speed was 11m/s.<br />
Towing Wind Tunnel Facility (closed test secti<strong>on</strong>)<br />
Running directi<strong>on</strong><br />
Au<strong>to</strong>mobile<br />
Car models<br />
7.6m<br />
Break<br />
Measurement point of<br />
the velocity of the <strong>flow</strong><br />
Side View<br />
Towing Wind<br />
Tunnel Facility<br />
(closed test<br />
secti<strong>on</strong>)<br />
Track:200m<br />
Details<br />
Car models<br />
unit:[mm]<br />
Hot wire anemometer<br />
Secti<strong>on</strong>al View<br />
Figure 9 Arrangement of model running facility<br />
(2) Results and discussi<strong>on</strong><br />
Figure 10 shows the results of the velocity of the <strong>flow</strong> near the ground. We obtained the timeseries<br />
data which indicated that the velocity increases at the head part, keeps c<strong>on</strong>stant value at<br />
the intermediate part, and temporarily is more increased at the tail part, similarly <strong>to</strong> those<br />
obtained in the <strong>on</strong>-track tests. Hereafter, by using the developed model running facility, we are<br />
planning <strong>to</strong> study the <strong>under</strong>-<strong>floor</strong> <strong>flow</strong> more in detail.
Tail part<br />
Head part<br />
Figure 10 Time series data of the velocity of the <strong>flow</strong><br />
3. Snow-accreti<strong>on</strong><br />
Under the car body there are <strong>under</strong>-<strong>floor</strong> equipment boxes and bogies. Covering between<br />
<strong>under</strong>-<strong>floor</strong> equipment boxes can <strong>reduce</strong> the snow-accreti<strong>on</strong> <strong>to</strong> these boxes. However, it is<br />
difficult <strong>to</strong> attach covers <strong>to</strong> the bogies because of maintenance and displacement by running.<br />
Therefore, there is no effective countermeasure <strong>to</strong> <strong>reduce</strong> snow-accreti<strong>on</strong> <strong>to</strong> bogies at present.<br />
So, we performed a study <strong>on</strong> a new measure (passive <strong>flow</strong> c<strong>on</strong>trol by deflec<strong>to</strong>rs with which car<br />
bodies are equipped) because it can be an effective way <strong>to</strong> decrease the in<strong>flow</strong> of the snow <strong>to</strong><br />
the bogies for reducti<strong>on</strong> of the snow-accreti<strong>on</strong> <strong>to</strong> the bogies.<br />
(1) Method<br />
We performed wind tunnel tests by using the open type test secti<strong>on</strong> of small-scale wind tunnel<br />
of Railway Technical Research Institute. Figure 11 shows the arrangement of a test secti<strong>on</strong> and<br />
measurement points. The size of a nozzle secti<strong>on</strong> is 0.72m wide and 0.6m high. We used the<br />
boundary layer scoop, the boundary layer sucti<strong>on</strong> device and the moving-belt, <strong>to</strong> simulate the<br />
<strong>flow</strong> between car models and the ground. The size of the moving-belt is 0.35m wide and 1.075m<br />
l<strong>on</strong>g. The wind velocity was 10m/s in the tests. The speed of the moving belt was the same as<br />
the wind velocity. We used two c<strong>on</strong>venti<strong>on</strong>al cars, <strong>on</strong>e is an intermediate car with a dummy<br />
head part, and the other is a tail car. We measured the velocity profiles around bogies by using<br />
hot wire anemometers. As, it c<strong>on</strong>sidered that it will be effective for reducti<strong>on</strong> of snow-accreti<strong>on</strong><br />
<strong>to</strong> change the directi<strong>on</strong> of <strong>flow</strong> al<strong>on</strong>g the car side <strong>to</strong> the outside directi<strong>on</strong>, the shape of the<br />
deflec<strong>to</strong>r should be triangular prisms basically. We designed the two deflec<strong>to</strong>rs (Figure 11) that<br />
protruded from the car side. The length protruding from the <strong>under</strong>-<strong>floor</strong> equipment side was set<br />
at the maximum value within the rolling s<strong>to</strong>ck gauge. We measured the velocity of the <strong>flow</strong><br />
around bogies equipped with the deflec<strong>to</strong>rs. The measurement secti<strong>on</strong>s were at the fr<strong>on</strong>t axle<br />
and the center of the bogie, and the measurement height was at the center of the deflec<strong>to</strong>r.
Nozzle<br />
Collec<strong>to</strong>r<br />
Flow<br />
Car models<br />
Scoop<br />
Boundary<br />
layer sucti<strong>on</strong><br />
Details<br />
Moving belt<br />
Deflec<strong>to</strong>r<br />
Flow<br />
V50<br />
V10<br />
Measurement<br />
height<br />
Under-<strong>floor</strong><br />
equipment side<br />
Length from the equipment side<br />
Flow<br />
Angle of the<br />
deflec<strong>to</strong>r<br />
V50<br />
0<br />
V10<br />
Secti<strong>on</strong> 1 2<br />
50<br />
Distance from the<br />
car side (mm)<br />
Figure 11 Test secti<strong>on</strong> arrangement and measurement points<br />
(2) Results and discussi<strong>on</strong><br />
Figure 12 shows the velocity profiles near the bogies. The cases regarding the deflec<strong>to</strong>rs were<br />
those equipped with nothing, V10, and V50. In the Figure 12, the distance from the car side<br />
surface <strong>to</strong> the measurement points is plotted <strong>on</strong> the horiz<strong>on</strong>tal axis and “0mm” means at the car<br />
side surface. We focused <strong>on</strong> the area near the bogies (in the Figure 12 minus area <strong>on</strong> the<br />
horiz<strong>on</strong>tal axis) because our aim is reducti<strong>on</strong> of snow-accreti<strong>on</strong> <strong>to</strong> the bogies. We <strong>under</strong>s<strong>to</strong>od<br />
that by means of deflec<strong>to</strong>rs the velocity of the <strong>flow</strong> decreased. Comparing the V10 and V50<br />
deflec<strong>to</strong>rs, we <strong>under</strong>s<strong>to</strong>od that the V10 deflec<strong>to</strong>r decreased the velocity of the <strong>flow</strong> larger than<br />
V50 deflec<strong>to</strong>r.
Figure 12 Velocity of the <strong>flow</strong> near the bogies<br />
3.2 Wind tunnel tests using snow<br />
(1) Method<br />
We <strong>under</strong>s<strong>to</strong>od that the deflec<strong>to</strong>rs decrease the velocity of the <strong>flow</strong> near the bogies. However,<br />
we could not make sufficiently clear the relati<strong>on</strong>ship between the velocity of the <strong>flow</strong> and the<br />
snow particles. In short, it is not always evident that the reducti<strong>on</strong> of velocity <strong>reduce</strong>s the snowaccreti<strong>on</strong><br />
<strong>to</strong> the bogies. So <strong>to</strong> verify the effect of the deflec<strong>to</strong>rs <strong>to</strong> decrease the snow-accreti<strong>on</strong>,<br />
we carried out the wind tunnel tests using artificial snow particles.<br />
We used the wind tunnel (4) in a cold room in the Shinjo branch of Snow and Ice Research<br />
Center in Nati<strong>on</strong>al Research Institute for Earth Science and Disaster Preventi<strong>on</strong>. In the room<br />
there is a snowfall machine. We performed the wind tunnel tests using artificial snow made in<br />
the cold room and estimated the reducti<strong>on</strong> effect of the spatial density of the snow particles.<br />
Figure 13 shows arrangement of the wind tunnel tests. The car models c<strong>on</strong>sisted of the head<br />
car and the tail part and their scale was 1/7. The temperature of the cold room was -10C°. The<br />
wind speed in the wind tunnel tests was set at 10m/s. We used two SPC (Snow Particle<br />
Counter). The SPC is a measurement device that can count the number of the snow particles by<br />
each size. In the wind tunnel tests, we set these SPC at the upstream and downstream of the<br />
deflec<strong>to</strong>r. We measured supplied snow particle flux by the upstream SPC and snow particle flux<br />
<strong>flow</strong>ed in the bogies by the downstream SPC (Figure 13). Here, “the snow particle flux” means<br />
volume of snow particles passing per unit time and unit area. In the wind tunnel tests, we used<br />
the following three deflec<strong>to</strong>rs (Figure 14).<br />
Sd1: above-menti<strong>on</strong>ed shape (V10)<br />
Sd2: big equilateral triangular prisms<br />
Sd3: small equilateral triangular prisms<br />
Here, the maximum length from the <strong>under</strong>-<strong>floor</strong> equipment side of Sd2 is the same as that of<br />
Sd1, and double of that of Sd3.<br />
(2) Results and discussi<strong>on</strong><br />
In the wind tunnel tests the supplied snow particle flux is not always uniform. So we estimated<br />
the reducti<strong>on</strong> effect of the snow-accreti<strong>on</strong> of the deflec<strong>to</strong>r by means of the ratio of the<br />
downstream flux <strong>to</strong> the upstream flux. Figure 14 shows the results of the wind tunnel tests. As<br />
the base for comparis<strong>on</strong>, we have chosen the result of the case of no deflec<strong>to</strong>r. We found out<br />
that the snow particle flux decreased near the bogies by means of the deflec<strong>to</strong>rs. Comparing the<br />
result of Sd2 and that of Sd3, it was evident that when the length from the <strong>under</strong>-<strong>floor</strong><br />
equipment side is larger, the effect of the snow-accreti<strong>on</strong> reducti<strong>on</strong> becomes larger.
We thought that in the downstream end the effect of the snow-accreti<strong>on</strong> reducti<strong>on</strong> was the<br />
smallest and in the area of the upper stream and center of the bogies the effect is larger.<br />
Therefore we made clear that the effect of the snow particle flux reducti<strong>on</strong> extended over large<br />
area near the bogies.<br />
SPC<br />
Deflec<strong>to</strong>r<br />
SPC<br />
Flow with snow<br />
Figure 13 Arrangement of wind tunnel tests<br />
Snow particle flux reducti<strong>on</strong><br />
(no deflec<strong>to</strong>r = 1.0)<br />
1.2<br />
1.0<br />
0.8<br />
0.6<br />
0.4<br />
0.2<br />
0<br />
Deflec<strong>to</strong>r made by equilateral<br />
triangular prisms<br />
No Def. Sd3 Sd2 Sd1<br />
Figure 14 Snow-accreti<strong>on</strong> reducti<strong>on</strong><br />
4. C<strong>on</strong>clusi<strong>on</strong><br />
We studied the <strong>under</strong>-<strong>floor</strong> <strong>flow</strong> of the car that can cause the <strong>ballast</strong> <strong>flying</strong> <strong>phenomena</strong>. Firstly,<br />
<strong>to</strong> estimate the <strong>under</strong>-<strong>floor</strong> <strong>flow</strong> <strong>under</strong> actual c<strong>on</strong>diti<strong>on</strong>s, we measured the <strong>under</strong>-<strong>floor</strong> <strong>flow</strong> in <strong>on</strong>track<br />
tests. To measure the <strong>flow</strong>, we used comb Pi<strong>to</strong>t tubes and a hot wire anemometer. The<br />
test result showed that smoothing the <strong>under</strong>-<strong>floor</strong> of the cars <strong>reduce</strong>d the <strong>under</strong>-<strong>floor</strong> <strong>flow</strong>.<br />
Sec<strong>on</strong>dly, <strong>to</strong> investigate the possibility of reducti<strong>on</strong> of the <strong>under</strong>-<strong>floor</strong> <strong>flow</strong> by modificati<strong>on</strong> of<br />
<strong>under</strong>-<strong>floor</strong> shape, we carried out wind tunnel tests by using a closed type test secti<strong>on</strong> of the<br />
Large-scale wind tunnel that has the moving-belt and the boundary layer sucti<strong>on</strong> device <strong>to</strong><br />
simulate the <strong>flow</strong> between car models and the ground. Comparing the <strong>under</strong>-<strong>floor</strong> <strong>flow</strong> in the <strong>on</strong>track<br />
tests and that in wind tunnel tests, we verified that the <strong>under</strong>-<strong>floor</strong> <strong>flow</strong> in the <strong>on</strong>-track tests<br />
was reproduced in the wind tunnel tests. We measured the velocity profiles of the <strong>under</strong>-<strong>floor</strong><br />
<strong>flow</strong> of the intermediate car by using hot wire anemometers. We <strong>under</strong>s<strong>to</strong>od that the more we<br />
smooth the <strong>under</strong>-<strong>floor</strong> shapes, the more the <strong>under</strong>-<strong>floor</strong> <strong>flow</strong> decreases. Furthermore, we<br />
developed a model running facility that enables us <strong>to</strong> estimate the velocity of the <strong>flow</strong> <strong>on</strong> the<br />
ground when the train passes by.
Next, we performed a study <strong>on</strong> a new measure (passive <strong>flow</strong> c<strong>on</strong>trol by deflec<strong>to</strong>rs with which<br />
car bodies are equipped) <strong>to</strong> <strong>reduce</strong> the snow-accreti<strong>on</strong>. It is an effective way <strong>to</strong> decrease the<br />
in<strong>flow</strong> of the snow <strong>to</strong> the bogies for reducti<strong>on</strong> of the snow-accreti<strong>on</strong> <strong>to</strong> the bogies. We performed<br />
wind tunnel tests by using the open type test secti<strong>on</strong> of small-scale wind tunnel equipped with<br />
boundary layer scoop, boundary layer sucti<strong>on</strong> device, and moving-belt <strong>to</strong> simulate the <strong>under</strong><strong>floor</strong><br />
<strong>flow</strong>. We c<strong>on</strong>firmed that by means of deflec<strong>to</strong>rs the velocity of the <strong>flow</strong> decreased and that<br />
the bigger the angle of the deflec<strong>to</strong>rs is, the larger the velocity reducti<strong>on</strong> effect is. Next, <strong>to</strong> verify<br />
the effect of the deflec<strong>to</strong>rs <strong>to</strong> decrease the snow-accreti<strong>on</strong> we carried out the wind tunnel tests<br />
using artificial snow particles. We found out that the snow particle flux decreased near the<br />
bogies by means of the deflec<strong>to</strong>rs and that the effect of the snow particle flux reducti<strong>on</strong><br />
extended over large area near the bogies.<br />
References<br />
[1] K. Kawashima, S. Iikura, T.Endo, T.Fujii. “Experimental Studies <strong>on</strong> Ballast-Flying<br />
Phenomen<strong>on</strong> Caused by Dropping of Accreted Snow/Ice from High-Speed Trains”, RTRI<br />
REPORT (in Japanese), Vol.17, No.8, pp. 31-36, (2003).<br />
[2] M. Yoshida, M. Uchida, N.Yaguchi, N.Mifune. “Countermeasures for Ballast-Flying<br />
Phenomena by High-Speed Trains”, RTRI REPORT (in Japanese), Vol.6, No.6, pp. 27-36,<br />
(1992).<br />
[3] Yoshioka, S., Kohama, Y., Ka<strong>to</strong>, T., Ohta, F. Tokuyama, M. and Kikuchi, S., “Measurement<br />
of Boundary-layer Transiti<strong>on</strong> by Towing Wind Tunnel”, 21st Internati<strong>on</strong>al C<strong>on</strong>gress <strong>on</strong><br />
Instrumentati<strong>on</strong> in Aerospace Simulati<strong>on</strong> Facilities, ICIASF'05 Record CD-ROM, pp. 234-<br />
237, (2005).<br />
[4] T.Sa<strong>to</strong>, K.Kosugi, A.Sa<strong>to</strong>. “Wind tunnel experiments of drifting snow using snow particles”,<br />
Proceedings of '99 cold regi<strong>on</strong> technology c<strong>on</strong>ference (in Japanese), Vol.15, pp50~54,<br />
(1999).