annual report 2005 - Pumpkin Patch investor relations
annual report 2005 - Pumpkin Patch investor relations
annual report 2005 - Pumpkin Patch investor relations

You also want an ePaper? Increase the reach of your titles
YUMPU automatically turns print PDFs into web optimized ePapers that Google loves.
<strong>Pumpkin</strong> <strong>Patch</strong> Limited & Subsidiaries notes to and forming part of the financial statements<br />
for the 12 months ended 31 July <strong>2005</strong><br />
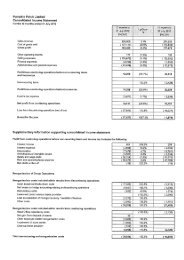
23. comparison against prospectus forecast<br />
Summary Statement of Financial Performance for the year ended 31 July <strong>2005</strong><br />
Actual <strong>2005</strong><br />
$000<br />
Forecast <strong>2005</strong><br />
$000<br />
Operating revenue 280,378 246,774<br />
Group earnings before interest and tax 36,357 23,035<br />
Net profit after income tax 24,599 15,331<br />
• Operating revenue was higher than forecast due to sales growth across United Kingdom and Australian stores, and<br />
wholesale accounts.<br />
• EBIT was higher than forecast due to the above noted sales growth and improved sales margins.<br />
Summary Statement of Financial Position as at 31 July <strong>2005</strong><br />
Actual<br />
<strong>2005</strong><br />
$000<br />
Forecast<br />
<strong>2005</strong><br />
$000<br />
Current assets 72,070 67,137<br />
Non-current assets 39,269 27,811<br />
Total Assets 111,339 94,948<br />
Other current liabilities 25,722 15,525<br />
Non-current liabilities 3,360 1,913<br />
Total Liabilities 29,082 17,438<br />
Net Assets 82,257 77,510<br />
Represented by:<br />
Share capital 56,134 60,620<br />
Retained earnings 26,123 16,890<br />
Total Equity 82,257 77,510<br />
• Share capital is lower than forecast due to the lower carried forward balance from 2004 resulting from the<br />
forecasted final price on listing in 2004 being $1.25 compared to the forecasted $1.32, and total issue costs<br />
being higher than forecasted.<br />
• Current assets includes higher than forecasted inventory levels resulting from increased purchases for the higher than<br />
forecasted number of stores and increased wholesale account activity. Higher than forecasted wholesale sales has<br />
also led to higher than forecasted trade debtors.<br />
• Non current assets are higher than forecast due to an increase in fixed assets resulting from the opening of more<br />
stores than forecasted for 2004 and <strong>2005</strong>.<br />
• Other current liabilities are higher than forecast due to increased accounts payable resulting from increased stock<br />
and general expense purchases for the larger than forecasted retail and wholesale operations.<br />
48