2004 Salary Recommendation - Arizona Human Resources
2004 Salary Recommendation - Arizona Human Resources
2004 Salary Recommendation - Arizona Human Resources

Create successful ePaper yourself
Turn your PDF publications into a flip-book with our unique Google optimized e-Paper software.
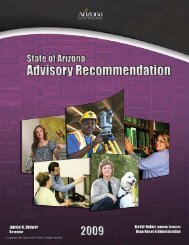
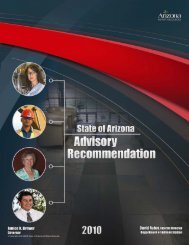
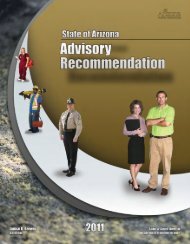
State of <strong>Arizona</strong><br />
Janet Napolitano<br />
Governor of <strong>Arizona</strong><br />
Betsey Bayless<br />
Director, Department of Administration<br />
<strong>Arizona</strong> Department of Administration<br />
HUMAN RESOURCES SYSTEM<br />
<strong>2004</strong><br />
ADVISORY RECOMMENDATION
BETSEY BAYLESS<br />
DIRECTOR<br />
ARIZONA DEPARTMENT OF ADMINISTRATION<br />
September, <strong>2004</strong><br />
The Honorable Janet Napolitano<br />
Governor, State of <strong>Arizona</strong><br />
The Honorable Ken Bennett<br />
President, <strong>Arizona</strong> State Senate<br />
The Honorable Franklin “Jake” Flake<br />
Speaker, <strong>Arizona</strong> House of Representatives<br />
1700 West Washington<br />
Phoenix, <strong>Arizona</strong> 85007<br />
Dear Governor Napolitano, President Bennett and Speaker Flake:<br />
It is my pleasure to share with you the <strong>2004</strong> Annual Advisory <strong>Recommendation</strong> on the salaries<br />
of our State employees.<br />
On behalf of all state employees, we recognize and sincerely appreciate the efforts of the<br />
Governor and the Legislature to provide funding for salary adjustments during recent years.<br />
These increases were desperately needed. The General <strong>Salary</strong> Adjustment of $1,000, effective<br />
July 1, <strong>2004</strong>, helped prevent further deterioration of the state’s relative market position.<br />
Our need to attract and retain professional, highly trained employees remains a paramount<br />
concern. In spite of recent salary adjustments, state salaries are still considerably behind the<br />
market; in this report you’ll find our employees are 20% behind the <strong>Arizona</strong> market and 26%<br />
behind the Western States. As a result, many of our best state employees continue to be drawn<br />
to other employers.<br />
The State continues to face financial difficulties; however, we must establish State employee<br />
pay as a priority. We must begin to close the gap between our salaries and the market to avoid<br />
severe negative implications on our ability to deliver even the most basic of State government<br />
services.<br />
We hope that the Annual Advisory <strong>Recommendation</strong> will provide the information you need when<br />
making decisions regarding <strong>Arizona</strong> State government and its employees’ compensation.<br />
Very truly yours,<br />
Betsey Bayless<br />
Director<br />
100 NORTH FIFTEENTH AVENUE, SUITE 401 PHOENIX, ARIZONA 85007 PHONE (602) 542-1500 FAX (602) 542-2199
ARIZONA DEPARTMENT OF ADMINISTRATION<br />
<strong>2004</strong> ANNUAL ADVISORY RECOMMENDATION<br />
The <strong>Arizona</strong> Department of Administration (ADOA) <strong>Human</strong> <strong>Resources</strong> System has a<br />
responsibility to recipients of state government services to delivery high quality, timely services.<br />
Lack of adequate pay for ADOA <strong>Human</strong> <strong>Resources</strong> System employees leads to high turnover<br />
and an inability to attract sufficient qualified candidates and retain talent. The result is that<br />
services, quality and timeliness are hampered by staff shortages and the need to continually<br />
hire and train new staff.<br />
As the largest employer in the State, and as a public employer, ADOA has an obligation to the<br />
taxpayers to recruit and retain an effective, productive, efficient and stable workforce. It is<br />
important to pay employees competitively, to respect the talents brought to our organization,<br />
and to recognize and reward results and accomplishments.<br />
The salary adjustments appropriated for the ADOA <strong>Human</strong> <strong>Resources</strong> System have not allowed<br />
the state to reach or to keep pace with compensation paid in the labor market. Regardless of<br />
whether ADOA <strong>Human</strong> <strong>Resources</strong> System salaries are measured against local, regional, public<br />
or private entities, they are not competitive. This report describes the wide and growing gap<br />
between the compensation of ADOA <strong>Human</strong> <strong>Resources</strong> System employees and that paid by<br />
other employers, and the overall impact.<br />
STATUS OF CURRENT COMPENSATION<br />
There are currently 30,831 covered state employees in the ADOA Personnel System. The<br />
average salary for covered state employees is $32,013.<br />
To stay abreast of what the competition is paying for similar type jobs/classes, ADOA conducts<br />
and participates in a number of salary surveys. The primary sources used for salary<br />
comparisons include the <strong>Arizona</strong> Compensation Survey (ACS), formerly Joint Governmental<br />
<strong>Salary</strong> Survey (JGSS) and the Western States <strong>Salary</strong> Survey.<br />
<strong>Arizona</strong> Compensation Survey<br />
In March <strong>2004</strong>, 172 public and private companies located in the state of <strong>Arizona</strong> participated in<br />
the ACS, covering 127 benchmark jobs representing over 220,000 employees. The survey<br />
indicated the following:<br />
• Average salaries of state employees are 20.4% lower than public and private employers<br />
located in the state of <strong>Arizona</strong>. In 2003, the difference was 19.0%.<br />
• Average salaries of state employees are 24.9% lower than public employers located in<br />
the state of <strong>Arizona</strong>. Public employers located in the state of <strong>Arizona</strong> included the cities<br />
of Casa Grande, Chandler, Coolidge, Cottonwood, Flagstaff, Fountain Hills, Glendale,<br />
Globe, Lake Havasu, Marana, Phoenix, Prescott, Prescott Valley, Scottsdale, Sierra<br />
Vista, Surprise, Tucson, Wickenburg, Winslow and Yuma. Counties included are<br />
Cochise, Coconino, Maricopa, Mohave, Pima, Pinal and Yuma.<br />
1
• Average salaries of state employees are 35% lower than the public employers located in<br />
Maricopa County. Public employers located in Maricopa County included Scottsdale,<br />
Glendale, Fountain Hills, Chandler, Surprise and Phoenix.<br />
Western States Survey<br />
In March <strong>2004</strong>, 26 public employers participated in the Western States <strong>Salary</strong> Survey, covering<br />
139 benchmark jobs representing over 80,000 employees in cities, counties and state<br />
governments located in the 12 western states. The survey indicated the following:<br />
• Average salaries of state employees are 25.9% lower than public employers located in<br />
the 12 western states. In 2003, the difference was 21.3%.<br />
Other Sources<br />
Other sources used in the review of the market position of state employee salaries include<br />
Central States Compensation Association survey, Eller College of Business and Bureau of<br />
Labor Statistics.<br />
According to the 2003 Central States Compensation Association survey (which includes all<br />
Western states except California), <strong>Arizona</strong>’s total compensation average is $44,301. Total<br />
compensation is defined as the total value of an employee’s direct and indirect compensation<br />
provided by the employer. The following chart, Figure 1, shows the specific comparisons from<br />
the survey:<br />
Figure 1 Total Compensation Comparison<br />
State<br />
Average<br />
<strong>Salary</strong><br />
Benefits<br />
Cost<br />
% of<br />
<strong>Salary</strong><br />
Total<br />
Compensation<br />
WISCONSIN $49,782 $18,103 36% $67,885<br />
ILLINOIS $46,276 $19,821 43% $66,097<br />
COLORADO $49,038 $13,723 28% $62,761<br />
IOWA $44,504 $17,978 40% $62,482<br />
MICHIGAN $43,994 $18,116 41% $62,110<br />
NEVADA $44,427 $17,286 39% $61,713<br />
MINNESOTA $45,372 $15,658 35% $61,030<br />
OREGON $40,692 $15,135 37% $55,827<br />
LOUISIANA $36,409 $18,165 50% $54,574<br />
IDAHO $38,728 $15,717 41% $54,445<br />
WYOMING $35,844 $15,430 43% $51,274<br />
UTAH $36,164 $13,195 36% $49,359<br />
NEW MEXICO $34,362 $14,488 42% $48,850<br />
TEXAS $34,173 $12,320 46% $46,493<br />
SOUTH DAKOTA $32,427 $13,898 43% $46,325<br />
NORTH DAKOTA $34,353 $11,348 33% $45,701<br />
MONTANA $32,167 $12,936 40% $45,103<br />
OKLAHOMA $32,695 $14,094 46% $45,065<br />
KANSAS $33,996 $10,328 30% $44,324<br />
NEBRASKA $32,384 $11,939 37% $44,323<br />
ARIZONA $31,859 $12,442 39% $44,301<br />
ARKANSAS $31,064 $12,610 41% $43,674<br />
MISSOURI $28,950 $13,639 47% $42,589<br />
INDIANA $28,553 $12,328 43% $40,881<br />
Average $37,426 $14,612 40% $51,966<br />
Source:<br />
2003 Central States Compensation Association Survey<br />
As can be seen in this table, <strong>Arizona</strong> ranks 21 st out of the 24 states responding.<br />
2
Further evidence of the low salaries that <strong>Arizona</strong> pays is shown in Figure 2 below. <strong>Arizona</strong> ranks<br />
49th in the nation in the ratio of total state payroll as compared to overall population of the state.<br />
Figure 2 Ratio of Total State Payroll to State Population<br />
1 ....................... Alaska<br />
2 ....................... Hawaii<br />
3 ....................... Delaware<br />
4 ....................... Connecticut<br />
5 ....................... Vermont<br />
6 ....................... New Jersey<br />
7 ....................... North Dakota<br />
8 ....................... Rhode Island<br />
9 ....................... New Mexico<br />
10 ..................... Washington<br />
11 ..................... Utah<br />
12 ..................... Wyoming<br />
13 ..................... Iowa<br />
14 ..................... Maryland<br />
15 ..................... Montana<br />
16 ..................... Alabama<br />
17 ..................... Louisiana<br />
18 ..................... Minnesota<br />
19 ..................... Kentucky<br />
20 ..................... Massachusetts<br />
21 ..................... Oklahoma<br />
22 ..................... Colorado<br />
23 ..................... Arkansas<br />
24 ..................... New York<br />
25 ..................... South Carolina<br />
26......................Maine<br />
27......................Virginia<br />
28......................West Virginia<br />
29......................Mississippi<br />
30......................Michigan<br />
31......................Nebraska<br />
32......................Kansas<br />
33......................Idaho<br />
34......................Oregon<br />
35......................North Carolina<br />
United States Average<br />
36......................New Hampshire<br />
37......................South Dakota<br />
38......................California<br />
39......................Wisconsin<br />
40......................Pennsylvania<br />
41......................Missouri<br />
42......................Indiana<br />
43......................Georgia<br />
44......................Illinois<br />
45......................Tennessee<br />
46......................Ohio<br />
47......................Texas<br />
48......................Nevada<br />
49.............. <strong>Arizona</strong><br />
50......................Florida<br />
Source: State Payroll data from U.S. Census Bureau, Governments Division. March 2002. Population data from<br />
U.S. Census Bureau, Population Division, estimates for July 1, 2002.<br />
As shown in Figure 3, State Employee <strong>Salary</strong> Comparison, the Average State Employee <strong>Salary</strong><br />
trend line continues to fall below all other <strong>Arizona</strong> market wage indicators.<br />
$40,000<br />
$38,000<br />
$36,000<br />
$34,000<br />
$32,000<br />
$30,000<br />
Figure 32<br />
State Employee <strong>Salary</strong> Comparison<br />
Average ACS <strong>Salary</strong><br />
Average Civilian Wage in <strong>Arizona</strong><br />
Average Worker in <strong>Arizona</strong><br />
Average State Employee <strong>Salary</strong><br />
$28,000<br />
$26,000<br />
$24,000<br />
$22,000<br />
1993 2002 2003 <strong>2004</strong><br />
Source: Average Civilian Wage in <strong>Arizona</strong>, Eller College of Business, March <strong>2004</strong>. 1<br />
Average Worker in <strong>Arizona</strong>, BLS, December 2003, aged 1%<br />
Average State Employee, HRIS, State of <strong>Arizona</strong>, June <strong>2004</strong><br />
Average ACS <strong>Salary</strong>, <strong>Arizona</strong> Compensation Survey, March <strong>2004</strong><br />
Eller College of Business figures include total <strong>Arizona</strong> non-agricultural workers. BLS figures include all types of employment for full- and parttime<br />
workers, including seasonal and temporary, in construction, manufacturing, retail, finance, transportation, government, and services in large<br />
<strong>Arizona</strong> cities. HRIS figures include covered, permanent full-time employees, ACS figures include selected benchmark positions.<br />
3
OUTLOOK OF THE MARKET<br />
The ability of an organization to attract and retain key personnel has never been more<br />
challenging. Research suggests the available labor pool will become sought after, and<br />
competition for the knowledge workers of the future will increase. It is critical to recognize that<br />
the labor market is not static, and efforts on the part of the State to become more competitive<br />
are counterbalanced by other employers’ efforts to do the same. Some key facts in this regard<br />
are listed below.<br />
• A projected shortage of 8 million workers by 2010. (Bureau of Labor Statistics)<br />
• The labor force will continue to age, with the number of workers in the 55-and-older<br />
group projected to grow by 49.3 percent, 4 times the 12-percent growth projected for the<br />
overall labor force. In 2012, youths, those between the ages of 16 and 24, will constitute<br />
15 percent of the labor force, and prime-age workers, those between the ages of 25 and<br />
54, will make up 66 percent of the labor force. The share of the 55-and-older age group<br />
will increase from 14.3 percent to 19.1 percent of the labor force. (Bureau of Labor<br />
Statistics)<br />
• With the improving economy, fewer companies at the national level (5 percent, down<br />
from 12 percent in 2003) report salary freezes this year. Similarly in <strong>Arizona</strong> fewer<br />
participants (5 compared with 14 in 2003) reported salary freezes. Projected salary<br />
increases are shown in Figure 4 below.<br />
Figure 4 Actual/Projected <strong>Salary</strong> Increases<br />
<strong>2004</strong> 2005<br />
Actual/Projected Projected<br />
% Increase % Increase<br />
National – Mercer 3.3 3.5<br />
National – Conference Board 3.5 3.5<br />
National – WorldatWork 3.5 3.7<br />
<strong>Arizona</strong> – Public 2.9 4.1<br />
<strong>Arizona</strong> – Private 4.0 4.2<br />
State of <strong>Arizona</strong> 3.1 <br />
Source: National Data from Mercer, WorldatWork, and Conference Board 2<br />
<strong>Arizona</strong> Data from <strong>Arizona</strong> Compensation Survey<br />
• The state implemented a $1,000 General <strong>Salary</strong> Adjustment (GSA) effective July 1,<br />
<strong>2004</strong>. The GSA should keep the state from falling even further behind other market<br />
indicators, although as can be seen by the advances made in other organizations, the<br />
State’s market position will not improve. The GSA represents an average of 3.1%, which<br />
is less than the predicted 3.4% overall increase in <strong>2004</strong> for <strong>Arizona</strong>.<br />
2 Mercer <strong>Human</strong> <strong>Resources</strong> Consulting, Inc. - international human resources consulting firm in compensation and benefits;<br />
provider of salary surveys, studies, and trend analysis for the private and public sectors. WorldatWork - world wide nonprofit<br />
association dedicated to compensation, benefits, total rewards, and HR professionals. Conference Board - nonprofit organization<br />
that creates and disseminates information about management and the marketplace to help businesses assess the current economic<br />
picture and intelligently forecast trends.<br />
4
IMPACT<br />
The lack of consistent, substantive funding for employee pay increases has had a significant<br />
impact on retention and the State’s classification/compensation system. Retention is the most<br />
immediate and direct consequence of inadequate funding of a compensation system. Less<br />
immediate, though no less significant is the gradual erosion of the systematic and<br />
comprehensive classification and compensation system.<br />
Retention<br />
The current separation rate for covered (merit system) employees is 14.9%. Of the 4,586<br />
covered employees leaving state service, 3,726 left voluntarily (81%). Figure 5 illustrates the<br />
seven year turnover trend.<br />
18%<br />
Figure 5<br />
Separation Rates of Covered Employees<br />
Average Annual Separation Rate<br />
16%<br />
14%<br />
12%<br />
10%<br />
1997 1998 1999 2000 2001 2002 2003 <strong>2004</strong><br />
Source: <strong>2004</strong> <strong>Arizona</strong> Department of Administration <strong>Human</strong><br />
<strong>Resources</strong> System Annual Report<br />
With the exception of 2002, the state’s turnover rate has held fairly steady around 15%. As can<br />
be seen from Figure 6 below, this rate of separation is higher than 80% of the other central<br />
states.<br />
5
State<br />
Figure 6 Separation Rate Comparison<br />
Statewide<br />
Total %<br />
Voluntary<br />
Resignations<br />
Involuntary<br />
Terminations<br />
Retirements<br />
MINNESOTA 4.74% 2.80% not reported not reported<br />
IOWA 6.34% 2.80% 1.67% 1.87%<br />
UTAH 9.26% 6.14% 1.06% 2.06%<br />
NEVADA 10.0% 8.5% 1.4% 2.5%<br />
MICHIGAN 10.30% not reported not reported not reported<br />
COLORADO 11.02% 6.15% 1.84% 3.03%<br />
MONTANA 11.37% 9.40% 31.00% 1.65%<br />
OKLAHOMA 12.0% 8.0% 2.0% 2.0%<br />
SOUTH DAKOTA 12.40% 8.50% 2.10% 1.40%<br />
WYOMING 12.40% not reported not reported not reported<br />
KANSAS 12.68% 8.57% 1.83% 2.00%<br />
IDAHO 13.00% not reported not reported 2.00%<br />
NEBRASKA 13.30% 8.90% 3.20% 1.20%<br />
OREGON 14.30% 4.70% 4.40% 5.20%<br />
NEW MEXICO 14.68% 6.98% 1.50% 1.85%<br />
TEXAS 14.80% 8.90% 3.45% 2.45%<br />
ARIZONA 14.90% 13.10% 2.10% 1.4%<br />
MISSOURI 16.00% 10.1% 14.8% 14.70%<br />
ARKANSAS 17.95% not reported not reported not reported<br />
ILLINOIS 28.40% 3.50% 7.30% 17.60%<br />
Average 12.99% 7.32% 5.31% 3.93%<br />
Source: 2003 Central States Compensation Association Survey<br />
Turnover rates from local municipalities also illustrate that <strong>Arizona</strong> has a significantly higher rate<br />
of separation than some of our neighboring public sector entities.<br />
Figure 7 Separation Rates of Nearby Municipalities<br />
Annual Separation Rates<br />
Tempe 4.8%<br />
Glendale 6.7%<br />
Scottsdale 7.3%<br />
Tucson 8.9%<br />
State of <strong>Arizona</strong> 14.9%<br />
Source: Personal contacts<br />
Over 43% of the state’s workforce has less than 4 years of experience working for the State; 4<br />
years is the point at which an employee could be considered to have reached "journey" level<br />
and is considered competent in the job. For those employees that do remain in state service, it<br />
currently takes an average of 10 years for an employee to reach the midpoint of their pay range.<br />
Other organizations typically move their employees up to the midpoint in 4 to 5 years.<br />
6
Currently over 50% of state employees are in the lowest quartile of their salary range and over<br />
80% are below the midpoint as illustrated below in Figure 8.<br />
Figure 8 Distribution of Covered Salaries within Their Range<br />
12%<br />
6%<br />
Midpoint – where a fully-qualified<br />
employee who meets all performance<br />
expectations could expect to be paid<br />
31%<br />
82% of employee salaries fall<br />
BELOW midpoint<br />
51%<br />
Source: The State’s <strong>Human</strong> <strong>Resources</strong> Information Solution (HRIS)<br />
These factors contribute to the agencies’ difficulties in retaining qualified employees. Below are<br />
actual examples of employees leaving State service and receiving higher salaries for similar<br />
type jobs/ classifications.<br />
• A Senior Resident Engineer was offered $12,000 more per year, $7,000 signing bonus<br />
and a vehicle. ADOT counter offered but could not match his external offer without<br />
exceeding the salaries of other more senior engineers.<br />
• A Resident Engineer left in May <strong>2004</strong> for a position with Federal Aviation Administration<br />
for $85,000 (a $25,000 increase).<br />
• A construction company hired a Highway Maintenance Tech I in Kingman in January<br />
<strong>2004</strong> at a 79% increase (went from $23,192 to $41,600).<br />
• Highway Maintenance Tech III, hired by a utility company in October 2003, went from<br />
$28,765 to $37,500.<br />
• <strong>Human</strong> <strong>Resources</strong> Analyst offered position with City of Phoenix in June <strong>2004</strong>, with an<br />
increase of more than 10% and an additional increase at 6 months.<br />
• Water Resource Engineer recruited by the City of Phoenix with a $4500 salary increase,<br />
and placed into a position with fewer responsibilities.<br />
• A former Correctional Registered Nurse wished to return to work with ADC but declined<br />
the offer because of a private sector offer of $80,000.<br />
Research suggests that employee turnover rates will increase as the economy recovers. The<br />
impact of turnover is significant, both directly and indirectly. Direct costs include what we spend<br />
on recruiting and training replacement workers. Indirect costs include lost productivity, lower<br />
morale among remaining employees who must absorb the workload of the employees who left<br />
state service, and customer dissatisfaction from dealing with new and inexperienced<br />
employees.<br />
7
Estimates of the total cost of losing a single person to turnover range from 30% of their yearly<br />
salary (Cornell University) to 150% as estimated by the Saratoga Institute, and independently by<br />
Hewitt Associates. Using the most conservative estimate of 30%, the financial impacts to the<br />
state are very significant. For example, the number of active, covered employees in FY04 was<br />
30,831, making an average salary of $32,000. Our current turnover rate of 14.9%, yielded 4,586<br />
separations for a total cost over $44 million. A reduction in the turnover rate of merely 1% would<br />
result in savings (cost avoidance) of $2.9 million.<br />
Erosion of the State’s Classification/Compensation System<br />
State agencies are constantly looking for ways to attract qualified candidates and retain<br />
experienced, knowledgeable employees. Consequently, we have turned to interim fixes that<br />
result in erosion of the State’s Classification/Compensation System. One of the results of these<br />
stop-gap measures is that only 30%, or less than 11,000 employees, are now paid under the<br />
original “regular salary schedule” (grades 1-30). The types of approaches the State has used<br />
over the years to assist in addressing the growing gap between compensation of employees in<br />
the ADOA Personnel System and that of other employers are illustrated below.<br />
• Positions have been uncovered. Over the past 7 years we have seen an increase of<br />
12% in the ratio of uncovered positions compared to covered positions.<br />
• Special Recruitment Rates are established higher than the grade minimums, and apply<br />
to all those hired into a class. Currently, there are 373 covered job codes (classifications)<br />
utilizing Special Recruitment Rates; this represents over 1/3 of the covered job codes.<br />
• Special Rates are established for classes when their ranges do not fit the regular salary<br />
grades 1-30, or for classes paid on an hourly, daily or per performance basis. There are<br />
61 Special Rates for covered classifications and 108 for uncovered.<br />
• Alternative <strong>Salary</strong> Plans are established based upon the prevailing practice in the<br />
marketplace, e.g., years of experience, examinations completed and passed. There are<br />
currently 30 covered job codes (classifications) in Alternative <strong>Salary</strong> Plans.<br />
• A Step and Grade Plan was established for the Correctional Officer II job code.<br />
• Youth Correctional Officers I receive a salary increase after 12 months of employment.<br />
• Youth Correctional Officers II receive increases at 12 and 24 months of service.<br />
• Teachers are placed in a matrix similar to those utilized by school districts, recognizing<br />
continuing educational achievements and service.<br />
• IT positions are paid under a broadband plan.<br />
• Engineers (registered) have a special pay schedule and may move through the<br />
schedule.<br />
• Non-registered technical engineering specialists have a special pay schedule and may<br />
move through the schedule.<br />
While these approaches have assisted in some areas and in some cases, it still remains a fact<br />
that the average salaries of state employees are significantly lower than other employers.<br />
8
RECOMMENDATIONS<br />
It is essential that State funding for employee salaries has the highest priority, particularly as the<br />
economy improves and job opportunities outside the State become more attractive. In past<br />
years, there has not been a sufficient investment in our employees; the most vital component<br />
that allows State programs to serve their intended purpose. In order to continue to provide<br />
quality service and programs that meet the needs of our constituents, adequate funding for the<br />
employees must be a priority.<br />
Improve the State’s Market Position<br />
Effective July 1, <strong>2004</strong>, a $1,000 General <strong>Salary</strong> Adjustment (GSA) was implemented. The GSA<br />
represents an average 3.1% increase in state employee salaries. Assuming the other employers<br />
provided increases at the same rate (as shown on Page 4), it is anticipated that state employee<br />
salaries will remain 20% behind the market in FY2005. In order to effect significant change in<br />
the salary deficit between state employee salaries and the market, it will be necessary to<br />
provide increases greater than that which other employers are providing. There are many<br />
strategies that could be implemented; below is one of the models presented in last year’s<br />
<strong>Recommendation</strong> that would allow us to significantly close the gap. Assuming employers<br />
continue to provide 3% increases each year, a 4.5% increase to state employee salaries would<br />
bring our salaries to within 14% of market by FY09.<br />
Increase % Increase<br />
FY 06 $ 59,853,366 4.5%<br />
FY 07 $ 62,546,767 4.5%<br />
FY 08 $ 65,361,372 4.5%<br />
FY 09 $ 68,302,633 4.5%<br />
$256,064,138 Total Projected Cost<br />
Move Employees Through the <strong>Salary</strong> Ranges<br />
Over 50% of state employees are in the lowest quartile of their salary range and over 80% are<br />
below the midpoint. There currently is no mechanism to provide increases in salary for<br />
individuals that would allow them to advance through their salary range. It is imperative that the<br />
State implement an approach to ensure employees progress through the salary ranges. A<br />
common strategy employed by many public sector organizations to address this issue is to<br />
design some form of steps or automatic progression plan.<br />
Examples of step plans currently utilized by other public organizations are summarized below:<br />
City of Tucson<br />
o 79% of their employees’ salaries are administered according to step plans.<br />
o Only non-exempt employees are in the step plan.<br />
o There are 11 grades, each having 14 steps.<br />
o Through step 6, each step represents a 2.5% increase; for step 7 and above the<br />
increase is 5.0%.<br />
9
Pinal County<br />
o Each non-exempt grade has 14 steps and there are 11 grades.<br />
o Salaries move one step at the employee’s anniversary date (assuming<br />
satisfactory performance) up to step 7, which is midpoint.<br />
o After step 7, movement is every 2 years.<br />
o Each step represents a 2.5% increase.<br />
State of Washington<br />
o Pay plan has 86 grades.<br />
o Each grade has 11 steps<br />
o One step averages a 2.3% increase in salary.<br />
o All “General Government” positions are administered by this plan.<br />
The combination of providing regular GSA’s and moving employees through the salary ranges<br />
would help address the gap even further than implementing salary increases alone. Many<br />
employees have an intangible need to know that there are opportunities for salary increases for<br />
remaining with the state and advancing their career.<br />
CONCLUSION<br />
The information that we have illustrated in this report is not new, nor is it information that has not<br />
been previously reported. Year after year, similar information is packaged and presented in our<br />
annual recommendation. Last year a 3% increase was provided for state employees which<br />
helped ensure that state employee salaries did not slip further behind the market. It is critical<br />
that we build upon this investment and begin to close the gap between our employees’ salaries<br />
and those offered by the market. It has never been more important for state government to<br />
provide quality service and programs that meet the needs of our constituents – and inspire their<br />
trust and confidence. Adequate funding for employees must be a priority in order to achieve that<br />
reality.<br />
10
<strong>Resources</strong><br />
The Conference Board<br />
www.conference-board.org<br />
U.S. Department of Labor, Bureau of Labor Statistics<br />
www.bls.gov<br />
Mercer <strong>Human</strong> <strong>Resources</strong> Consulting, Inc<br />
www.mercer.com<br />
University of <strong>Arizona</strong>, Eller College of Business<br />
www.bpa.arizona.edu<br />
WorldatWork<br />
www.worldatwork.org<br />
OTHER ARIZONA DEPARTMENT OF ADMINISTRATION RESOURCES<br />
<strong>Human</strong> <strong>Resources</strong> System Annual Report, <strong>2004</strong><br />
www.hr.state.az.us<br />
<strong>Salary</strong> Schedules for State Employees<br />
www.hr.state.az.us/Classcomp/index.htm<br />
Uncovered Positions and <strong>Salary</strong> Schedules<br />
www.hr.state.az.us/Classcomp/index.htm