Table of Contents - The Atmospheric Studies Group at TRC
Table of Contents - The Atmospheric Studies Group at TRC Table of Contents - The Atmospheric Studies Group at TRC
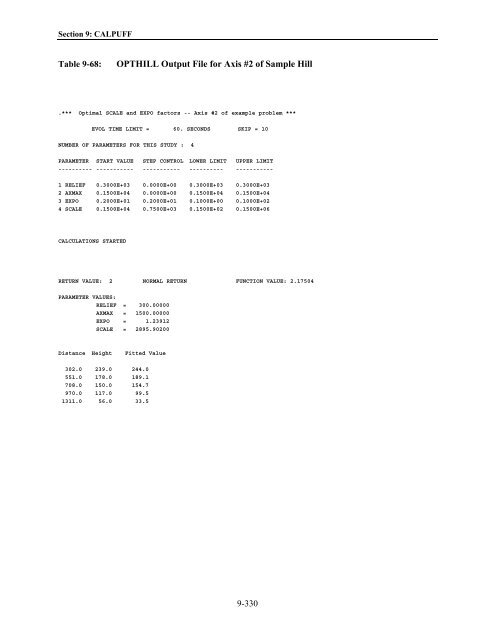
Section 9: CALPUFF Table 9-68: OPTHILL Output File for Axis #2 of Sample Hill .*** Optimal SCALE and EXPO factors -- Axis #2 of example problem *** EVOL TIME LIMIT = 60. SECONDS SKIP = 10 NUMBER OF PARAMETERS FOR THIS STUDY : 4 PARAMETER START VALUE STEP CONTROL LOWER LIMIT UPPER LIMIT ---------- ----------- ----------- ---------- ----------- 1 RELIEF 0.3000E+03 0.0000E+00 0.3000E+03 0.3000E+03 2 AXMAX 0.1500E+04 0.0000E+00 0.1500E+04 0.1500E+04 3 EXPO 0.2000E+01 0.2000E+01 0.1000E+00 0.1000E+02 4 SCALE 0.1500E+04 0.7500E+03 0.1500E+02 0.1500E+06 CALCULATIONS STARTED RETURN VALUE: 2 NORMAL RETURN FUNCTION VALUE: 2.17504 PARAMETER VALUES: RELIEF = 300.00000 AXMAX = 1500.00000 EXPO = 1.23912 SCALE = 2895.90200 Distance Height Fitted Value 302.0 239.0 244.0 551.0 178.0 189.1 708.0 150.0 154.7 970.0 117.0 99.5 1311.0 56.0 33.5 9-330
Section 9: CALPUFF This process is simplified somewhat if a batch file is used to manage the filenames. One such batch file for DOS (RUNOPT.BAT) is included with the testcase. It requires three filenames as arguments: RUNOPT file1 file2 file3 where file1 OPTHILL.EXE executable program file file2 user.inp input file file3 user.out output file The batch file copies file2 to OPTHILL.INP, runs OPTHILL.EXE which creates OPTHILL.LST, then renames OPTHILL.LST to the name supplied as file3. For the example above, axis #1 would be processed by typing the command: RUNOPT OPTHILL.EXE AXIS1.INP AXIS1.LST With these results, hill information that is independent of the choice of coordinate system and the modeling grid for the wind model can be specified: xc,yc (m) (depends on choice of coordinates) thetah (deg) 69° zgrid (m) (depends on grid for wind model) relief (m) 300. expo (1) 1.91 expo (2) 1.24 scale (1) (m) 1523. scale (2) (m) 2896. axmax (1) (m) 2000. axmax (2) (m) 1500. Note that scale(2) is almost twice scale(1), even though axis 1 corresponds to the longer axis of the hill. This can occur because the "scale" parameter is a property of the entire inverse-polynomial function (Equation 9-1), rather than just the portion of the function that is fit to the profile of the terrain. In Figure 9-1, the shape of the terrain might best conform to the upper 10% of the polynomial function, in which case the "scale" parameter would exceed "axmax." In this example application of the OPTHILL program, we see that axmax(2) is substantially less than axmax(1), whereas scale(2) exceeds scale(1), indicating that a comparatively smaller portion of the polynomial function represents the terrain profile along the minor axis. 9-331
- Page 715 and 716: Section 9: CALPUFF IF(NVL1.GT.0) RE
- Page 717 and 718: Section 9: CALPUFF Table 9-56 (Cont
- Page 719 and 720: Section 9: CALPUFF Table 9-56 (Cont
- Page 721 and 722: Section 9: CALPUFF Table 9-56 (Cont
- Page 723 and 724: Section 9: CALPUFF Table 9-56 (Cont
- Page 725 and 726: Section 9: CALPUFF Table 9-56 (Cont
- Page 727 and 728: Section 9: CALPUFF Table 9-56 (Cont
- Page 729 and 730: Section 9: CALPUFF Table 9-56 (Conc
- Page 731 and 732: Section 9: CALPUFF 5 SYKM real Sour
- Page 733 and 734: Section 9: CALPUFF 9.15.6 Relative
- Page 735 and 736: Section 9: CALPUFF Table 9-58 (Cont
- Page 737 and 738: Section 9: CALPUFF Table 9-58 (Cont
- Page 739 and 740: Section 9: CALPUFF Table 9-58 (Cont
- Page 741 and 742: Section 9: CALPUFF Table 9-58 (Cont
- Page 743 and 744: Section 9: CALPUFF Table 9-58 (Cont
- Page 745 and 746: Section 9: CALPUFF Table 9-58 (Cont
- Page 747 and 748: Section 9: CALPUFF Table 9-58 (Conc
- Page 749 and 750: Section 9: CALPUFF a C*15 = Charact
- Page 751 and 752: Section 9: CALPUFF Table 9-60: Samp
- Page 753 and 754: Section 9: CALPUFF 16 Length Emitte
- Page 755 and 756: Section 9: CALPUFF Table 9-62: Samp
- Page 757 and 758: Section 9: CALPUFF Table 9-63: Samp
- Page 759 and 760: Section 9: CALPUFF Figure 9-1: Prof
- Page 761 and 762: Section 9: CALPUFF Table 9-64 summa
- Page 763 and 764: Section 9: CALPUFF Figure 9-2: Map
- Page 765: Section 9: CALPUFF Table 9-67: OPTH
- Page 769 and 770: Section 10: POSTPROCESSORS 10.1 APP
- Page 771 and 772: Section 10: POSTPROCESSORS Table 10
- Page 773 and 774: Section 10: POSTPROCESSORS Table 10
- Page 775 and 776: Section 10: POSTPROCESSORS Table 10
- Page 777 and 778: Section 10: POSTPROCESSORS Table 10
- Page 779 and 780: Section 10: POSTPROCESSORS NFILE S
- Page 781 and 782: Section 10: POSTPROCESSORS Table 10
- Page 783 and 784: Section 10: POSTPROCESSORS 10.3 POS
- Page 785 and 786: Section 10: POSTPROCESSORS The name
- Page 787 and 788: Section 10: POSTPROCESSORS MNITRATE
- Page 789 and 790: Section 10: POSTPROCESSORS Table 10
- Page 791 and 792: Section 10: POSTPROCESSORS Table 10
- Page 793 and 794: Section 10: POSTPROCESSORS --------
- Page 795 and 796: Section 10: POSTPROCESSORS Table 10
- Page 797 and 798: Section 10: POSTPROCESSORS Table 10
- Page 799 and 800: Section 10: POSTPROCESSORS Note the
- Page 801 and 802: Section 10: POSTPROCESSORS Table 10
- Page 803 and 804: Section 10: POSTPROCESSORS Chemical
- Page 805 and 806: Section 10: POSTPROCESSORS N S PM10
- Page 807 and 808: Section 10: POSTPROCESSORS 10.4 CAL
- Page 809 and 810: Section 10: POSTPROCESSORS Table 10
- Page 811 and 812: Section 10: POSTPROCESSORS Table 10
- Page 813 and 814: Section 10: POSTPROCESSORS 10.5 Inp
- Page 815 and 816: Section 10: POSTPROCESSORS Table 10
Section 9: CALPUFF<br />
<strong>Table</strong> 9-68:<br />
OPTHILL Output File for Axis #2 <strong>of</strong> Sample Hill<br />
.*** Optimal SCALE and EXPO factors -- Axis #2 <strong>of</strong> example problem ***<br />
EVOL TIME LIMIT = 60. SECONDS SKIP = 10<br />
NUMBER OF PARAMETERS FOR THIS STUDY : 4<br />
PARAMETER START VALUE STEP CONTROL LOWER LIMIT UPPER LIMIT<br />
---------- ----------- ----------- ---------- -----------<br />
1 RELIEF 0.3000E+03 0.0000E+00 0.3000E+03 0.3000E+03<br />
2 AXMAX 0.1500E+04 0.0000E+00 0.1500E+04 0.1500E+04<br />
3 EXPO 0.2000E+01 0.2000E+01 0.1000E+00 0.1000E+02<br />
4 SCALE 0.1500E+04 0.7500E+03 0.1500E+02 0.1500E+06<br />
CALCULATIONS STARTED<br />
RETURN VALUE: 2 NORMAL RETURN FUNCTION VALUE: 2.17504<br />
PARAMETER VALUES:<br />
RELIEF = 300.00000<br />
AXMAX = 1500.00000<br />
EXPO = 1.23912<br />
SCALE = 2895.90200<br />
Distance Height Fitted Value<br />
302.0 239.0 244.0<br />
551.0 178.0 189.1<br />
708.0 150.0 154.7<br />
970.0 117.0 99.5<br />
1311.0 56.0 33.5<br />
9-330


