Mobility in maltose-water glasses studied with 1 H NMR
Mobility in maltose-water glasses studied with 1 H NMR
Mobility in maltose-water glasses studied with 1 H NMR

Create successful ePaper yourself
Turn your PDF publications into a flip-book with our unique Google optimized e-Paper software.
J. Phys. Chem. B 1998, 102, 10483-10489<br />
10483<br />
ARTICLES<br />
<strong>Mobility</strong> <strong>in</strong> Maltose-Water Glasses Studied <strong>with</strong> 1 H <strong>NMR</strong><br />
Ivon J. van den Dries, † Dagmar van Dusschoten, ‡ and Marcus A. Hemm<strong>in</strong>ga* ,‡<br />
Department of Food Science, Food Physics Group, Wagen<strong>in</strong>gen Agricultural UniVersity,<br />
P.O. Box 8129, 6700 EV Wagen<strong>in</strong>gen, The Netherlands, and Department of Molecular Physics,<br />
Wagen<strong>in</strong>gen Agricultural UniVersity, P.O. Box 8128, 6700 ET Wagen<strong>in</strong>gen, The Netherlands<br />
ReceiVed: June 22, 1998; In F<strong>in</strong>al Form: September 25, 1998<br />
We have <strong>studied</strong> the molecular mobility of the <strong>water</strong> and carbohydrate protons <strong>in</strong> <strong>maltose</strong> samples as a function<br />
of <strong>water</strong> content and temperature us<strong>in</strong>g 1 H <strong>NMR</strong>. In the <strong>NMR</strong> signal, slow decay<strong>in</strong>g and fast decay<strong>in</strong>g fractions<br />
of protons are dist<strong>in</strong>guished as aris<strong>in</strong>g from mobile and immobile (τ c > 3 µs) protons, respectively. The<br />
assignment of these fractions <strong>in</strong> terms of <strong>water</strong> and <strong>maltose</strong> protons is temperature dependent. By analyz<strong>in</strong>g<br />
the relaxation behavior of the mobile protons, the mobility of the <strong>water</strong> molecules is determ<strong>in</strong>ed. The mobility<br />
of <strong>water</strong> molecules <strong>in</strong>creases <strong>with</strong> <strong>water</strong> content and temperature, and at the glass transition, a small break <strong>in</strong><br />
mobility is observed, <strong>in</strong>dicat<strong>in</strong>g that the <strong>water</strong> molecules slightly sense the glass transition. The method of<br />
second moments gives <strong>in</strong>formation about the mobility of the immobile protons. Upon cool<strong>in</strong>g, the glass transition<br />
is marked by a decrease <strong>in</strong> the temperature dependence of the mobility of the hydroxyl protons of<br />
<strong>maltose</strong>. This suggests that a stable hydrogen-bond network between the sugar molecules is formed at the<br />
glass transition temperature that immobilizes the hydroxyl groups. Water disrupts this network, and this results<br />
<strong>in</strong> a higher mobility of the hydroxyl protons of <strong>maltose</strong>. The more <strong>water</strong> the stronger is this plasticiz<strong>in</strong>g<br />
effect.<br />
Introduction<br />
Dur<strong>in</strong>g the last few years there has been an <strong>in</strong>creas<strong>in</strong>g <strong>in</strong>terest<br />
<strong>in</strong> the study of molecular motions <strong>in</strong> glassy food materials. 1<br />
Discont<strong>in</strong>uities <strong>in</strong> macroscopic properties such as the viscosity,<br />
specific heat, and specific volume characterize the glass<br />
transition. At a molecular level, an <strong>in</strong>terpretation of these<br />
macroscopic discont<strong>in</strong>uities is still lack<strong>in</strong>g, but the macroscopic<br />
changes must be related to a change of molecular mobility.<br />
Several techniques can be used to study molecular mobility<br />
around the glass transition temperature such as electron sp<strong>in</strong><br />
resonance (ESR), 2-4 fluorescence, 5,6 dielectric relaxation, 7 and<br />
nuclear magnetic resonance (<strong>NMR</strong>) techniques. 8-11 From these<br />
studies, it is clear that although the mobility of the glass-form<strong>in</strong>g<br />
molecules decreases strongly around the glass transition temperature,<br />
small molecules such as fluorescent or sp<strong>in</strong> probes<br />
rema<strong>in</strong> relatively mobile. 2-5,8,9,12-16<br />
In the present work, we focus on the molecular mobility <strong>in</strong><br />
<strong>maltose</strong>-<strong>water</strong> systems. It is known that <strong>water</strong> reorients relatively<br />
<strong>in</strong>dependent of the carbohydrate matrix, 9 resembl<strong>in</strong>g other<br />
small molecules <strong>in</strong> a matrix. Although <strong>water</strong> molecules only<br />
slightly sense the glass transition of the matrix, their presence<br />
largely depresses the glass transition temperature. The molecular<br />
mechanism of this plasticiz<strong>in</strong>g effect is <strong>studied</strong> <strong>with</strong> proton<br />
<strong>NMR</strong>. With <strong>NMR</strong>, immobile (τ c >13 µs) and mobile protons<br />
are dist<strong>in</strong>guished and can be roughly assigned to hydroxyl<br />
* To whom correspondence should be addressed.<br />
† Wagen<strong>in</strong>gen Agricultural University.<br />
‡ Wagen<strong>in</strong>gen Agricultural University.<br />
and r<strong>in</strong>g protons of <strong>maltose</strong> and <strong>water</strong>. By analysis of the<br />
relaxation behavior of the mobile protons, the mobility of the<br />
<strong>water</strong> is <strong>studied</strong>. The method of second moments is used to<br />
obta<strong>in</strong> <strong>in</strong>formation about the mobility of the immobile protons<br />
around the glass transition temperature. On the basis of the<br />
results of mobility of protons around the glass transition temperature,<br />
a molecular mechanism of plasticization is proposed.<br />
Materials and Methods<br />
Preparation of Maltose-Water Samples. Maltose monohydrate<br />
(Merck) was mixed <strong>with</strong> the appropriate amount of<br />
<strong>water</strong> <strong>in</strong> a5mm<strong>NMR</strong>tube to adjust the content of <strong>maltose</strong> to<br />
80, 90, and 93 wt %. For the 95 wt % sample, <strong>maltose</strong><br />
monohydrate was used <strong>with</strong>out addition of <strong>water</strong>. The <strong>NMR</strong><br />
tubes were sealed to prevent <strong>water</strong> evaporation. The <strong>maltose</strong><strong>water</strong><br />
samples were melted <strong>in</strong> an oil bath at a temperature of<br />
about 420 K. The melt<strong>in</strong>g time was as short as possible to obta<strong>in</strong><br />
a homogeneous melted sample <strong>with</strong>out brown<strong>in</strong>g by degradation<br />
of the <strong>maltose</strong>. Melted <strong>maltose</strong> samples were quickly cooled<br />
and stored below their respective glass transition temperature.<br />
Maltose <strong>with</strong> deuterated hydroxyl groups was prepared by<br />
dissolv<strong>in</strong>g the monohydrate (1 g) <strong>in</strong> D 2 O (5 mL) and subsequently<br />
freeze-dry<strong>in</strong>g before adjust<strong>in</strong>g the <strong>water</strong> content <strong>with</strong><br />
D 2 O. The glass transition temperature of the deuterated samples<br />
was measured <strong>with</strong> differential scann<strong>in</strong>g calorimetry (DSC) and<br />
compared <strong>with</strong> literature values. 7 The D 2 O contents were 7 and<br />
21 wt %.<br />
<strong>NMR</strong> Spectroscopy. 1 H <strong>NMR</strong> measurements were performed<br />
on a Bruker AMX 300 spectrometer equipped <strong>with</strong> a Bruker 5<br />
10.1021/jp982718v CCC: $15.00 © 1998 American Chemical Society<br />
Published on Web 12/01/1998
10484 J. Phys. Chem. B, Vol. 102, No. 51, 1998 van den Dries et al.<br />
Figure 2. The ratio of the mobile (B) and immobile (A) proton<br />
fractions as a function of temperature for 95 (O), 93 (4), 90 (+), and<br />
80 wt % (0) <strong>maltose</strong> samples. The straight l<strong>in</strong>es are l<strong>in</strong>ear fits through<br />
the data po<strong>in</strong>ts. The glass transition temperatures are <strong>in</strong>dicated <strong>with</strong><br />
dashed vertical l<strong>in</strong>es. The dashed horizontal l<strong>in</strong>es <strong>in</strong>dicate the calculated<br />
values of B/A from Table 1.<br />
proton fraction. The <strong>NMR</strong> spectrum of the immobile proton<br />
fraction is assumed to be a rectangular l<strong>in</strong>e shape <strong>with</strong> a total<br />
width 2b, convoluted <strong>with</strong> a Gaussian l<strong>in</strong>e shape <strong>with</strong> a standard<br />
deviation given by parameter a. 19,20<br />
For a resonance curve described by a normalized shape<br />
function f(ω) <strong>with</strong> a maximum at a frequency ω 0 , the second<br />
moment M 2 <strong>with</strong> respect to the po<strong>in</strong>t ω 0 is def<strong>in</strong>ed as: 19<br />
M 2 ) ∫(ω - ω 0 ) 2 f(ω) ∂ω (2)<br />
Figure 1. Free <strong>in</strong>duction decays (FIDs) of 80 wt % <strong>maltose</strong>-<strong>water</strong><br />
samples (A) and the correspond<strong>in</strong>g Fourier transformed <strong>NMR</strong> spectra<br />
(B). For temperatures below 250 K, the experimental FIDs are fitted<br />
to eq 1, whereas at higher temperatures a biexponential function is<br />
used. The fits are <strong>in</strong>dicated by (+) 210, (]) 235, (4) 255, and (X) 265<br />
K. The FIDs are scaled to the value of fit parameters A + B, and the<br />
<strong>NMR</strong> spectra are scaled to the <strong>in</strong>tensity of the highest peak.<br />
mm proton probe operat<strong>in</strong>g at a resonance frequency of 300.13<br />
MHz. The temperature was regulated <strong>with</strong> a nitrogen temperature<br />
control. In this way, the temperature stability was <strong>with</strong><strong>in</strong><br />
(0.5 K. A spectral width of 500 kHz was used. The duration<br />
of the 90° pulse was 6-7 µs. The presented free <strong>in</strong>duction<br />
decays (FID) are averages of eight scans hav<strong>in</strong>g 2048 data<br />
po<strong>in</strong>ts. Cross relaxation rates were measured <strong>with</strong> the Goldman<br />
Shen pulse sequence. 17,18 This pulse sequence of three 90 x °<br />
pulses makes use of the difference <strong>in</strong> sp<strong>in</strong>-sp<strong>in</strong> relaxation<br />
between fast and slow relax<strong>in</strong>g protons.<br />
For the analysis of the <strong>NMR</strong> data at low temperatures, the<br />
FIDs F(t) were fitted to the follow<strong>in</strong>g equation:<br />
F(t) ) A exp[ - a2 t 2 s<strong>in</strong> bt<br />
+ B<br />
2 ] bt<br />
exp[ -t (1)<br />
T 2m<br />
]<br />
In this equation, the parameters A and B represent the contributions<br />
of the immobile and mobile protons <strong>in</strong> the sample, also<br />
presented by the <strong>in</strong>tegral of the broad and sharp l<strong>in</strong>e shape parts<br />
of the <strong>NMR</strong> spectrum, respectively (see parts A and B of Figure<br />
1). Parameter T 2m is the sp<strong>in</strong>-sp<strong>in</strong> relaxation time of the mobile<br />
In our systems, the second moment is not used for the whole<br />
system but only for the broad part of the l<strong>in</strong>e shape that arises<br />
from the immobile proton fraction. The second moment M 2 of<br />
the broad l<strong>in</strong>e shape, which is a measure of the strength of the<br />
dipolar <strong>in</strong>teractions, is calculated from the fit parameters a and<br />
b by the follow<strong>in</strong>g equation: 19<br />
M 2 ) a 2 + 1 3 b2 (3)<br />
On <strong>in</strong>creas<strong>in</strong>g the temperature, the dipolar <strong>in</strong>teractions start to<br />
average and the broad component of the <strong>NMR</strong> spectrum<br />
sharpens up. As long as the FIDs show oscillations, characteristic<br />
for the rectangular l<strong>in</strong>e shape of the immobile proton fraction,<br />
they are well fitted by eq 1. F<strong>in</strong>ally, the oscillatory character of<br />
the FID is lost, and the FIDs are fitted to a biexponential<br />
function.<br />
Results<br />
The FIDs of a 80 wt % <strong>maltose</strong>-<strong>water</strong> sample at various<br />
temperatures are shown <strong>in</strong> Figure 1A, and the correspond<strong>in</strong>g<br />
<strong>NMR</strong> spectra are shown <strong>in</strong> Figure 1B. The <strong>NMR</strong> spectra at<br />
low temperature consist of a sharp l<strong>in</strong>e shape, aris<strong>in</strong>g from<br />
relatively mobile protons, superimposed on a broad l<strong>in</strong>e shape,<br />
aris<strong>in</strong>g from immobile protons. The ratio of the mobile (B) and<br />
immobile (A) proton fractions <strong>in</strong> various <strong>maltose</strong>-<strong>water</strong> samples,<br />
as determ<strong>in</strong>ed from fitt<strong>in</strong>g the FID to eq 1, is shown versus<br />
temperature <strong>in</strong> Figure 2. For all samples, the ratio B/A <strong>in</strong>creases<br />
almost l<strong>in</strong>early <strong>with</strong> <strong>in</strong>creas<strong>in</strong>g temperature, <strong>in</strong>dicat<strong>in</strong>g that<br />
protons gradually go over from the immobile to the mobile<br />
fraction. No breaks are observed at the glass transition temperatures<br />
T g , 7 which are <strong>in</strong>dicated by the vertical l<strong>in</strong>es <strong>in</strong> Figure<br />
2. With <strong>in</strong>creas<strong>in</strong>g <strong>water</strong> content, the slope of the l<strong>in</strong>es<br />
<strong>in</strong>creases.
<strong>Mobility</strong> <strong>in</strong> Maltose-Water Glasses J. Phys. Chem. B, Vol. 102, No. 51, 1998 10485<br />
Figure 3. The relaxation time of the mobile protons (T 2m) versus<br />
temperature for 95 (O), 93 (4), 90 (+), and 80 wt % (0) <strong>maltose</strong><br />
samples. The straight l<strong>in</strong>es are l<strong>in</strong>ear fits through the data po<strong>in</strong>ts. The<br />
glass transition temperatures are <strong>in</strong>dicated <strong>with</strong> dashed vertical l<strong>in</strong>es.<br />
For the 80 wt % <strong>maltose</strong>-<strong>water</strong> sample at a temperature of<br />
255 K (Figure 1), the typical characteristic of the broad l<strong>in</strong>e<br />
shape has completely disappeared and both l<strong>in</strong>e shape contributions<br />
have strongly sharpened up. In this case, eq 1 can no longer<br />
be used for the analysis of the FID and a biexponential fit is<br />
used <strong>in</strong>stead. All data shown are fitted to eq 1, except for the<br />
samples <strong>with</strong> 80 wt % <strong>maltose</strong> at temperatures higher than 250<br />
K and for the samples <strong>with</strong> 90 wt % <strong>maltose</strong> at temperatures<br />
above 300 K.<br />
The sp<strong>in</strong>-sp<strong>in</strong> relaxation time of the mobile protons, T 2m ,<br />
obta<strong>in</strong>ed from the analysis of the FIDs, is plotted <strong>in</strong> Figure 3.<br />
In all cases, an <strong>in</strong>crease of T 2m is observed at higher temperatures<br />
and <strong>water</strong> contents, result<strong>in</strong>g <strong>in</strong> a sharpen<strong>in</strong>g of the l<strong>in</strong>e<br />
shape of the mobile protons. Also, <strong>in</strong> this figure a rapid <strong>in</strong>crease<br />
occurs <strong>in</strong> T 2m around T g , <strong>in</strong>dicated by the vertical l<strong>in</strong>es. It is<br />
remarkable that T 2m at T g <strong>in</strong>creases <strong>with</strong> <strong>in</strong>creas<strong>in</strong>g <strong>water</strong><br />
content, result<strong>in</strong>g <strong>in</strong> a sharper l<strong>in</strong>e shape, although the temperature<br />
decreases.<br />
From the parameters a and b deduced from the fits of the<br />
FIDs <strong>with</strong> eq 1, the second moment M 2 of the broad l<strong>in</strong>e shape<br />
is calculated us<strong>in</strong>g eq 3. For samples <strong>with</strong> a low <strong>water</strong> content,<br />
the values of the second moment were also calculated us<strong>in</strong>g<br />
the <strong>in</strong>tegral method (eq 2) to check the validity of eq 3. The<br />
values of M 2 were comparable, and therefore, all data on M 2 of<br />
the immobile fraction are obta<strong>in</strong>ed <strong>with</strong> eq 3. The results are<br />
shown <strong>in</strong> Figure 4 as a function of <strong>water</strong> content and temperature<br />
for protonated as well as for deuterated <strong>maltose</strong>-<strong>water</strong> systems.<br />
Higher values of M 2 are observed for the protonated samples<br />
(open symbols) as compared to the deuterated samples (filled<br />
symbols). Around the glass transition temperature T g , <strong>in</strong>dicated<br />
<strong>with</strong> vertical l<strong>in</strong>es, breaks <strong>in</strong> M 2 are observed. Below T g ,a<br />
plateau value of M 2 is reached <strong>in</strong> both deuterated samples and<br />
the protonated 95 wt % <strong>maltose</strong>-<strong>water</strong> sample. In the other<br />
protonated samples, the <strong>in</strong>crease of M 2 <strong>with</strong> decreas<strong>in</strong>g temperature<br />
below T g is larger if the sample conta<strong>in</strong>s more <strong>water</strong>.<br />
Below T g , higher values of M 2 are reached on <strong>in</strong>creas<strong>in</strong>g <strong>water</strong><br />
contents.<br />
The cross relaxation rates <strong>in</strong> <strong>maltose</strong>-<strong>water</strong> systems, as<br />
determ<strong>in</strong>ed <strong>with</strong> the Goldman Shen pulse sequence, 17,18 are on<br />
the order of 10 3 s -1 . The cross relaxation rates slightly decrease<br />
<strong>with</strong> temperature and <strong>water</strong> content.<br />
Discussion<br />
In this paper, it is our aim to <strong>in</strong>vestigate the physical state<br />
and dynamics of the <strong>water</strong> and <strong>maltose</strong> molecules <strong>in</strong> concentrated<br />
<strong>maltose</strong>-<strong>water</strong> samples us<strong>in</strong>g 1 H <strong>NMR</strong>. The <strong>water</strong> content<br />
Figure 4. The second moment of the immobile protons (M 2) versus<br />
temperature for 95 (O), 93 (4), 90 (+), and 80 wt % (0) <strong>maltose</strong><br />
samples. The second moment of solid protons <strong>in</strong> deuterated samples<br />
(93 and 79 wt %) is shown <strong>with</strong> correspond<strong>in</strong>g filled symbols. The<br />
straight l<strong>in</strong>es are l<strong>in</strong>ear fits through the data po<strong>in</strong>ts. The glass transition<br />
temperatures are <strong>in</strong>dicated <strong>with</strong> dashed vertical l<strong>in</strong>es.<br />
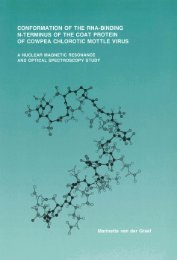
Figure 5. Molecular structure of <strong>maltose</strong>. The eight hydroxyl protons<br />
(pla<strong>in</strong>) and the four exocyclic protons (bold) are shown.<br />
ranges between 5 and 20 wt % <strong>water</strong>. This corresponds to an<br />
average number of <strong>water</strong> molecules per <strong>maltose</strong> molecule <strong>in</strong><br />
the range 1-4.75, respectively. Under these conditions, all <strong>water</strong><br />
molecules are unfreezable. The chemical structure of <strong>maltose</strong><br />
is shown <strong>in</strong> Figure 5. The protons of <strong>maltose</strong> can be divided <strong>in</strong><br />
three groups: ten protons directly bound to the glucose r<strong>in</strong>gs,<br />
four CH 2 protons of the exocyclic groups, and eight hydroxyl<br />
protons. The mobility of the r<strong>in</strong>g protons is thought to follow<br />
the overall mobility of the <strong>maltose</strong> molecule as a whole. The<br />
CH 2 and hydroxyl protons may have a higher albeit restricted<br />
mobility because they are remote from the r<strong>in</strong>g and therefore<br />
have an additional degree of motional freedom. Furthermore,<br />
the hydroxyl protons have the ability to exchange <strong>with</strong> the <strong>water</strong><br />
protons and to form hydrogen bonds <strong>with</strong> the <strong>water</strong> molecules<br />
and <strong>with</strong> other OH groups.<br />
To discuss the dynamics of the <strong>water</strong> and sugar protons, it is<br />
desirable to know which part of the 1 H <strong>NMR</strong> signal decay can<br />
be ascribed to the <strong>water</strong> and which part to <strong>maltose</strong> protons. In<br />
the free <strong>in</strong>duction decay (FID), slow decay<strong>in</strong>g and fast decay<strong>in</strong>g<br />
fractions of protons are aris<strong>in</strong>g from mobile and immobile<br />
protons, respectively. In the follow<strong>in</strong>g, the assignment of the<br />
slow and fast decay<strong>in</strong>g part of the FID to <strong>water</strong> and sugar<br />
protons will be considered first, followed by a discussion of<br />
the transverse relaxation behavior (T 2m ) of the mobile protons.<br />
F<strong>in</strong>ally the second moment (M 2 ) of the immobile protons is<br />
discussed.<br />
In Figure 1B, typical examples of low-temperature 1 H <strong>NMR</strong><br />
spectra are shown for an 80 wt % <strong>maltose</strong>-<strong>water</strong> sample. The<br />
broad spectral component arises from immobile protons, and<br />
the relatively sharp peak, which is superimposed on it, arises<br />
from the mobile protons. The broad spectral component is the<br />
result of a distribution of static unaveraged proton dipole-dipole
10486 J. Phys. Chem. B, Vol. 102, No. 51, 1998 van den Dries et al.<br />
TABLE 1: Molecular Ratio of Water and Maltose,<br />
Calculated Ratio B/A (B/A) calc Based on Proton Densities of<br />
Water and Maltose, Temperature (T calc ) Where this Value of<br />
B/A is Measured, and Glass Transition Temperature (T g ) for<br />
Various Maltose-Water Samples<br />
wt % <strong>maltose</strong> <strong>water</strong>/<strong>maltose</strong> (B/A) calc T calc (K) T g (K)<br />
80 4.75 0.43 248 242<br />
90 2.11 0.19 269 278<br />
93 1.43 0.13 297 292<br />
95 1.00 0.09 300 297<br />
<strong>in</strong>teractions <strong>in</strong> the sample. This results <strong>in</strong> a oscillatory behavior<br />
of the FID, where the frequency of the oscillations is a measure<br />
of the strength of the dipole <strong>in</strong>teractions. The first part of the<br />
FID is then described by the damped s<strong>in</strong>usoidal part of eq 1. A<br />
similar FID was fitted us<strong>in</strong>g an equation <strong>in</strong> which the Gaussian<br />
part of eq 1 was replaced by an exponential. 11 Compar<strong>in</strong>g both<br />
fits, we found that residual plots of the FID are best when us<strong>in</strong>g<br />
eq 1. The sharp l<strong>in</strong>e shape is well described by a Lorentzian<br />
l<strong>in</strong>e shape, characterized by a width at half-height given by ∆<br />
) (πT 2m ). -1 The lower limit<strong>in</strong>g value of T 2m to describe the<br />
l<strong>in</strong>e shape <strong>with</strong> this equation is 2 × 10 -5 s, which is about the<br />
width of the broad spectral component (Figure 1). This<br />
corresponds to an upper limit of the correlation time τ c of 3 ×<br />
10 -6 s calculated us<strong>in</strong>g the Bloembergen-Purcell-Pound<br />
theory. 19 Protons <strong>with</strong> τ c values above 3 × 10 -6 s will be part<br />
of the broad l<strong>in</strong>e shape and will be called immobile or solid <strong>in</strong><br />
the follow<strong>in</strong>g discussion.<br />
1<br />
H <strong>NMR</strong> signals of carbohydrate-<strong>water</strong> mixtures <strong>studied</strong><br />
previously were divided <strong>in</strong>to a slowly relax<strong>in</strong>g part and a fast<br />
relax<strong>in</strong>g part. The slowly relax<strong>in</strong>g fraction was often identified<br />
as orig<strong>in</strong>at<strong>in</strong>g from the <strong>water</strong> protons and the fast relax<strong>in</strong>g<br />
fraction from the carbohydrate protons, although it was noted<br />
that hydroxyl protons of the sugar could contribute to the slowly<br />
relax<strong>in</strong>g decay by chemical exchange. 9,11,21-23 Recently, it was<br />
observed <strong>in</strong> 93 wt % starch-<strong>water</strong> mixtures that some <strong>water</strong><br />
molecules were relax<strong>in</strong>g fast at subzero temperatures. 24 This<br />
<strong>in</strong>dicates that the immobile and mobile protons cannot be simply<br />
assigned to carbohydrate and <strong>water</strong> protons, respectively. This<br />
is also illustrated <strong>in</strong> Figure 2, which shows that the ratio of<br />
amplitudes of the mobile (B) and immobile (A) fractions (eq 1)<br />
is temperature dependent.<br />
The ratio of <strong>water</strong> protons and <strong>maltose</strong> protons can be<br />
calculated from the known weight percentages of <strong>water</strong> and<br />
<strong>maltose</strong> <strong>in</strong> the samples. For example, <strong>in</strong> an 80 wt % <strong>maltose</strong><br />
sample, the ratio of <strong>water</strong> to <strong>maltose</strong> molecules is 4.75 and thus<br />
the ratio B/A is calculated to be 9.5:22 ) 0.43. As is seen <strong>in</strong><br />
Figure 2, this value is reached at a temperature of 248 K (see<br />
Table 1). The results for the various <strong>maltose</strong>-<strong>water</strong> samples<br />
are summarized <strong>in</strong> Table 1. In this table, it can be noticed that<br />
the temperature at which the calculated ratio B/A ((B/A) calc )is<br />
observed (<strong>in</strong>dicated by the dashed horizontal l<strong>in</strong>es <strong>in</strong> Figure<br />
2), tends to follow the glass transition temperature T g . At higher<br />
or lower temperatures, the ratio B/A deviates from (B/A) calc . This<br />
occurs because the separation of the <strong>NMR</strong> signal by the fit<br />
procedure is not based on discrim<strong>in</strong>ation between <strong>maltose</strong> and<br />
<strong>water</strong> protons but on discrim<strong>in</strong>ation between mobile and<br />
immobile protons. This separation is temperature dependent<br />
because the molecular mobility is temperature dependent.<br />
Therefore, it is possible that we f<strong>in</strong>d that above T g more<br />
“mobile” protons exist than we can account for on basis of the<br />
known <strong>water</strong> content, whereas below T g we f<strong>in</strong>d less “mobile”<br />
protons than we can account for.<br />
A higher than calculated value of the ratio B/A can be<br />
expla<strong>in</strong>ed by <strong>maltose</strong> protons becom<strong>in</strong>g mobile, although it has<br />
also been expla<strong>in</strong>ed to arise from chemical exchange between<br />
the <strong>water</strong> and the <strong>maltose</strong> protons. Chemical exchange is<br />
exchange of protons of the <strong>water</strong> and the sugar by which<br />
magnetization is exchanged. 25,26 If chemical exchange times<br />
have the same time scale as T 2m ,10 -5 s, this exchange can<br />
significantly <strong>in</strong>fluence the amplitudes of the mobile and<br />
immobile fractions. Although it was observed 27 that the chemical<br />
exchange time for 60 wt % glucose-<strong>water</strong> samples at room<br />
temperature is on the order of 10 -2 s and thus too slow to<br />
<strong>in</strong>fluence the ratio B/A, we also measured cross relaxation rates<br />
to estimate the <strong>in</strong>fluence of the chemical exchange rate on the<br />
ratio B/A <strong>in</strong> 80-95 wt % <strong>maltose</strong>-<strong>water</strong> samples at low<br />
temperatures. Cross relaxation is the <strong>in</strong>ter- and <strong>in</strong>tramolecular<br />
transfer of magnetization of protons by chemical exchange and/<br />
or sp<strong>in</strong> diffusion. These effects can be measured <strong>with</strong> the<br />
Goldman Shen pulse sequence. 17,18 In this pulse sequence, the<br />
difference <strong>in</strong> transverse relaxation between the immobile and<br />
the mobile protons is used to determ<strong>in</strong>e the cross relaxation<br />
between the mobile and immobile protons. The cross relaxation<br />
rate <strong>in</strong> <strong>maltose</strong> <strong>glasses</strong> decreases <strong>with</strong> temperature and <strong>water</strong><br />
content because the more rigid a sample, the more efficient is<br />
the cross relaxation takes place (data not shown). For the<br />
temperature and <strong>water</strong> content range we used, the cross<br />
relaxation rate was on the order of 10 3 s -1 , which is similar to<br />
the value observed before. 11 The upper limit for chemical<br />
exchange rate is thus 10 3 s -1 , while the transverse relaxation<br />
rates are at least 50 times larger (Figure 3). Thus, chemical<br />
exchange is too slow to <strong>in</strong>fluence the amplitudes B and A. The<br />
higher than calculated value of the ratio B/A above T g must<br />
therefore be expla<strong>in</strong>ed by sugar protons becom<strong>in</strong>g mobile.<br />
Most likely, the exocyclic hydroxyl protons of the sugar first<br />
go over from the immobile to the mobile fraction when the<br />
temperature is <strong>in</strong>creased, because they are most remote to the<br />
r<strong>in</strong>g and have therefore a higher, albeit restricted, mobility. If,<br />
for example, the two exocyclic hydroxyl protons go over to<br />
fraction B <strong>in</strong> a 80 wt % <strong>maltose</strong> sample, the ratio B/A is 0.57,<br />
which is reached at 25 degrees above T g . With<strong>in</strong> the temperature<br />
and <strong>water</strong> content range we <strong>studied</strong>, two to three sugar protons<br />
at most behave <strong>in</strong> a liquidlike way. As mentioned above, <strong>in</strong><br />
previous studies it was suggested that the hydroxyl protons of<br />
sugar molecules can contribute to the mobile protons <strong>in</strong> 1 H <strong>NMR</strong><br />
experiments via chemical exchange. 21-23,28 However, the hydroxyl<br />
protons contribute to the mobile fraction because these<br />
protons become mobile not because of chemical exchange. At<br />
temperatures below T g , the contribution of the immobile protons<br />
is relatively too large, which means that some <strong>water</strong> protons<br />
are immobile. This is illustrated by the fact that <strong>in</strong> 80 wt %<br />
<strong>maltose</strong>, the ratio B/A is 0.18 <strong>in</strong> the case that half of the <strong>water</strong><br />
protons are immobile. This po<strong>in</strong>t is reached at 220 K. Solid<br />
<strong>water</strong> protons were also observed <strong>in</strong> 93 wt % starch at low<br />
temperatures. 24<br />
The slope of B/A versus temperature is a measure of the<br />
amount of protons go<strong>in</strong>g over from the immobile to the mobile<br />
fraction per degree (Figure 2). Below T g , the slope reflects the<br />
<strong>water</strong> protons becom<strong>in</strong>g mobile. The slope of B/A versus<br />
temperature <strong>in</strong>creases <strong>with</strong> <strong>water</strong> content, because the more<br />
<strong>water</strong> protons are present the more protons will become mobile<br />
per degree of temperature. The slope of B/A <strong>in</strong> a sample <strong>with</strong><br />
20 wt % <strong>water</strong> is therefore expected to be 4.75 times higher<br />
than <strong>in</strong> a sample <strong>with</strong> 5 wt % <strong>water</strong>. The <strong>in</strong>crease <strong>in</strong> mobility<br />
of the protons <strong>with</strong> temperature is a gradual process, and T g is<br />
not marked by any discont<strong>in</strong>uity or a change <strong>in</strong> the rate of this<br />
process (Figure 2). However, above T g , where all <strong>water</strong> protons<br />
already are mobile, the slope reflects the OH groups of the sugar
<strong>Mobility</strong> <strong>in</strong> Maltose-Water Glasses J. Phys. Chem. B, Vol. 102, No. 51, 1998 10487<br />
TABLE 2: Temperature-Dependent Assignment of the<br />
Mobile (B) and Immobile (A) Fraction <strong>in</strong> Terms of Water<br />
and Sugar<br />
T A (immobile) B (mobile)<br />
T g <strong>maltose</strong> H 2O + <strong>maltose</strong><br />
becom<strong>in</strong>g so mobile that they no longer belong to the solid<br />
fraction. The amount of <strong>maltose</strong> protons decreases <strong>with</strong> <strong>in</strong>creas<strong>in</strong>g<br />
<strong>water</strong> content, but the slope above T g <strong>in</strong>creases <strong>with</strong> <strong>water</strong><br />
content. This <strong>in</strong>dicates that the average <strong>maltose</strong> proton mobility<br />
is higher <strong>in</strong> a sample <strong>with</strong> 20 wt % <strong>water</strong> as compared to a<br />
sample <strong>with</strong> 5 wt % <strong>water</strong>.<br />
By a l<strong>in</strong>ear extrapolation to lower temperatures, the ratio B/A<br />
becomes zero around 200 K. This means that then no <strong>water</strong><br />
mobility would be observed by 1 H <strong>NMR</strong>. In cellulose, <strong>in</strong> which<br />
the <strong>water</strong> molecules have a similar molecular environment, it<br />
was also observed that <strong>water</strong> mobility vanishes around 190 K. 29<br />
Only a highly mobile <strong>in</strong>dependent flipp<strong>in</strong>g of some <strong>water</strong><br />
molecules still persisted. Water mobility observed <strong>with</strong> 1 H <strong>NMR</strong><br />
<strong>in</strong> organic polymers also vanishes <strong>in</strong> the same temperature range<br />
(160-190 K). 30-33<br />
The temperature-dependent assignment of the mobile and<br />
immobile fraction to <strong>water</strong> and <strong>maltose</strong> protons is summarized<br />
<strong>in</strong> Table 2. Below T g , the mobile fraction (on the average) is<br />
thought to consist of only <strong>water</strong> protons. It is important for the<br />
follow<strong>in</strong>g discussion to keep <strong>in</strong> m<strong>in</strong>d that the immobile fraction<br />
at temperatures below T g consists of <strong>water</strong> and sugar protons<br />
and that at higher temperatures both sugar and <strong>water</strong> contribute<br />
to the mobile fraction.<br />
In Figure 3, it can be seen that <strong>in</strong> all samples the transversal<br />
relaxation time T 2m of the mobile fraction <strong>in</strong>creases <strong>with</strong><br />
<strong>in</strong>creas<strong>in</strong>g temperature. A small break <strong>in</strong> T 2m is observed at the<br />
glass transition temperature T g . This <strong>in</strong>dicates an additional<br />
<strong>in</strong>crease <strong>in</strong> reorientational motions of the mobile <strong>water</strong> protons<br />
at T g . From the dependence on <strong>water</strong> content, it can be seen<br />
that the fewer <strong>water</strong> molecules per <strong>maltose</strong> molecule, the<br />
stronger the <strong>water</strong> molecules sense the glass transition. This<br />
shows that at lower <strong>water</strong> contents the <strong>water</strong> molecules tend to<br />
have stronger <strong>in</strong>teractions <strong>with</strong> the <strong>maltose</strong> molecules. The value<br />
of T 2m of about 10 -4 s <strong>in</strong> <strong>maltose</strong> samples around T g is a factor<br />
of 10 5 smaller than the T 2 of free <strong>water</strong>. The value of τ c of<br />
<strong>water</strong> <strong>in</strong> <strong>maltose</strong> <strong>glasses</strong> is thus expected to be 10 -7 s. This<br />
observation illustrates that <strong>water</strong> mobility is decoupled from<br />
the viscosity of the sample, which <strong>in</strong>creases by a factor of 10 12 ,<br />
while the rotational mobility of the <strong>water</strong> is only slowed by a<br />
factor of 10 5 . This decoupl<strong>in</strong>g of mobility of small molecules<br />
from the matrix mobility has been observed before <strong>in</strong> a glassy<br />
matrix. 9,13,34-36 In epoxy res<strong>in</strong> 37,38 or poly(v<strong>in</strong>ylpyrrolidone) 16<br />
<strong>glasses</strong>, <strong>water</strong> mobility is even less retarded compared to free<br />
<strong>water</strong>, probably because these polymers are much more<br />
hydrophobic and cannot form multiple hydrogen bonds. Not<br />
only rotational mobility but also translational mobility of small<br />
molecules is decoupled from the matrix mobility. 13,15,39,40 In<br />
Ficoll, a sucrose-based polymer, the translational mobility of<br />
<strong>water</strong> as determ<strong>in</strong>ed from desorption experiments is unaffected<br />
by the glass transition of the carbohydrate. 15 The translational<br />
mobility of <strong>water</strong> was also found to be decoupled by a factor<br />
of 10 7 from that of the carbohydrate matrix <strong>in</strong> concentrated<br />
<strong>maltose</strong> samples <strong>in</strong> the vic<strong>in</strong>ity of T g . 13,40<br />
On compar<strong>in</strong>g T 2m at the glass transition temperatures of every<br />
<strong>water</strong> content, it can be seen that T 2m <strong>in</strong>creases <strong>with</strong> <strong>in</strong>creas<strong>in</strong>g<br />
<strong>water</strong> content. The value of T 2m depends on dipole <strong>in</strong>teractions<br />
and rotational mobility. The dipole <strong>in</strong>teractions of <strong>water</strong> protons<br />
are ma<strong>in</strong>ly determ<strong>in</strong>ed by the distance of the two protons of<br />
<strong>water</strong> and thus constant. Therefore, it follows that at T g the <strong>water</strong><br />
molecules <strong>in</strong> an 80 wt % <strong>maltose</strong>-<strong>water</strong> sample are more<br />
mobile as compared to <strong>water</strong> molecules <strong>in</strong> a 95 wt % <strong>maltose</strong><strong>water</strong><br />
sample, even though the temperature T g has decreased.<br />
Theoretically, T 2m <strong>in</strong>creases <strong>with</strong> temperature by an <strong>in</strong>crease <strong>in</strong><br />
molecular mobility. Therefore, a lower value of T 2m is expected<br />
at a lower glass transition temperature T g . Such an effect is<br />
observed, for example, <strong>in</strong> a series of malto-oligomer samples<br />
<strong>with</strong> constant <strong>water</strong> content <strong>in</strong> which the cha<strong>in</strong> length is varied. 9<br />
However, for our <strong>maltose</strong>-<strong>water</strong> samples, this is not the case,<br />
and it can be concluded that the effect of <strong>water</strong> content on the<br />
rotational mobility exceeds the effect of temperature.<br />
Clearly, <strong>in</strong>creas<strong>in</strong>g the <strong>water</strong> content reduces the molecular<br />
<strong>in</strong>teractions between <strong>water</strong> and <strong>maltose</strong> protons and thus<br />
<strong>in</strong>creases the rotational mobility. It is likely that <strong>in</strong> these highly<br />
concentrated <strong>maltose</strong>-<strong>water</strong> samples the <strong>water</strong> molecules mostly<br />
<strong>in</strong>teract <strong>with</strong> the hydroxyl groups of the sugar. 41 A <strong>water</strong><br />
molecule <strong>in</strong> a 95 wt % <strong>maltose</strong> sample hardly <strong>in</strong>teracts <strong>with</strong><br />
other <strong>water</strong> molecules <strong>in</strong> the time that the <strong>NMR</strong> signal decays.<br />
This can be calculated from the equation x ) (2Dt) 1/2 , <strong>in</strong> which<br />
x is the displacement and t the time. The diffusion coefficient<br />
D is 10 -14 m 2 /s <strong>in</strong> a 95 wt % sample at its glass transition<br />
temperature. 13,40 In such a <strong>maltose</strong> sample, hav<strong>in</strong>g only one<br />
<strong>water</strong> molecule per <strong>maltose</strong> molecule, the calculated displacement<br />
of a <strong>water</strong> molecule (0.5 nm) dur<strong>in</strong>g the time the <strong>NMR</strong><br />
signal decays (around 10 -5 s, the value of T 2 ) is on the same<br />
order of magnitude as the size of a <strong>maltose</strong> molecule. Thus,<br />
the <strong>water</strong> molecules <strong>in</strong> a 95 wt % <strong>maltose</strong> sample do not <strong>in</strong>teract<br />
<strong>with</strong> other <strong>water</strong> molecules but will only form hydrogen bonds<br />
<strong>with</strong> <strong>maltose</strong> hydroxyl protons. On <strong>in</strong>creas<strong>in</strong>g the <strong>water</strong> content,<br />
more hydrogen bonds are formed between the <strong>water</strong> molecules,<br />
and this leads to an <strong>in</strong>crease <strong>in</strong> motion and thus longer T 2m<br />
values. From the relaxation behavior of the mobile protons, it<br />
can be concluded that the rotational motion of the <strong>water</strong><br />
molecules is decoupled from the mobility of the <strong>maltose</strong><br />
molecules, as expected. However, at low <strong>water</strong> contents, the<br />
<strong>water</strong> molecules strongly <strong>in</strong>teract <strong>with</strong> the <strong>maltose</strong> molecules<br />
and therefore sense the glass transition.<br />
Hav<strong>in</strong>g discussed the relaxation of the mobile protons, we<br />
proceed <strong>with</strong> the discussion of the immobile protons. The part<br />
of the FID orig<strong>in</strong>at<strong>in</strong>g from the immobile protons cannot be<br />
characterized by a T 2 value, and therefore the method of second<br />
moments is used. 19 This method was employed already <strong>in</strong> earlier<br />
studies of mobility <strong>in</strong> crystall<strong>in</strong>e sugars 42,43 and glucose pentaacetate.<br />
44<br />
The variation of the second moment M 2 of the immobile<br />
protons <strong>with</strong> temperature is shown <strong>in</strong> Figure 4. In the analysis<br />
of M 2 , the follow<strong>in</strong>g po<strong>in</strong>ts should be taken <strong>in</strong>to account.<br />
1. A reduction of M 2 takes place if the proton density <strong>in</strong> the<br />
sample is lowered, because dipolar <strong>in</strong>teractions decrease <strong>with</strong><br />
the sixth power of the distance between protons.<br />
2. M 2 will be reduced by anisotropic mobility or slow<br />
isotropic rotations that partly average out the dipolar <strong>in</strong>teractions.<br />
A clear <strong>in</strong>dication for the first effect is seen on compar<strong>in</strong>g<br />
the deuterated and protonated <strong>maltose</strong>-<strong>water</strong> samples. S<strong>in</strong>ce<br />
the average distance between the protons <strong>in</strong>creases <strong>in</strong> the<br />
deuterated samples and deuterons hardly contribute to the dipolar<br />
coupl<strong>in</strong>gs because of their low gyromagnetic ratio, the second<br />
moment M 2 is reduced <strong>in</strong> deuterated samples. Furthermore, the<br />
<strong>in</strong>creas<strong>in</strong>g value of M 2 below T g is expla<strong>in</strong>ed by an <strong>in</strong>creas<strong>in</strong>g<br />
proton density, because the relative number of protons contribut<strong>in</strong>g<br />
to M 2 is <strong>in</strong>creas<strong>in</strong>g. Also, the temperature dependence of
10488 J. Phys. Chem. B, Vol. 102, No. 51, 1998 van den Dries et al.<br />
M 2 is related to effect 1. From Figure 2, we concluded that upon<br />
decreas<strong>in</strong>g the temperature below T g more and more <strong>water</strong><br />
protons become part of the immobile fraction. These protons<br />
<strong>in</strong>crease the value of M 2 because they give rise to an <strong>in</strong>creased<br />
static proton density and a concomitant decrease <strong>in</strong> apparent<br />
proton-proton distances. The more <strong>water</strong> protons that become<br />
immobile, the stronger the <strong>in</strong>crease <strong>in</strong> M 2 . Therefore, the slope<br />
of M 2 versus temperature is larger for 80 wt % <strong>maltose</strong><strong>water</strong><br />
samples as compared to 95 wt % <strong>maltose</strong>-<strong>water</strong> samples<br />
below T g .<br />
Related to the amount of immobile <strong>water</strong> protons is the<br />
limit<strong>in</strong>g value of M 2 that is reached at low temperatures, where<br />
all <strong>water</strong> protons are immobilized. This limit<strong>in</strong>g value should<br />
be higher <strong>in</strong> an 80 wt % <strong>maltose</strong>-<strong>water</strong> sample than <strong>in</strong> a 95 wt<br />
% sample, because the effect of <strong>water</strong> is to reduce the protonproton<br />
distances and thus to <strong>in</strong>crease M 2 . Although this limit<strong>in</strong>g<br />
value is not reached <strong>in</strong> the temperature range <strong>studied</strong>, the higher<br />
values of M 2 <strong>in</strong> a 80 wt % <strong>maltose</strong>-<strong>water</strong> sample as compared<br />
to a 95 wt % sample support this reason<strong>in</strong>g (Figure 4). The<br />
value of M 2 around T g <strong>in</strong> a 95 wt % <strong>maltose</strong>-<strong>water</strong> sample<br />
(1.15 × 10 10 s -2 ) is somewhat smaller than the value of M 2 <strong>in</strong><br />
monohydrate crystall<strong>in</strong>e <strong>maltose</strong> (1.23 × 10 10 s -2 ) 42 calculated<br />
from the known X-ray structure. 45 The somewhat lower<br />
experimental value of M 2 may reflect some local motions of<br />
the <strong>water</strong> molecules 42 (effect 2).<br />
On <strong>in</strong>creas<strong>in</strong>g the temperature, all protonated <strong>maltose</strong>-<strong>water</strong><br />
samples show a break <strong>in</strong> M 2 just above T g . This relatively steep<br />
decrease of M 2 cannot be expla<strong>in</strong>ed by proton density arguments,<br />
because Figure 2 shows no discont<strong>in</strong>uities around T g. Therefore,<br />
the <strong>in</strong>crease <strong>in</strong> slope just above T g must be expla<strong>in</strong>ed by the<br />
onset of additional mobility of hydroxyl or nonexchangeable<br />
protons (effect 2) that reduces M 2 more strongly than was the<br />
case below T g . In the deuterated samples, this discont<strong>in</strong>uity is<br />
not observed above T g , but below T g . Thus, the extra decrease<br />
of M 2 above T g <strong>in</strong> protonated samples is not due to extra mobility<br />
of the nonexchangeable <strong>maltose</strong> protons but to mobility of<br />
hydroxy protons. The steep decrease <strong>in</strong> M 2 displayed by the<br />
deuterated samples does not co<strong>in</strong>cide <strong>with</strong> T g nor <strong>with</strong> the<br />
temperatures reported for β-relaxation (203 K for 80 wt % and<br />
219 K for 93 wt % <strong>maltose</strong> samples 7 ). This effect can be<br />
expla<strong>in</strong>ed as follows. Start<strong>in</strong>g at low temperature, the motion<br />
of the nonexchangeable protons will gradually <strong>in</strong>crease on<br />
<strong>in</strong>creas<strong>in</strong>g the temperature. However, at low temperatures the<br />
anisotropic mobility of these protons is too slow to <strong>in</strong>fluence<br />
M 2 . This is reflected <strong>in</strong> the horizontal plateau value of M 2 .At<br />
a certa<strong>in</strong> temperature, the motions start to reduce M 2 , giv<strong>in</strong>g<br />
rise to the observed decrease. This temperature is not necessarily<br />
related to T g . It is likely that at first <strong>in</strong>stance the decrease will<br />
probably be due to librations of the protons of the exocyclic<br />
CH 2 OD groups, because they are most remote to the r<strong>in</strong>g and<br />
therefore have an additional degree of motional freedom. It<br />
should be noted, however, that the effect of the nonexchangeable<br />
groups will play a role <strong>in</strong> the protonated samples, but it is<br />
overshadowed by the relatively large contribution of the<br />
exchangeable hydroxyl protons.<br />
On the basis of the M 2 results, we can conclude that around<br />
T g the hydroxyl protons of the <strong>maltose</strong> molecules become<br />
mobile. This suggests that the hydrogen-bond network starts to<br />
“melt” at T g . A similar effect was deduced from molecular<br />
dynamics simulations. 46,47 Here, T g is found to <strong>in</strong>dicate an abrupt<br />
change <strong>in</strong> the hydrogen-bond properties (lifetime × number of<br />
hydrogen bonds), and upon heat<strong>in</strong>g, a weaken<strong>in</strong>g of the<br />
hydrogen-bond network is observed. Also neutron-scatter<strong>in</strong>g<br />
experiments <strong>with</strong> glassy glucose showed that the hydrogen<br />
network becomes less pronounced on heat<strong>in</strong>g and that the glass<br />
transition is accompanied by a decrease <strong>in</strong> the number of<br />
hydrogen bonds. 48<br />
The mobility of the hydroxyl protons also expla<strong>in</strong>s why the<br />
value of M 2 at T g decreases <strong>with</strong> <strong>water</strong> content. The value of<br />
M 2 is higher for a protonated 93 wt % <strong>maltose</strong>-<strong>water</strong> sample<br />
as compared to a 80 wt % sample, while <strong>in</strong> deuterated samples<br />
there is no such difference <strong>in</strong> M 2 at T g . Therefore, the decrease<br />
of M 2 at T g <strong>with</strong> <strong>in</strong>creas<strong>in</strong>g <strong>water</strong> content must be due to<br />
mobility of the <strong>water</strong> or hydroxyl protons. Because at T g all<br />
<strong>water</strong> protons belong to the mobile fraction (Table 2), we<br />
conclude that the lower value of M 2 at T g <strong>with</strong> <strong>in</strong>creas<strong>in</strong>g <strong>water</strong><br />
content is due to more mobile hydroxyl protons. Thus, the ma<strong>in</strong><br />
effect of add<strong>in</strong>g <strong>water</strong> is not an <strong>in</strong>crease of <strong>water</strong> mobility but<br />
its effect on the <strong>maltose</strong>. The presence of <strong>water</strong> enhances the<br />
mobility of hydroxyl protons of <strong>maltose</strong>. If the mobility of the<br />
glass-form<strong>in</strong>g molecules is large, the sample has to be cooled<br />
to a lower temperature before a glass is formed. This plasticization<br />
mechanism is similar to that <strong>in</strong> polymer <strong>glasses</strong> where<br />
plasticizers <strong>in</strong>crease the mobility of side cha<strong>in</strong>s of the polymer.<br />
Water <strong>in</strong> polyv<strong>in</strong>yl alcohol is said to provide a lubrication effect<br />
that promotes cha<strong>in</strong> mobility and disrupts hydrogen bond<strong>in</strong>g,<br />
remov<strong>in</strong>g further barriers to bond rotation and cha<strong>in</strong> mobility. 49<br />
On the basis of our results, we propose the follow<strong>in</strong>g model<br />
for the molecular mobility <strong>in</strong> low <strong>water</strong> content <strong>maltose</strong>-<strong>water</strong><br />
samples. The mobility of <strong>water</strong> and <strong>maltose</strong> protons decreases<br />
<strong>with</strong> decreas<strong>in</strong>g <strong>water</strong> content and temperature. The glass<br />
transition is marked by a decrease <strong>in</strong> the temperature dependence<br />
of mobility of the hydroxyl protons of <strong>maltose</strong>. As a result of<br />
strong <strong>in</strong>teractions between the <strong>maltose</strong> and <strong>water</strong> protons at<br />
low <strong>water</strong> contents, the <strong>water</strong> molecules also sense the glass<br />
transition. This suggests that upon cool<strong>in</strong>g a stable hydrogenbond<br />
network between the sugar molecules is formed at the<br />
glass transition temperature, which immobilizes the hydroxyl<br />
groups. Water molecules weaken this network, which results<br />
<strong>in</strong> a higher mobility of the hydroxyl protons of <strong>maltose</strong>. The<br />
more <strong>water</strong>, the stronger this plasticis<strong>in</strong>g effect. This property<br />
of <strong>water</strong> also expla<strong>in</strong>s why samples <strong>with</strong> a higher <strong>water</strong> content<br />
have to be cooled to lower temperatures before a glass is formed.<br />
Acknowledgment. This research was partly supported by<br />
European Union Contract ERBFAIRCT961085. We thank S.<br />
Moolenaar for assistance <strong>with</strong> the <strong>NMR</strong> experiments.<br />
References and Notes<br />
(1) Roos, Y. Phase Transitions <strong>in</strong> Foods; Academic Press: San Diego,<br />
1995.<br />
(2) Roozen, M. J. G. W.; Hemm<strong>in</strong>ga, M. A. J. Phys. Chem. 1990, 94,<br />
7326-7329.<br />
(3) Roozen, M. J. G. W.; Hemm<strong>in</strong>ga, M. A.; Walstra, P. Carbohydr.<br />
Res. 1991, 215, 229-237.<br />
(4) Roozen, M. J. G. W.; Hemm<strong>in</strong>ga, M. A. Spec. Publ.sR. Soc. Chem.<br />
1991, 82, 531-536.<br />
(5) Cicerone, M. T.; Blackburn, F. R.; Ediger, M. D. J. Chem. Phys.<br />
1995, 102, 471-479.<br />
(6) Cicerone, M. T.; Ediger, M. D. J. Chem. Phys. 1996, 104, 7210-<br />
7218.<br />
(7) Noel, T. R.; Parker, R.; R<strong>in</strong>g, S. G. Carbohydr. Res. 1996, 282,<br />
193-206.<br />
(8) Diehl, R. M.; Fujara, F.; Sillescu, H. Europhys. Lett. 1990, 13, 257-<br />
62.<br />
(9) Ablett, S.; Darke, A. H.; Izzard, M. J.; Lillford, P. J. Studies of the<br />
glass transition <strong>in</strong> malto-oligomers; Nott<strong>in</strong>gham University Press: Nott<strong>in</strong>gham,<br />
1993.<br />
(10) Girlich, D.; Lüdemann, H. D.; Buttersack, C.; Buchholz, K. Z.<br />
Naturforsch. C 1994, 49, 696.<br />
(11) Hills, B. P.; Pardoe, K. J. Mol. Liq. 1995, 63, 229-237.<br />
(12) Ediger, M. D.; Angell, C. A.; Nagel, S. R. J. Phys. Chem. 1996,<br />
100, 13200-13212.<br />
(13) Parker, R.; R<strong>in</strong>g, S. G. Carbohydr. Res. 1995, 273, 147-55.
<strong>Mobility</strong> <strong>in</strong> Maltose-Water Glasses J. Phys. Chem. B, Vol. 102, No. 51, 1998 10489<br />
(14) Girlich, D.; Lüdemann, H.-D. Z. Naturforsch 1993, 49, 250-257.<br />
(15) Aldous, B. J.; Franks, F.; Greer, A. L. J. Mater. Sci. 1997, 32,<br />
301-308.<br />
(16) Oksanen, C. A.; Zografi, G. Pharm. Res. 1993, 10, 791-9.<br />
(17) Kenwright, A. M.; Packer, K. J. Chem. Phys. Lett. 1990, 173, 471-<br />
475.<br />
(18) Goldman, M.; Shen, L. Phys. ReV. 1966, 144, 321-331.<br />
(19) Abragam, A. The pr<strong>in</strong>ciples of nuclear magnetism; Clarendon<br />
Press: Oxford, 1961.<br />
(20) McBrierty, V. J.; Packer, K. J. Nuclear magnetic resonance <strong>in</strong> solid<br />
polymers; Cambridge University Press: Cambridge, 1995.<br />
(21) Kalichevsky, M. T.; Jaroszkiewicz, E. M.; Blanshard, J. M. V.<br />
Polymer 1993, 34, 346-58.<br />
(22) Kalichevsky, M. T.; Jaroszkiewicz, E. M.; Ablett, S.; Blanshard,<br />
J. M. V.; Lillford, P. J. Carbohydr. Polym. 1992, 18, 77-88.<br />
(23) Farhat, I. A.; Mitchell, J. R.; Blanshard, J. M. V.; Derbyshire, W.<br />
Carbohydr. Polym.1996, 30, 219-227.<br />
(24) Li, S.; Dick<strong>in</strong>son, L. C.; Ch<strong>in</strong>achoti, P. J. Agric. Food Chem. 1998,<br />
46, 62-71.<br />
(25) Edzes, H. T.; Samulski, E. T. J. Magn. Reson. 1978, 31, 207-<br />
229.<br />
(26) Zimmerman, J. R.; Britt<strong>in</strong>, W. E. J. Phys. Chem. 1957, 61, 1328-<br />
1333.<br />
(27) Hills, B. P. Mol. Phys. 1991, 72, 1099-1121.<br />
(28) Ablett, S.; Izzard, M. J.; Lillford, P. J. J. Chem. Soc., Faraday<br />
Trans. 1992, 88, 789-794.<br />
(29) Radloff, D.; Böffel, C.; Spiess, H. W. Macromolecules 1996, 29,<br />
1528-1534.<br />
(30) Coyle, F. M.; Mart<strong>in</strong>, S. J.; McBrierty, V. J. J. Mol. Liq. 1996, 69,<br />
95-116.<br />
(31) McBrierty, V. J.; Zhang, X.; Douglass, D. C.; Zhang, J. X.; Jerome,<br />
R. Polymer 1994, 35, 3811-3815.<br />
(32) Qu<strong>in</strong>n, F. X.; Kampff, E.; Smyth, G.; McBrierty, V. J. Macromolecules<br />
1988, 21, 3191-3198.<br />
(33) Smyth, G.; Qu<strong>in</strong>n, F. X.; McBrierty, V. J. Macromolecules 1988,<br />
21, 3198-3204.<br />
(34) Blackburn, F. R.; Cicerone, M. T.; Hietpas, G.; Wagner, P. A.;<br />
Ediger, M. D. J. Non-Cryst. Solids 1994, 172, 256-264.<br />
(35) Blackburn, F. R.; Wang, C.; Ediger, M. D. J. Phys. Chem. 1996,<br />
100, 18249-18257.<br />
(36) Chang, I.; Fujara, F.; Geil, B.; Heuberger, G.; Mangel, T.; Sillescu,<br />
H. J. Non-Cryst. Solids 1994, 172, 248-255.<br />
(37) Jel<strong>in</strong>ski, L. W.; Dumais, J. J.; Stark, R. E.; Ellis, T. S.; Karasz, F.<br />
E. Macromolecules 1983, 16, 1019-1021.<br />
(38) Jel<strong>in</strong>ski, L. W.; Dumais, J. J.; Cholli, A. L.; Ellis, T. S.; Karasz, F.<br />
E. Macromolecules 1985, 18, 1091-1095.<br />
(39) Champion, D.; Hervet, H.; Blond, G.; Le Meste, M.; Simatos, D.<br />
J. Phys. Chem. B 1997, 101, 10674-10679.<br />
(40) Tromp, R. H.; Parker, R.; R<strong>in</strong>g, S. G. Carbohydr. Res. 1997, 303,<br />
199-205.<br />
(41) Girlich, D.; Lüdemann, H.-D. Z. Naturforsch 1993, 48c, 407-413.<br />
(42) Reynhardt, E. C. Mol. Phys 1990, 69, 1083-1097.<br />
(43) Reynhardt, E. C.; Latanowicz, L. Chem. Phys. Lett. 1996, 251, 235-<br />
241.<br />
(44) Ellis, B.; McDonald, M. P. J. Non-Cryst. Solids 1969, 1, 186-94.<br />
(45) Gress, M. E.; Jeffrey, G. A. Acta Crystallogr. 1977, B33, 2490-<br />
2495.<br />
(46) Caffarena, E.; Grigera, J. R. J. Chem. Soc., Faraday Trans. 1996,<br />
92, 2285-2289.<br />
(47) Caffarena, E. R.; Grigera, J. R. Carbohydr. Res. 1997, 300, 51-<br />
57.<br />
(48) Tromp, R. H.; Parker, R.; R<strong>in</strong>g, S. G. J. Chem. Phys. 1997, 107,<br />
6038-6049.<br />
(49) Hodge, R. M.; Bastow, T. J.; Edward, G. H.; Simon, G. P.; Hill,<br />
A. J. Macromolecules 1996, 29, 8137-8143.