Ontario Convention Market Analysis Final Report - Ministry of Tourism
Ontario Convention Market Analysis Final Report - Ministry of Tourism
Ontario Convention Market Analysis Final Report - Ministry of Tourism

You also want an ePaper? Increase the reach of your titles
YUMPU automatically turns print PDFs into web optimized ePapers that Google loves.
<strong>Ontario</strong> <strong>Convention</strong> <strong>Market</strong> <strong>Analysis</strong><br />
<strong>Final</strong> <strong>Report</strong><br />
<strong>Ontario</strong> <strong>Ministry</strong> <strong>of</strong> <strong>Tourism</strong><br />
Investment and Development Office<br />
February 2008<br />
1
Table <strong>of</strong> Contents<br />
Introduction 3<br />
The “Public Assembly” Business 5<br />
Major <strong>Ontario</strong> Venues 14<br />
Supply 21<br />
Demand 38<br />
Key Success Factors (KSF) 61<br />
Issues and Challenges 70<br />
Opportunities for <strong>Ontario</strong> 80<br />
2
1. Introduction<br />
Background and Purpose<br />
Background<br />
The “convention” industry is an important sector <strong>of</strong> the overall Canadian tourism industry, with <strong>Ontario</strong> receiving a<br />
considerable proportion <strong>of</strong> total spending. In 2004, visitor spending in <strong>Ontario</strong> by business convention visitors<br />
generated almost $800 million in spending on accommodation, food and beverage, recreation and entertainment<br />
facilities, and transportation service providers. This spending generated significant economic benefits across a<br />
variety <strong>of</strong> fronts ranging from direct government revenues to the impact on cultural and heritage attractions in host<br />
communities.<br />
Competition among convention locations is fierce however. Throughout North America cities (and more senior-level<br />
jurisdictions) wishing to increase share <strong>of</strong> the convention market have expanded and upgraded exhibit and meeting<br />
space. At the same time, there has been an increase in the sophistication <strong>of</strong> the industry. <strong>Convention</strong> organizers<br />
are well aware <strong>of</strong> the economic benefits attached to convention activity and they increasingly require that potential<br />
host locations bid for their presence.<br />
<strong>Ontario</strong>’s tourism sector faces several challenges. Effective management <strong>of</strong> these challenges for the industry<br />
requires a sustained government response built on the <strong>Ontario</strong> <strong>Tourism</strong> Strategy and its long-term, innovative plan<br />
for the sustainability and growth <strong>of</strong> <strong>Ontario</strong>’s tourism industry.<br />
Purpose<br />
The Investment and Development Office <strong>of</strong> the <strong>Ministry</strong> <strong>of</strong> <strong>Tourism</strong> (the “<strong>Ministry</strong>”) issued a Request for Proposals<br />
to “engage a consultant from to complete a <strong>Convention</strong> <strong>Market</strong> <strong>Analysis</strong> Study to determine the size <strong>of</strong> the North<br />
America and <strong>Ontario</strong> meeting, convention, and trade and consumer show market, including demand, supply and<br />
potential capacity.”<br />
The <strong>Ministry</strong>’s intent is that the Study will inform a framework to better understand the meeting, convention, and<br />
trade and consumer show market and outlook. In addition the study will support <strong>Ontario</strong> Government decisionmaking<br />
designed to sustain the competitiveness and growth <strong>of</strong> <strong>Ontario</strong>’s tourism industry.<br />
3
1. Introduction<br />
Scope <strong>of</strong> Study<br />
HLT Advisory Inc. (“HLT”) and Tradeshow Week Research (“TSW Research”) were engaged by the <strong>Ministry</strong> to<br />
complete the study. The primary objective <strong>of</strong> the study is to determine the size <strong>of</strong> the North American and<br />
<strong>Ontario</strong> meeting, convention, trade show and consumer show market.<br />
In completing this Study, HLT and TSW Research undertook the following:<br />
• Identified industry-wide trends within <strong>Ontario</strong> and North America<br />
• Inventoried venues capable <strong>of</strong> hosting meetings, conventions, trade shows and consumer shows in North<br />
America<br />
• Inventoried additions to the supply <strong>of</strong> convention and exhibition venues which are under construction,<br />
planned and proposed<br />
• Analyzed current demand for meetings, conventions, trade shows and consumer shows in <strong>Ontario</strong> and<br />
North America<br />
• Analyzed incentives and distribution channels used by industry and the public sector to attract meetings,<br />
conventions trade shows and consumer shows<br />
• Surveyed past and potential users <strong>of</strong> <strong>Ontario</strong> convention centres and trade centres<br />
• Estimated the potential size <strong>of</strong> the meeting, convention, trade show and consumer show market in North<br />
America<br />
• Estimated <strong>Ontario</strong>’s share <strong>of</strong> the North American and relevant international market for meetings,<br />
conventions, trade shows and consumer shows<br />
• Estimated the five- and ten-year demand outlook for North American and <strong>Ontario</strong> meetings, conventions,<br />
trade shows and consumer shows.<br />
Upon completion <strong>of</strong> these steps we completed the following report.<br />
4
2. The “Public Assembly” Business<br />
Introduction<br />
Broad references to the “convention” industry and “convention centres” tend to mask a diverse range <strong>of</strong> events,<br />
and the venues in which these events are accommodated. Each <strong>of</strong> these events may use similar facilities—<strong>of</strong>ten<br />
due to a lack <strong>of</strong> purpose-built alternatives—but the “ideal” facility for each event type can be substantially different.<br />
Event types<br />
In addition to “conventions”, conferences/congresses, trade shows, and consumer shows, round out the range <strong>of</strong><br />
public-assembly events. <strong>Convention</strong>, conference and congress organizers require significant amounts <strong>of</strong> meeting<br />
space while trade show organizers typically look to the functionality <strong>of</strong> the exhibit area as the key site selection<br />
criterion. The primary objective <strong>of</strong> a trade show is to bring the sellers <strong>of</strong> goods or services, within a specific<br />
industry, together with buyers. While the general public is usually not invited to a trade show, consumer shows<br />
focus on selling product to the resident/area population. Consumer shows require large amounts <strong>of</strong> parking and,<br />
ideally, access to public transportation.<br />
Venue types<br />
From a venue perspective, the term “convention centre” may include large full service buildings <strong>of</strong>fering exhibition<br />
and meeting space (a “typical” convention centre), a meeting-only venue (usually referred to as a conference<br />
centre), purpose built exhibition halls that usually include some meeting space (a “trade show” or “exhibition”<br />
centre) as well as hotels <strong>of</strong>fering substantive meeting and/or exhibit space. The operating objectives and<br />
parameters for each <strong>of</strong> these buildings is as different as the ownership structure and the event focus.<br />
The tables on the following two pages pr<strong>of</strong>ile these event and venue types.<br />
5
2. The “Public Assembly” Business<br />
Event Types and Definitions<br />
For the purposes <strong>of</strong> this analysis, events are grouped into four broad categories reflecting the<br />
different market focus, attendance and economic impact generation capability<br />
Characteristic <strong>Convention</strong>s Tradeshows Conferences and Meetings Consumer Shows<br />
<strong>Market</strong> Focus Information exchange between Forum to bring industry buyers and Smaller corporate or association Public shows where suppliers<br />
pr<strong>of</strong>essional groups and associations sellers together<br />
meetings<br />
display/sell goods directly to public<br />
Can include a trade show component<br />
Sometimes sponsored by trade or<br />
technical associations<br />
More specific in purpose than a<br />
convention<br />
Typically charge admission<br />
Attendance Pr<strong>of</strong>ile<br />
Most out-<strong>of</strong>-town attendance<br />
Visit <strong>of</strong>ten combined with vacation,<br />
spouse <strong>of</strong>ten comes along<br />
Some out-<strong>of</strong>-town attendees and<br />
exhibitors<br />
Visit seldom combined with vacation,<br />
spouse rarely accompanies delegate<br />
Includes local business meetings,<br />
management and board meetings,<br />
technical meetings, sales meetings<br />
and training seminars<br />
Varies by event<br />
Local attendees<br />
Rotation<br />
Rotation determined by association<br />
charter<br />
Meet in major markets to maximize<br />
number <strong>of</strong> buyers and sellers<br />
No rotation<br />
Locally produced<br />
Prefer tourist destinations<br />
Revenue Generation Registration fees<br />
Little rotation<br />
Exhibit booth sales<br />
Registration fees<br />
Admissions<br />
Sponsorships<br />
Sponsorships<br />
Booth sales<br />
Economic Impact High economic impact Moderate economic impact Limited economic impact Limited economic impact<br />
Source: HLT Advisory Inc.<br />
6
2. The “Public Assembly” Business<br />
Venues and Cities: Types and Definitions<br />
For the purposes <strong>of</strong> this analysis, venues are grouped into four broad categories reflecting the event<br />
served and other key characteristics. Venues can be adapted to suit a variety <strong>of</strong> events or purpose<br />
built if demand warrants.<br />
Characteristic <strong>Convention</strong> Centre Conference Centre Exhibition Centre/Trade Centre <strong>Convention</strong> Hotel<br />
Event Focus <strong>Convention</strong>s with and without exhibits <strong>Convention</strong>s without exhibits Trade and consumer shows with<br />
limited meeting requirements<br />
Events generating guest room<br />
demand<br />
Building Space<br />
Parameters<br />
Extensive meeting and exhibiton<br />
space<br />
Meeting space<br />
Exhibit space/meeting space varies<br />
by building focus<br />
Meeting space; exhibit space in<br />
largest hotels<br />
Quality audio/visual<br />
Quality audio/visual<br />
Banquet/food and beverage<br />
Banquet/food and beverage<br />
Unique Site Adjacent/proximate hotels Adjacent/proximate hotels Parking <strong>Market</strong> specific<br />
Requirements<br />
Ownership (Typical) Public sector Public sector/some private sector Private and public sector Private sector<br />
Measures <strong>of</strong> Success Economic impact Economic impact and P&L Depends on ownership/governance<br />
structure<br />
Room nights sold<br />
P&L<br />
Source: HLT Advisory Inc.<br />
Cities are <strong>of</strong>ten segmented into “tiers” for classification purposes. The definition <strong>of</strong> “tier” is<br />
subjective and is based on factors such as attractiveness as a convention destination (e.g., air<br />
access, range <strong>of</strong> hotels), supply <strong>of</strong> meeting and exhibition space, population base and destination<br />
awareness. Within a Canadian context, a “Tier 1” city is typically able to attract a number <strong>of</strong><br />
international events (in addition to national and regional events), while a Tier 2 city might focus on<br />
national events and a Tier 3 city primarily regional events. In <strong>Ontario</strong>, Toronto is the only true Tier<br />
1 city. Ottawa, currently a Tier 2 city, has destination attributes attractive to international event<br />
planners but is underserved in terms <strong>of</strong> meeting and exhibition space (although this limitation is<br />
being addressed through the proposed expansion <strong>of</strong> the Ottawa Congress Centre). Virtually all<br />
other <strong>Ontario</strong> cities primarily service the regional market and, as such, are considered Tier 3.<br />
7
2. The “Public Assembly” Business<br />
Economic impact: The focus is convention centres<br />
Most North American convention centres were built and are operated as a means <strong>of</strong> generating economic impact in a<br />
given city and/or region. Economic impact is maximized by giving priority to those events attracting the largest<br />
number <strong>of</strong> out-<strong>of</strong>-town visitors (i.e., delegates <strong>of</strong> regional, national and international conventions). Bottom-line<br />
orientation is <strong>of</strong>ten not a priority, as the “success” <strong>of</strong> many convention facilities is not measured by pr<strong>of</strong>itability for the<br />
convention venue itself but rather on the volume <strong>of</strong> spending at the community level. As a result, convention centres<br />
are <strong>of</strong>ten used as low-cost attractors with competition on a “price” basis becoming much more common. In fact,<br />
some destinations (generally Tier 2 and 3 U.S. cities, but a growing number <strong>of</strong> Canadian cities as well) not only have<br />
the ability to provide the convention centre for free but also are aggressively doing so, provided the economic impact<br />
<strong>of</strong> the event is significant enough.<br />
From the Provincial Government’s perspective, overnight business convention visitors generate significantly more<br />
economic impact than typical overnight visitors.<br />
Overnight Visitors to <strong>Ontario</strong> - 2004<br />
All Overnight<br />
Visitors<br />
Business<br />
Visitors<br />
Business<br />
<strong>Convention</strong><br />
Visitors<br />
Average Length <strong>of</strong> Stay - Nights 2.5 2.2 2.5<br />
Average Expenditure per Person $84 $506 $598<br />
Source: <strong>Ontario</strong> <strong>Ministry</strong> <strong>of</strong> <strong>Tourism</strong><br />
Business convention visitors accounted for 1% <strong>of</strong> the total visits to <strong>Ontario</strong> in 2004 but generated 5% <strong>of</strong> the total<br />
visitor spending.<br />
A delegate spending study released by the Destination <strong>Market</strong>ing Association International (“DMAI”) in 2004 indicated<br />
that convention delegates spend an average <strong>of</strong> $1,449 per event visit. This study is currently being updated and will<br />
be released by DMAI in 2007. A Canadian study, conducted for Meeting Pr<strong>of</strong>essionals International Canada (“MPI”),<br />
is expected in 2008.<br />
8
2. The “Public Assembly” Business<br />
The implications <strong>of</strong> focusing on economic impact<br />
The focus on generating economic impact explains several characteristics <strong>of</strong> the industry, including:<br />
• The tendency towards ownership, and <strong>of</strong>ten management, by local or regional governments.<br />
• Restrictions (sometimes express) on competing for events (i.e., banquets, smaller meetings) that could be<br />
accommodated within privately-owned facilities (i.e., large hotels, privately-or publicly-owned trade show<br />
facilities).<br />
• Exemptions from municipal property taxes.<br />
• Recognition that success is dependent on the development and funding <strong>of</strong> a long-term marketing strategy<br />
given that lead times required to secure conventions are <strong>of</strong>ten 3+ years long—and <strong>of</strong>ten several years<br />
longer for larger, international events.<br />
<strong>Convention</strong>s however, are just one <strong>of</strong> several types <strong>of</strong> events suitable for convention facilities. Trade shows,<br />
consumer shows and smaller-scale conferences and meetings (i.e., the corporate market) may also be held in<br />
convention facilities.<br />
The extent to which these events are targeted by a convention facility, as opposed to a local hotel or<br />
trade/consumer show facility depends on the aggressiveness and mandate <strong>of</strong> the convention centre in a specific<br />
location—as well as the number/quality <strong>of</strong> and the relationships with these other space providers. More<br />
importantly, in markets where sufficient trade and consumer show activity occurs (e.g., Toronto), purpose-built<br />
exhibition facilities have been developed by both the public and private sectors. As trade shows are perceived,<br />
<strong>of</strong>ten correctly so, as not generating the same levels <strong>of</strong> economic impact as conventions dedicated exhibition/trade<br />
centres <strong>of</strong>ten do not receive the same incentives as convention centres (e.g., more limited marketing support; in<br />
the case <strong>of</strong> private trade centres the necessity to pay property tax). The variance in these incentives <strong>of</strong>ten causes<br />
friction within the broader tourism industry.<br />
9
2. The “Public Assembly” Business<br />
North America Supply/Demand Balance<br />
From 2000 to 2006 growth in the supply <strong>of</strong> exhibit space in the United States and Canada exceeded growth in<br />
demand for business-to-business exhibition net square feet (at least 30,000 square feet <strong>of</strong> exhibit space) and<br />
business-to-business convention and exhibition attendance every year with the exception <strong>of</strong> 2005. Over this period<br />
growth in exhibit space supply averaged 4.3%/annum while growth in business-to-business exhibition square foot<br />
usage and business-to-business convention and exhibition attendance averaged 0.4% and 0.8% respectively.<br />
This suggests that supply growth is outpacing demand growth. Further, an additional 8.6 million square feet <strong>of</strong><br />
exhibit space is in the development pipeline representing an additional 10.1% supply growth.<br />
10%<br />
8%<br />
Year-Over-Year Percentage Change<br />
6%<br />
4%<br />
2%<br />
0%<br />
-2%<br />
-4%<br />
-6%<br />
-8%<br />
Source: TSW Research<br />
2000 2001 2002 2003 2004 2005 2006<br />
Exhibit Space Exhibition Net Square Feet <strong>Convention</strong> and Exhibition Attendance<br />
10
2. The “Public Assembly” Business<br />
Where is <strong>Ontario</strong> in the Industry Growth Cycle<br />
Recovery:<br />
• Attendance grows faster than net square footage<br />
• Slow merger and acquisitions market<br />
• Negative national and local press<br />
Peak<br />
<strong>Ontario</strong><br />
Slowdown<br />
1 – 2 Years<br />
Expansion:<br />
• First attendance grows faster than net square footage,<br />
then at about the same rate<br />
• Strong corporate travel and meeting spending<br />
• Hotel rates rise<br />
• More business-to-business events launched<br />
• Positive press – “events are back”<br />
Expansion<br />
3 – 4 Years<br />
Recovery<br />
2 – 3 Years<br />
Peak:<br />
• Net square footage grows increasingly faster than<br />
attendance<br />
• Strong exhibition and event mergers and acquisitions<br />
• Strong corporate travel and meeting spending<br />
• Harder to launch business-to-business events<br />
• Strong convention hotel development<br />
Adapted from TSW Research publication<br />
Slowdown:<br />
• Net square footage demand increases faster than<br />
attendance growth declines<br />
• Marginal new shows cancelled or postponed<br />
11
2. The “Public Assembly” Business<br />
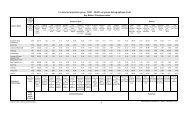
Occupancy Levels at North American Venues<br />
One measure <strong>of</strong> success for a public-assembly building is the utilization or occupancy level (i.e., the number <strong>of</strong> days<br />
in any given year that the venue, or parts <strong>of</strong> the venue are used). While this measure demonstrates activity—and an<br />
obvious extension to revenue and bottom-line pr<strong>of</strong>itability levels—within the venue, occupancy does not necessarily<br />
demonstrate “success”… particularly if success is defined as generating economic impact within the host community.<br />
In this case, success is more a function <strong>of</strong> the type <strong>of</strong> event than the quantum.<br />
Nevertheless, utilization is an effective measure when looking at industry-wide trends. The theoretical maximum<br />
occupancy rates for exhibit halls is thought to be around 70% as a result <strong>of</strong> the requirement <strong>of</strong> move-in and moveout<br />
days for trade shows and consumer shows. A more likely (and efficient) occupancy level is thought to be in the<br />
50% to 60% range. Greater occupancy levels may be achieved with banquet and meeting spaces. An annual study<br />
by PricewaterhouseCoopers focusing on North American venues (with an emphasis on convention centres), “2006<br />
<strong>Convention</strong> Center <strong>Report</strong>”, suggests average exhibit hall occupancies in the 50% to 60% range for those venues<br />
located in gateway cities (major U.S. and Canadian cities with excellent air access), and even lower levels for regional<br />
venues.<br />
The occupancy levels at the four major <strong>Ontario</strong> convention centres (Hamilton <strong>Convention</strong> Centre, London <strong>Convention</strong><br />
Centre, Ottawa Congress Centre and Metro Toronto <strong>Convention</strong> Centre) suggest somewhat stronger business levels, a<br />
function, in part, <strong>of</strong> the operating mandates <strong>of</strong> Canadian venues to include more bottom-line accountability (and<br />
therefore more “local” pr<strong>of</strong>it-based events) as opposed to pure economic impact generation.<br />
Occupancy Rates* at <strong>Ontario</strong> <strong>Convention</strong> Venues<br />
2004 2005 2006<br />
Exhibit Hall Occupancy 50.4% 57.1% 62.0%<br />
Meeting Room Occupancy 46.8% 48.1% 51.6%<br />
Ballroom Occupancy 43.5% 44.5% 54.7%<br />
Total 49.4% 54.5% 59.6%<br />
Source: <strong>Ontario</strong> <strong>Convention</strong> Venues<br />
* Weighted Average<br />
12
2. The “Public Assembly” Business<br />
Implications for <strong>Ontario</strong><br />
The public assembly business can be segmented into four broad types <strong>of</strong> events specifically: conventions,<br />
conferences, trade shows and consumer shows. A variety <strong>of</strong> venue types service these events including purpose -<br />
built buildings such as convention and trade centres as well as buildings adapted to meet demand such as arenas<br />
used to service trade and consumer shows.<br />
The justification for public ownership (and most <strong>of</strong>ten in Canada, management) <strong>of</strong> convention centres is the creation<br />
<strong>of</strong> economic impact for the broader community. On the other hand, the private-sector’s involvement in publicassembly<br />
buildings occurs when the operating environment produces an opportunity for pr<strong>of</strong>it-based events such as<br />
trade and consumer shows. Trade and consumer shows generate pr<strong>of</strong>it for the event producer (and indirectly to<br />
venue owner) based on size and scale <strong>of</strong> the exhibition (the “sellers”) and the ability to generate visitors to the event<br />
(the “buyers.”). In the case <strong>of</strong> convention hotels, the pr<strong>of</strong>it-generating element is hotel room night sales.<br />
As a result, a privately-owned venue will most likely prioritize events that maximize revenue to the venue. Most<br />
<strong>of</strong>ten these events are local or regional but in some cases (such as Toronto) have the potential to draw from a much<br />
wider area. A publicly-owned venue will prioritize events that maximize economic impact, such as conventions.<br />
<strong>Convention</strong>s are more likely to bring visitors to the host community; economic impacts are generated at the local,<br />
provincial and federal level although not all impacts are incremental. For the purposes <strong>of</strong> this analysis, consideration<br />
is given to economic impact at the provincial level (i.e., the ability to drive incremental visitation to <strong>Ontario</strong>).<br />
The public assembly business has historically been successful in generating economic impact for <strong>Ontario</strong>. In 2004<br />
(the last year for which full data is available), the convention business segment accounted for 1% <strong>of</strong> the total<br />
visitation to <strong>Ontario</strong> yet generated 5% <strong>of</strong> the tourist spending. <strong>Ontario</strong> has recognized the importance <strong>of</strong> the public<br />
assembly market as evidenced by the development and renewal <strong>of</strong> the <strong>Convention</strong> Development Fund.<br />
<strong>Ontario</strong> <strong>of</strong>fers a range <strong>of</strong> destinations and venues for the full array <strong>of</strong> event types. Within the convention<br />
marketplace, Toronto and Ottawa hold the greatest potential to create incremental visitation given current (and<br />
potential) size and scale <strong>of</strong> facilities as well as destination attractiveness factors. Niagara Falls and Windsor <strong>of</strong>fer<br />
unique characteristics given the border and tourism focus. Hamilton and London have more regionally-focused<br />
opportunities. All <strong>of</strong> these destinations have a degree <strong>of</strong> potential in the trade and consumer show market.<br />
13
3. Major <strong>Ontario</strong> Venues<br />
Introduction<br />
The balance <strong>of</strong> this report focuses primarily on the large convention and exhibition/trade centres in major cities<br />
across the province. The majority <strong>of</strong> these are publicly owned and reflect the mandate and focus <strong>of</strong> the public<br />
shareholder (either the municipal or provincial governments). The publicly-owned venues under consideration<br />
(excluding proposed venues) include:<br />
• Direct Energy Centre (former National Trade Centre), Toronto<br />
• Hamilton <strong>Convention</strong> Centre<br />
• Lansdowne Park (Ottawa)<br />
• London <strong>Convention</strong> Centre<br />
• Metro Toronto <strong>Convention</strong> Centre<br />
• Ottawa Congress Centre<br />
Privately-owned venues include:<br />
• Toronto Congress Centre<br />
• Toronto International Centre<br />
On an overall basis we have also taken into account the numerous convention hotels in various <strong>Ontario</strong> destinations<br />
as well as several local convention/meeting/exhibit facilities primarily focused on a local market.<br />
14
3. Major <strong>Ontario</strong> Venues<br />
Mandates <strong>of</strong> Publicly-Owned <strong>Ontario</strong> Venues<br />
The delivery <strong>of</strong> economic impact is a common focus among the publicly-owned <strong>Ontario</strong> venue mission statements.<br />
Each venue also addresses local issues and objectives, including a bottom-line orientation.<br />
City Full Name <strong>of</strong> Centre Mission Statement<br />
Hamilton Hamilton <strong>Convention</strong> Centre - To maintain, operate, manage and promote the Hamilton <strong>Convention</strong> Centre, Hamilton Place Theatre and Copps Coliseum on Behalf <strong>of</strong> the<br />
City <strong>of</strong> Hamilton.<br />
- To positively impact the economic health <strong>of</strong> the area through the increased use <strong>of</strong> hotels, restaurants, retail shops and service by using the<br />
three facilities as the catalyst to retain local spending and attract people from outside the region.<br />
- To maximize the use <strong>of</strong> the three facilities while providing programming that reflects local interests and contributes to the quality <strong>of</strong> life.<br />
- Via effective, efficient management to constantly work towards the reduction <strong>of</strong> the annual municipal contribution by corporation <strong>of</strong> the City<br />
<strong>of</strong> Hamilton.<br />
- All <strong>of</strong> this is to be achieved while pursuing excellence <strong>of</strong> management and service in a manner that fosters local pride and enhances the<br />
city’s reputation and image.<br />
London London <strong>Convention</strong> Centre The London <strong>Convention</strong> Centre will be recognized by the community as an economic generator for the City <strong>of</strong> London.<br />
Core values:<br />
1) Our associates and our partners are our greatest asset.<br />
2) Operate in an ethical and trustworthy manner.<br />
3) Inspire innovation, creativity and personal growth.<br />
4) Demonstrate excellence in everything we do.<br />
Ottawa Ottawa Congress Centre In cooperation with the National Capital Region's tourism industry partners, the mission <strong>of</strong> the Ottawa Congress Centre is to operate a fiscally<br />
responsible efficient and effective first-class multipurpose convention/meeting facility through the development <strong>of</strong> existing and new niche<br />
markets which will place Canada's Capital Region on the leading edge <strong>of</strong> the convention industry in the 21st Century.<br />
Ottawa Lansdowne Park To be operated as a multi-purpose sports and entertainment facility catering to the needs <strong>of</strong> both local citizens and visitors and conduct such<br />
activities in a manner which minimizes impacts on adjacent communities.<br />
Toronto<br />
Toronto<br />
Metro Toronto <strong>Convention</strong><br />
Centre<br />
Direct Energy Centre<br />
(one <strong>of</strong> four operations at<br />
Exhibition Place)<br />
The mission <strong>of</strong> the Metro Toronto <strong>Convention</strong> Centre is to operate a world class convention centre in a manner that:<br />
- generates significant economic benefit to the community;<br />
- provides a showcase for conventions, trade shows, public shows, meetings, and food and beverage events;<br />
- operates on a cost recovery commercial basis; and<br />
- is managed in a manner consistent with an Operational Enterprise Agency <strong>of</strong> the Province.<br />
The mission <strong>of</strong> Exhibition Place is to:<br />
- provide an opportunity for business stimiluation and economic development in the community;<br />
- provide a focus for public celebration and events;<br />
- preserve the 22 architecturally and historically significant structures on the grounds; and<br />
- provide a world class venue for trade and consumer shows and major city events and celebrations.<br />
15
3. Major <strong>Ontario</strong> Venues<br />
Pr<strong>of</strong>ile <strong>of</strong> Publicly-Owned <strong>Ontario</strong> Venues<br />
Owned/controlled by<br />
Metro Toronto <strong>Convention</strong> Centre<br />
Province <strong>of</strong> <strong>Ontario</strong><br />
Direct Energy Centre (National Trade Centre)<br />
City <strong>of</strong> Toronto<br />
Governance structure<br />
2006 Revenue<br />
Operated by Metropolitan Toronto<br />
<strong>Convention</strong> Centre Corporation<br />
(single-purpose corporation)<br />
$57.9 million<br />
Operated by Exhibition Place (a singlepurpose<br />
corporation)<br />
n/a<br />
Sales & marketing budget*<br />
$3.1 million<br />
$330,000<br />
<strong>Market</strong>ing focus<br />
Expansion plans<br />
<strong>Convention</strong>s generating significant<br />
economic impact (international,<br />
united states and national<br />
corporate and association groups)<br />
No current expansion plans<br />
Locally and regionally produced trade and<br />
consumer shows<br />
Conference venue—addition <strong>of</strong> 90,000 s.f. <strong>of</strong><br />
rentable meeting space by 2009<br />
300-500 room hotel (some meeting space)<br />
projected for 2010. Future expansion<br />
2015/2017 additional 200,000 s.f. exhibit<br />
space and 100,000 square feet <strong>of</strong> meeting<br />
space<br />
*The <strong>Tourism</strong> Toronto sales and marketing budget (i.e., the amount dedicated to marketing “Toronto” as a convention/trade show destination) is $8.2 million<br />
16
3. Major <strong>Ontario</strong> Venues<br />
Pr<strong>of</strong>ile <strong>of</strong> Publicly-Owned <strong>Ontario</strong> Venues (cont’d.)<br />
Owned/controlled by<br />
Governance structure<br />
2006 Revenue<br />
Sales & marketing budget<br />
<strong>Market</strong>ing focus<br />
Expansion plans<br />
Ottawa Congress Centre<br />
Province <strong>of</strong> <strong>Ontario</strong><br />
Operated by the Ottawa Congress Centre,<br />
single-purpose corporation<br />
$10.2 million<br />
$1.7 million<br />
Post-expansion marketing strategy under<br />
development – will focus on new target<br />
markets (U.S. and international)<br />
Announced facility closure in September<br />
2008, new facility to open in 2011<br />
New facility pr<strong>of</strong>ile (exhibit, meeting and<br />
ballroom space) to be announced. Funding<br />
commitments have been announced by the<br />
federal and provincial governments.<br />
Lansdowne Park<br />
City <strong>of</strong> Ottawa<br />
Operated by City <strong>of</strong> Ottawa Business<br />
Transformation Services (City<br />
Department)<br />
$4.5 million<br />
Spend between $20,000 and $25,000<br />
Trade and consumer shows, primarily<br />
local and regional clientele<br />
Currently, the City is conducting an<br />
international design competition for the<br />
redevelopment <strong>of</strong> Lansdowne Park.<br />
The redevelopment may or may not<br />
include a trade centre component.<br />
Note: The <strong>Tourism</strong> Ottawa MC&IT sales and marketing budget is $1.5 million<br />
17
3. Major <strong>Ontario</strong> Venues<br />
Pr<strong>of</strong>ile <strong>of</strong> Publicly-Owned <strong>Ontario</strong> Venues (cont’d.)<br />
Owned/controlled by<br />
Governance structure<br />
2006 Revenue<br />
Sales & marketing budget<br />
<strong>Market</strong>ing focus<br />
Expansion plans<br />
Hamilton <strong>Convention</strong> Centre<br />
City <strong>of</strong> Hamilton<br />
Hamilton Entertainment and<br />
<strong>Convention</strong> Facilities Inc.<br />
(“HECFI”), multi-purpose<br />
corporation. HECFI includes the<br />
Hamilton <strong>Convention</strong> Centre,<br />
Hamilton Place and Copps<br />
Coliseum.<br />
$3.4 million<br />
$754,000<br />
Regional and provincial markets,<br />
one- or two-day events with<br />
minimal hotel room requirements<br />
No current expansion plans<br />
London <strong>Convention</strong> Centre<br />
City <strong>of</strong> London<br />
Incorporated company with arms length<br />
reporting to the City <strong>of</strong> London, singlepurpose<br />
corporation<br />
$3.9 million<br />
$517,000<br />
Provincial associations and corporate<br />
meetings generating hotel demand<br />
No current expansion plans<br />
18
3. Major <strong>Ontario</strong> Venues<br />
Pr<strong>of</strong>ile <strong>of</strong> <strong>Ontario</strong> Privately-Owned <strong>Ontario</strong> Venues<br />
Owned/controlled by<br />
Toronto Congress Centre<br />
Toronto-based ownership group<br />
Toronto International Centre<br />
Toronto-based ownership group<br />
Sales & marketing<br />
<strong>Market</strong>ing focus<br />
Expansion plans<br />
Do not actively participate with<br />
<strong>Tourism</strong> Toronto<br />
Locally produced trade and consumer<br />
shows<br />
Significant food and beverage event<br />
business<br />
300,000 square foot expansion under<br />
construction (completion early 2008)<br />
Planning a 25,000 square foot<br />
ballroom, additional exhibit space as<br />
well as a 400 to 500 room hotel<br />
Do not participate with <strong>Tourism</strong> Toronto<br />
but expect to do so once the conference<br />
centre is completed<br />
Locally produced trade and consumer<br />
shows<br />
Secondary market segment <strong>of</strong> meetings,<br />
concerts as well as ethnic and religious<br />
events<br />
A conference centre is under construction<br />
that will <strong>of</strong>fer 23,000 square feet <strong>of</strong><br />
meeting space.<br />
19
3. Major <strong>Ontario</strong> Venues<br />
<strong>Ontario</strong> Venues<br />
The following analysis focuses on the major publicly-owned convention and trade centres in <strong>Ontario</strong> as well as<br />
selected major privately-owned trade centres and convention hotels.<br />
Identified but not included in the analysis are:<br />
• privately-owned banquet and conference centres;<br />
• facilities that <strong>of</strong>fer exhibit space but whose primary use is another purpose (i.e., sports facilities such as<br />
the Ricoh Centre, exhibitions such as the Western Fair in London and unique venues such as the Elgin<br />
and Winter Garden theatres); and<br />
• hotels with less than 20,000 square feet <strong>of</strong> meeting space.<br />
These smaller venues play a role in accommodating a variety <strong>of</strong> event types but in most cases lack the critical mass<br />
to generate or assist in generating incremental visitation to <strong>Ontario</strong>.<br />
20
4. Supply<br />
Introduction<br />
The field <strong>of</strong> competition for <strong>Ontario</strong> venues includes a broad range <strong>of</strong> <strong>Ontario</strong> facilities as well as venues located<br />
across Canada and North America. The size, scale and origin <strong>of</strong> attendees have the greatest impact on the<br />
destination decision. Suffice it to say, that within a North American context competition is substantial for all<br />
manner <strong>of</strong> event types. Demand characteristics are discussed in more detail in the following chapter.<br />
As has been the case over the past few years, the growth in both the number and size <strong>of</strong> North American<br />
convention centres continues, although at a much slower rate than experienced through the 1990’s. Supply trends<br />
<strong>of</strong> note to <strong>Ontario</strong> venues include:<br />
• Recognition by many in the North American convention ownership/management sector, that supply<br />
growth has outpaced demand. The effect <strong>of</strong> the supply – demand imbalance is most noticeable in<br />
those destinations lacking key attributes sought by meeting planners. Specifically, an adequate supply<br />
<strong>of</strong> nearby hotel rooms, convenient and cost effective air access, destination animation and appeal<br />
necessary to drive attendance.<br />
• Price-based competition, most notably from Tier 3 cities that do not have the destination attributes to<br />
compete on merit.<br />
• Considerable growth in “self-contained” convention centres where all convention components (i.e.,<br />
hotel rooms, exhibit halls, meeting space, ballroom and entertainment) are provided under one ro<strong>of</strong>.<br />
Several such facilities exist in Las Vegas (Sands Expo – the Venetian and Mandalay Bay) and are the<br />
exclusive product <strong>of</strong>fering <strong>of</strong> dedicated hospitality operators such as Gaylord (Nashville, Orlando, Dallas,<br />
Washington D.C.). These facilities compete for events <strong>of</strong> the size and larger than what can be<br />
accommodated at <strong>Ontario</strong> convention venues. While these self-contained venues appeal to some,<br />
universal acceptance <strong>of</strong> this option by convention/meeting planners is still very much in doubt.<br />
The following pages provide analysis <strong>of</strong> the supply pr<strong>of</strong>ile with a focus on North American convention centre and<br />
trade/exhibition centre venues.<br />
21
4. Supply<br />
Growth in North American Exhibit Space (1996 to 2007)<br />
Since 1996, the amount <strong>of</strong> exhibit space in Canada and United States venues has increased 38.5% from 62.0<br />
million square feet to 85.9 million square feet. This represents a compound average growth rate <strong>of</strong> 3.0%. Exhibit<br />
space is the “default” measure <strong>of</strong> venue growth across convention centres and exhibition/trade centres. Meeting,<br />
banquet and associated support spaces are not included in this total but will be accommodated in each venue<br />
based on the market focus (e.g., conventions, conferences, trade shows) <strong>of</strong> the venue.<br />
SF (000,000's)<br />
100<br />
80<br />
60<br />
40<br />
20<br />
62.0 63.0 63.0 63.4 65.5 67.6<br />
72.4<br />
77.2<br />
80.5 82.3<br />
85.1 85.9<br />
0<br />
1996 1997 1998 1999 2000 2001 2002 2003 2004 2005 2006 2007<br />
Year<br />
Source: TSW Research<br />
22
4. Supply<br />
Venue Breakdown by Total Exhibit Area<br />
Square Feet <strong>of</strong> Exhibit Space<br />
8%<br />
15%<br />
TSW Research maintains a comprehensive<br />
inventory <strong>of</strong> convention centres, trade centres<br />
and hotels with meeting space across North<br />
America. Of the 569 venues in this inventory,<br />
the majority <strong>of</strong>fer between 50,000 and 499,999<br />
square feet <strong>of</strong> exhibit space. Less than 40<br />
venues <strong>of</strong>fer more then 500,000 square feet <strong>of</strong><br />
exhibit space (including the Metro Toronto<br />
<strong>Convention</strong> Centre).<br />
45%<br />
32%<br />
25,000 to 49,999 50,000 to 99,999<br />
100,000 to 499,999 Over 500,000<br />
Source: Tradeshow Week<br />
23
4. Supply<br />
Exhibit Space within <strong>Convention</strong> Centres<br />
SF(000,000's)<br />
90<br />
80<br />
70<br />
60<br />
50<br />
40<br />
30<br />
<strong>Convention</strong> centres, for the<br />
purposes <strong>of</strong> this study defined as<br />
venues with a ratio <strong>of</strong> exhibit space<br />
to meeting/ballroom space <strong>of</strong> 4:1 or<br />
less, account for approximately 25%<br />
<strong>of</strong> the total exhibit space inventory<br />
in Canada and the United States.<br />
The remainder <strong>of</strong> the exhibit space<br />
is located in purpose-built trade<br />
centres or in hotels with meeting<br />
space.<br />
20<br />
10<br />
0<br />
2003 2004 2005 2006 2007<br />
Year<br />
Source: Tradeshow Week<br />
<strong>Convention</strong> Centres<br />
Other Venues<br />
24
4. Supply<br />
Projected Increases in North American Exhibit Space<br />
Total Exhibit Space in Canada and the United Space in all venue types (convention centres, trade centres and<br />
convention hotels) is projected to increase by 9.1% or 7.8 million square feet. Exhibit Space will increase by 5.5<br />
million square feet or 6.4% by 2010. The majority <strong>of</strong> this growth will come from the expansion <strong>of</strong> existing venues.<br />
1,600<br />
1,529<br />
1,441<br />
Millions <strong>of</strong> Square Feet<br />
1,400<br />
1,200<br />
1,000<br />
800<br />
600<br />
400<br />
867<br />
396<br />
1,126<br />
153<br />
1,164<br />
1,116<br />
200<br />
0<br />
2007-2008 2008-2009 2009-2010 2010+<br />
Year<br />
Expansions<br />
New Builds<br />
Source: TSW Research<br />
25
4. Supply<br />
Growth in supply <strong>of</strong> exhibit space versus hotel rooms<br />
% Change<br />
8.0%<br />
6.0%<br />
4.0%<br />
2.0%<br />
0.0%<br />
1998 1999 2000 2001 2002 2003 2004 2005 2006<br />
-2.0%<br />
Year<br />
Growth in Exhibit Space (sf)<br />
Growth in Hotel Supply (rooms)<br />
Source: TSW Research, Smith Travel Research, HLT Advisory Inc.<br />
Since 2000, the growth rate <strong>of</strong> exhibit<br />
space has exceeded the growth rate <strong>of</strong><br />
hotel rooms in the United States and<br />
Canada. Exhibit and meeting space can<br />
generate demand for hotel rooms, <strong>of</strong>ten<br />
during “shoulder” seasons.<br />
Smith Travel Research reports on lodging<br />
industry operating data. In 2006, hotel<br />
occupancy was 63.4% in the United<br />
States and 59.4% in Canada. Functional<br />
capacity for hotels is considered to be<br />
about 75% occupancy.<br />
Since 2000 a correlation can be seen in<br />
the growth <strong>of</strong> exhibit space (mostly<br />
public sector) and the addition <strong>of</strong> new<br />
hotel rooms (mostly private-sector<br />
driven), although the proportion <strong>of</strong><br />
exhibit space growth is greater on a<br />
percentage basis.<br />
26
4. Supply<br />
Growth in Hotel Demand versus Exhibition Attendance<br />
8.0%<br />
6.0%<br />
4.0%<br />
A similar correlation appears to<br />
exist between growth patterns<br />
in hotel demand and exhibition<br />
attendance.<br />
% Change<br />
2.0%<br />
0.0%<br />
-2.0%<br />
1998 1999 2000 2001 2002 2003 2004 2005 2006<br />
-4.0%<br />
-6.0%<br />
-8.0%<br />
Source: TSW Research, Smith Travel Research, HLT Advisory Inc.<br />
Year<br />
Change in <strong>Convention</strong> & Exhibition Attendance<br />
Change in Hotel Demand<br />
27
4. Supply<br />
Projected North American Meeting Space Growth<br />
Square Feet (thousands)<br />
2,000<br />
1,800<br />
1,600<br />
1,400<br />
1,200<br />
1,000<br />
800<br />
600<br />
400<br />
200<br />
0<br />
'07 - '08 '08 - '09 '09 - 10 2010+<br />
The TSW Research database indicates 3.8<br />
million square feet <strong>of</strong> meeting space in the<br />
development pipeline (for all venue types –<br />
convention centres, trade centres and<br />
convention hotels), representing an increase<br />
<strong>of</strong> 15.1% over current levels.<br />
The amount <strong>of</strong> meeting space that planners<br />
require is increasing (i.e., conventions desire<br />
an increasing number <strong>of</strong> breakout rooms,<br />
trade centres such as the Direct Energy<br />
Centre and Toronto Congress Centre are<br />
adding meeting space in response to<br />
exhibition planner demand). Meeting space<br />
is being added to the TSW Research<br />
development pipeline at approximately twice<br />
the rate <strong>of</strong> exhibit Space.<br />
Expansion<br />
New Build<br />
Source: Tradeshow Week<br />
28
4. Supply<br />
Inventory <strong>of</strong> Major Canadian <strong>Convention</strong> Centres<br />
The table below summarizes the members <strong>of</strong> the <strong>Convention</strong> Centres <strong>of</strong> Canada, an industry<br />
association representing the largest fifteen publicly-owned convention centres in Canada.<br />
Venue<br />
Exhibit Space<br />
(sf)<br />
Meeting/<br />
Ballroom<br />
Space (sf)<br />
Total Exhibit/<br />
Meeting/ Ballroom<br />
Space (sf)<br />
Exhibit Space to<br />
Meeting/Ballroom<br />
Space<br />
Downtown<br />
Hotel Rooms<br />
Upon completion <strong>of</strong> its expansion in 2009, the Vancouver <strong>Convention</strong> and Exhibition Centre will be the second<br />
largest convention centre in Canada with over 418,000 square feet <strong>of</strong> exhibit, meeting and ballroom space.<br />
Ratio <strong>of</strong> Total<br />
Space to<br />
Hotel Rooms<br />
Metro Toronto <strong>Convention</strong> Centre 453,648 122,227 575,875 3.7 16,616 34.7<br />
Palais des Congrés de Montréal 199,052 130,730 329,782 1.5 14,044 23.5<br />
Québec City <strong>Convention</strong> Centre 75,000 94,500 169,500 0.8 3,922 43.2<br />
Shaw Conference Centre 105,000 37,700 142,700 2.8 4,682 30.5<br />
Winnipeg <strong>Convention</strong> Centre 78,000 59,218 137,218 1.3 4,199 32.7<br />
Vancouver <strong>Convention</strong> & Exhibition Centre 91,205 41,469 132,674 2.2 14,849 8.9<br />
Calgary TELUS <strong>Convention</strong> Centre 47,047 42,140 89,187 1.1 9,935 9.0<br />
Ottawa Congress Centre 54,113 14,941 69,054 3.6 7,026 9.8<br />
Hamilton <strong>Convention</strong> Centre 19,662 32,652 52,314 0.6 1,331 39.3<br />
World Trade and <strong>Convention</strong> Centre 20,000 30,000 50,000 0.7 2,671 18.7<br />
London <strong>Convention</strong> Centre - 43,357 43,357 n/a 1,355 32.0<br />
Penticton Trade & <strong>Convention</strong> Centre 13,590 21,054 34,644 0.6 1,651 21.0<br />
TELUS Whistler Conference Centre - 27,470 27,470 n/a 5,936 4.6<br />
Victoria Conference Centre 14,190 9,210 23,400 1.5 5,961 3.9<br />
Prince George Civic Centre 18,000 4,800 22,800 3.8 1,621 14.1<br />
Source: HLT Advisory Inc, convention centres<br />
29
4. Supply<br />
Inventory <strong>of</strong> Major <strong>Ontario</strong> <strong>Convention</strong> / Trade Centres<br />
The summary <strong>of</strong> major <strong>Ontario</strong> venues includes four <strong>Convention</strong> Centres <strong>of</strong> Canada venues as well as two<br />
smaller conference centres in Blue Mountain and Burlington. The listing <strong>of</strong> trade centres includes not only<br />
those purpose-built venues (such as the Toronto International Centre and Toronto Congress Centre) but<br />
also arenas, stadiums and multi-purpose structures <strong>of</strong>ten used for trade and consumer shows.<br />
Venue City Rentable Space Largest Room<br />
<strong>Convention</strong> Centres<br />
Burlington <strong>Convention</strong> Centre Burlington 16,647 12,300<br />
Hamilton <strong>Convention</strong> Centre Hamilton 52,314 19,662<br />
Village at Blue Mountain Conference Centre Collingwood 59,248 29,250<br />
London <strong>Convention</strong> Centre London 62,656 33,033<br />
Ottawa Congress Centre Ottawa 67,794 42,638<br />
Metro Toronto <strong>Convention</strong> Centre Toronto 575,875 260,000<br />
Trade Centres<br />
Scotiabank Place Ottawa 9,020 7,350<br />
Kitchener Memorial Auditorium Complex Kitchener 98,916 13,400<br />
Lansdowne Park/Ottawa Civic Centre Complex Ottawa 114,000 36,000<br />
Western Fair Association Event Centre London 114,500 57,000<br />
Copps Coliseum Hamilton 117,000 87,000<br />
International Centre Mississauga 499,836 100,000<br />
Toronto Congress Centre Toronto 560,000 500,000<br />
Direct Energy Centre Toronto 829,563 125,000<br />
Rogers Centre Toronto 200,000<br />
Source: TSW Research, HLT Advisory Inc.<br />
30
4. Supply<br />
<strong>Ontario</strong> <strong>Convention</strong> Hotels<br />
<strong>Convention</strong> hotels play a significant role in servicing smaller, <strong>of</strong>ten corporate meeting demand.<br />
Venue City Rentable Space Largest Room Hotel Rooms<br />
Ottawa<br />
Brookstreet Resort Ottawa 20,446 5,188 276<br />
Westin Ottawa Ottawa 24,202 16,942 495<br />
Ottawa Marriott Ottawa 24,700 6,431 480<br />
Crowne Plaza Ottawa Ottawa 25,844 9,840 411<br />
Fairmont Chateau Laurier Ottawa 33,675 5,886 429<br />
Toronto/Central<br />
Hilton London London 25,995 12,300 323<br />
Kingbridge Centre King City 26,000 3,329 124<br />
Renaissance Hotel Toronto Airport Toronto 26,000 7,140 249<br />
Delta Meadowvale Resort and Conference Centre Mississauga 31,723 9,100 374<br />
Hilton Suites - Toronto Markham Markham 34,162 14,040 332<br />
Holiday Inn on King Toronto 34,290 8,964 425<br />
Best Western Parkway Hotel/Sheraton Parkway Richmond Hill 35,000 10,030 439<br />
Deerhurst Resort Huntsville 40,000 8,064 400<br />
Doubletree International Plaza Hotel Toronto 42,156 14,850 433<br />
Nottawasaga Inn, <strong>Convention</strong> Centre & Golf Resort Alliston 46,683 21,600 269<br />
Fairmont Royal York Toronto 61,354 12,843 1,365<br />
Westin Harbour Castle Toronto 70,000 24,991 977<br />
Sheraton Centre Hotel Toronto 116,000 20,213 1,377<br />
Niagara Falls/South<br />
Sheraton Fallsview Hotel & Conference Centre Niagara Falls 22,788 7,776 295<br />
Sheraton on the Falls Niagara Falls 44,010 14,190 670<br />
Delawana Inn Honey Harbour 55,000 4,800 154<br />
Source: TSW Research, HLT Advisory Inc.<br />
Note: Includes Hotels with at least 20,000 square feet <strong>of</strong> rentable square feet <strong>of</strong> meeting and exhibit space.<br />
31
4. Supply<br />
New and Proposed Canadian Public-Assembly Venues<br />
Several existing venues are undergoing expansion while several other destinations have proposed to<br />
develop convention or trade show venues. The lead time from planning to construction to opening<br />
can be substantial, particularly with publicly-funded venues, given the need for political approval.<br />
As an example, demand studies verified a need to expand the Vancouver <strong>Convention</strong> and Exhibition<br />
Centre as early as 1994 but construction did not commence until 2003 with opening expected in<br />
2009.<br />
Venue City Completion Exhibit Space Meeting/Ballroom Other Total Space<br />
Under Construction<br />
Vancouver Island Conference Centre Nanaimo 2008 0 19,597 9,054 28,651<br />
Victoria Conference Centre Crystal Garden (Expansion) Victoria 2008 0 25,000 0 25,000<br />
Toronto International Centre Toronto 2008 0 23,000 0 23,000<br />
Casino Windsor Windsor 2008 39,500 34,299 4,208 78,007<br />
Toronto Congress Centre Toronto 2008 300,000 0 0 300,000<br />
Vancouver <strong>Convention</strong> and Exhibition Centre (Expansion) Vancouver 2009 222,860 114,091 127,000 463,951<br />
Proposed<br />
Barrie Waterfront Barrie TBD<br />
150 residential/120 hotel units, 12,000 square feet<br />
Calgary TELUS <strong>Convention</strong> Centre (Expansion) Calgary TBD<br />
<strong>Market</strong> assessment underway<br />
Charlottetown Charlottetown TBD<br />
20,000 to 25,000 square feet - under study<br />
Shaw <strong>Convention</strong> Centre Edmonton TBD<br />
<strong>Market</strong> assessment underway<br />
Moncton Moncton TBD<br />
20,000 to 25,000 square feet - under study<br />
Niagara Falls <strong>Convention</strong> Centre Niagara Falls 2011 100,000 30,700 0 130,700<br />
Ottawa Congress Centre (Expansion) Ottawa 2011 64,993 83,744 51,344 200,081<br />
Saint John Saint John TBD<br />
<strong>Market</strong> assessment underway<br />
Toronto Congress Centre - Phase II Expansion Toronto TBD 0 25,000 0 25,000<br />
Toronto Congress Centre - Phase III Expansion Toronto TBD<br />
Additional exhibit space<br />
Winnipeg <strong>Convention</strong> Centre Winnipeg TBD<br />
<strong>Market</strong> assessment underway<br />
York Region York Region TBD <strong>Tourism</strong> needs Assessment underway<br />
Source: HLT Advisory Inc.<br />
32
4. Supply<br />
Private-Sector Involvement in Venue Development<br />
Demand for local and regional meetings, trade shows and consumer shows is <strong>of</strong>ten identified and<br />
serviced by the private sector. In addition to the Toronto International Centre and Toronto<br />
Congress Centre, the two largest privately-owned venues in <strong>Ontario</strong>, several smaller venues have<br />
been created over the past decade to service local/regional demand such as:<br />
• Oakville Conference Centre—A privately-owned conference centre with over 10,000 sq. ft.<br />
<strong>of</strong> exhibit space.<br />
• Burlington <strong>Convention</strong> Centre—A 16,600 sq. ft. centre including 12,300 sq. ft. <strong>of</strong> exhibit<br />
space and 1,500 sq. ft. <strong>of</strong> meeting space. This venue targets the Oakville/Burlington/<br />
Hamilton corporate market for business and social events.<br />
• Paradise Banquet and <strong>Convention</strong> Centre—A conference centre/banquet hall with 50,000<br />
square feet <strong>of</strong> rentable space. Facilities similar to Paradise Banquet and <strong>Convention</strong><br />
Centre, although smaller, operate in various forms in a great many centres across <strong>Ontario</strong>.<br />
Virtually none <strong>of</strong> the events hosted in these venues generate economic impact beyond the host<br />
community, nor is there such an expectation. Local and regional business is easier to identify,<br />
target and service; support from the destination marketing organization is not required nor is<br />
coordination among local hotels as the majority <strong>of</strong> events are “same-day” or, even if multiple days,<br />
are focused on attendees within easy driving distance.<br />
As the private sector enters this marketplace, smaller events may be drawn away from publiclyowned<br />
venues. While private sector investment in and operation <strong>of</strong> smaller-scale, public-assembly<br />
venues should be viewed as a positive sign <strong>of</strong> a strong tourism/hospitality industry, there will be<br />
some negative impact on the revenue- (and pr<strong>of</strong>it-) generating ability <strong>of</strong> the public venues.<br />
Arguably, this allows the public venues more resources to focus on economic impact-generating<br />
events by freeing up time and resources, but will also affect pr<strong>of</strong>itability. A factor the public<br />
shareholder must recognize and take into account when evaluating performance.<br />
33
4. Supply<br />
<strong>Ontario</strong> <strong>Convention</strong> Centres in a North American Context<br />
Only one <strong>Ontario</strong> facility, the Metro Toronto <strong>Convention</strong> Centre, is included in the Top Ten listing <strong>of</strong> TSW<br />
Research’s database <strong>of</strong> 141 North American convention centres. The venues in Ottawa, London and Hamilton are<br />
among the smallest North American convention venues.<br />
Top <strong>Convention</strong> Centres by Total Exhibit Space<br />
Rank Facility City State/Province Total Exhibit Space<br />
1 Orange County <strong>Convention</strong> Center Orlando Florida 2,053,820<br />
2 Cobo Center Detroit Michigan 700,000<br />
3 San Diego <strong>Convention</strong> Center San Diego California 616,363<br />
4 Colorado <strong>Convention</strong> Center Denver Colorado 584,000<br />
5 Boston <strong>Convention</strong> & Exhibition Center Boston Massachusetts 516,000<br />
6 Miami Beach <strong>Convention</strong> Center Miami Beach Florida 502,848<br />
7 America's Center St. Louis Missouri 502,000<br />
8 Indiana <strong>Convention</strong> Center & RCA Dome Indianapolis Indiana 493,123<br />
9 Metro Toronto <strong>Convention</strong> Centre Toronto <strong>Ontario</strong> 453,648<br />
10 Moscone Center San Francisco California 442,000<br />
106 Ottawa Congress Centre Ottawa <strong>Ontario</strong> 54,113<br />
128 London <strong>Convention</strong> Centre London <strong>Ontario</strong> 33,033<br />
139 Hamilton <strong>Convention</strong> Centre Hamilton <strong>Ontario</strong> 19,622<br />
Source: TSW Research<br />
34
4. Supply<br />
<strong>Ontario</strong> Trade Centres in a North American Context<br />
Eight <strong>Ontario</strong> trade centres are included in TSW Research’s database <strong>of</strong> the top 160 trade centres, based on total<br />
exhibit space.<br />
Top Trade Centres by Total Exhibit Space<br />
Rank Facility City State/Province Total Exhibit Space<br />
1 McCormick Place Chicago Illinois 2,200,000<br />
2 Las Vegas <strong>Convention</strong> Center Las Vegas Nevada 1,940,631<br />
3 Georgia World Congress Center Atlanta Georgia 1,370,000<br />
4 Ernest N. Morial <strong>Convention</strong> Center - New Orleans New Orleans Louisiana 1,100,000<br />
5 Kentucky Exposition Center Louisville Kentucky 1,035,000<br />
6 Dallas <strong>Convention</strong> Center Dallas Texas 1,019,142<br />
7 Pennsylvania Farm Show Complex & Expo Center Harrisburg Pennsylvania 1,000,000<br />
8 George R. Brown <strong>Convention</strong> Center Houston Texas 930,000<br />
9 International Exposition Center (I-X Center) Cleveland Ohio 902,000<br />
10 Donald E. Stephens <strong>Convention</strong> Center Rosemont Illinois 845,000<br />
16 Direct Energy Centre Toronto <strong>Ontario</strong> 804,563<br />
22 Toronto Congress Centre Toronto <strong>Ontario</strong> 500,000<br />
26 International Centre, Toronto Toronto <strong>Ontario</strong> 471,000<br />
77 Rogers Centre Toronto <strong>Ontario</strong> 200,000<br />
119 Copps Coliseum Hamilton <strong>Ontario</strong> 117,000<br />
120 Lansdowne Park/Ottawa Civic Centre Complex Ottawa <strong>Ontario</strong> 111,000<br />
130 Western Fair Association Event Center London <strong>Ontario</strong> 109,500<br />
161 Kitchener Memorial Auditorium Complex Kitchener <strong>Ontario</strong> 13,400<br />
Source: TSW Research<br />
35
4. Supply<br />
Development/Design Characteristics<br />
During the rapid growth cycle <strong>of</strong> the 1980s, convention centres in North America were constructed with banquet<br />
and meeting spaces equalling 15% to 20% <strong>of</strong> the exhibit space. As convention centres expanded, industry needs<br />
pushed meeting and ballroom space to increase as a percentage <strong>of</strong> total rentable space. As the industry evolved<br />
over the last decade, the combined meeting space and ballroom space grew upwards <strong>of</strong> 40% <strong>of</strong> the total rentable<br />
space. This spatial relationship tends to hold true for convention venues <strong>of</strong> up to 600,000 square feet (i.e., larger<br />
than any venue in Canada). The buildings that adapted best to their markets have “fixed” the spatial relationships<br />
over time, increasing the proportion <strong>of</strong> meeting space to meet demand.<br />
The Table below compares the rentable space at current <strong>Ontario</strong> convention venues to the proposed facility<br />
programs at the expanded Ottawa Congress Centre and the Niagara Falls <strong>Convention</strong> Centre. While the proposed<br />
total rentable space at these two venues is similar, the ratio <strong>of</strong> exhibit space to meeting space is quite different.<br />
Rentable Space at Current and Proposed <strong>Ontario</strong> <strong>Convention</strong> Venues<br />
London<br />
<strong>Convention</strong><br />
Centre<br />
Ottawa Congress<br />
Centre<br />
Metro Toronto<br />
<strong>Convention</strong><br />
Centre<br />
Hamilton<br />
<strong>Convention</strong><br />
Centre<br />
Expanded Ottawa<br />
Congress Centre*<br />
Niagara Falls<br />
<strong>Convention</strong><br />
Centre<br />
Exhibit Space 19,662 0 54,113 453,648 64,993 100,000<br />
Meeting/Ballroom Space 32,652 43,357 14,941 122,227 83,744 30,700<br />
Other Rentable Space 0 2,703 23,683 260,000 51,344 n/a<br />
Total 52,314 46,060 92,737 835,875 200,081 130,700<br />
Source: HLT Advisory Inc., PKF Consulting "Niagara Falls <strong>Convention</strong> Centre Study Update", October 2004<br />
Note: Halls “F” and “G” <strong>of</strong> the Metro Toronto <strong>Convention</strong> Centre exhibit hall (about 50,000 sq. ft. are finished at<br />
“hotel quality” standard and are frequently used as ballroom and plenary meeting space), bringing total<br />
meeting/ballroom space at the MTCC up to about 30% <strong>of</strong> the exhibit space.<br />
36
4. Supply<br />
Implications for <strong>Ontario</strong><br />
The growth in exhibition space and meeting space in North America over the past several years has been<br />
significant. Further, the development pipeline suggests that strong supply growth will continue over the short- to<br />
mid-term. Key implications for <strong>Ontario</strong> based on a review <strong>of</strong> North American supply trends include:<br />
• Growth in the supply <strong>of</strong> exhibit space in North America has outpaced the growth in supply <strong>of</strong> hotel<br />
rooms since 2000, suggesting the private sector (responsible for most hotel development) is more<br />
cautious than public-sector proponents <strong>of</strong> public-assembly venues.<br />
• An analysis <strong>of</strong> the largest convention centres and trade centres in North America in terms <strong>of</strong> total<br />
exhibit space indicates that Toronto is the only <strong>Ontario</strong> destination currently positioned to compete with<br />
the leading North American destinations.<br />
• Canada appears to be experiencing growth in public-assembly supply with increases underway or<br />
planned in a variety <strong>of</strong> public- and private-sector venues <strong>of</strong>fering a range <strong>of</strong> exhibit, meeting and<br />
ballroom space. Construction is underway on the expansion <strong>of</strong> six Canadian venues, including two<br />
privately-owned trade centres in Toronto. Twelve Canadian new-build venues and expansion projects<br />
are in the pipeline.<br />
• The private sector involvement in the development <strong>of</strong> venues, while focused on regional and local<br />
markets, continues in markets with strong local economies.<br />
Venue design is also evolving, reflecting user needs, resulting in much greater emphasis on flexible meeting and<br />
assembly space, at the expense <strong>of</strong> exhibit area…in all but the largest trade/exhibit halls.<br />
37
5. Demand<br />
Introduction<br />
No one source tracks all events that utilize the various public-assembly venues under study in this analysis.<br />
However, a number <strong>of</strong> organizations track data that provide insight into the scope <strong>of</strong> the market potential, including:<br />
• TSW Research’s database <strong>of</strong> Canadian and United States Trade Shows includes 3,871 events, each <strong>of</strong><br />
which more than 5,000 square feet <strong>of</strong> exhibit space. Of these events, 416 or 10.7% are held in Canada.<br />
• The Destination <strong>Market</strong>ing Association International (“DMAI”) has a database <strong>of</strong> over 18,000<br />
organizations (associations, corporations and government groups) that hold about 37,000 meetings<br />
annually. In 2006, 71 <strong>of</strong> these organizations held 75 meetings in Canada.<br />
• The Meeting Database Institute has a database <strong>of</strong> over 30,000 annual meetings ranging in size from two<br />
people to over 10,000. Approximately 60% <strong>of</strong> these meetings are held by corporate groups and 40% are<br />
held by associations. The database contains limited pr<strong>of</strong>iles <strong>of</strong> meetings held in Canada. However, the<br />
database includes 1,616 meetings which have met in Canada in the past.<br />
• Meetings & <strong>Convention</strong> Magazine (“M&C”) estimates the United States meetings market biennially. In the<br />
2006 report (2005 data), M&C estimated 1,243,600 meetings occurred with an overall attendance <strong>of</strong><br />
136.5 million generating total expenditures <strong>of</strong> US$107.2 billion. A third <strong>of</strong> the 736 respondents to the<br />
M&C survey indicated interest in holding a meeting outside the United States. In 2005, Europe was the<br />
most popular international destination with 37% <strong>of</strong> meeting planners booking international meetings<br />
holding meetings there. Europe was followed by the Caribbean (36%) and Canada and Mexico (each<br />
with 25%).<br />
• The International Congress and <strong>Convention</strong> Association (“ICCA”) tracks international associations that<br />
meet regularly and rotate between a minimum <strong>of</strong> three countries. In 2006, ICCA’s database <strong>of</strong><br />
international association meetings included 5,838 events.<br />
These sources have been used to provide a broad picture <strong>of</strong> demand for <strong>Ontario</strong> public-assembly venues.<br />
38
5. Demand<br />
Leading Destinations for Association <strong>Convention</strong> Events<br />
Number <strong>of</strong> Association <strong>Convention</strong>s by Destination<br />
(2007)<br />
1. Las Vegas, NV<br />
2. Orlando, FL<br />
87<br />
83<br />
Association conventions (typically annual or biannual<br />
general meetings) have among the longest lead times<br />
for booking and are among the most coveted event<br />
types for convention centres, given the economic<br />
impacts generated.<br />
3. Chicago, IL<br />
4. tie San Diego, CA<br />
4. tie Toronto, ON<br />
6. Washington, DC<br />
7. Atlanta, GA<br />
8. New Orleans, LA<br />
9. tie Denver, CO<br />
9. tie New York, NY<br />
9. tie San Antonio, TX<br />
9. tie San Francisco, CA<br />
Source: TSW Research<br />
75<br />
49<br />
49<br />
44<br />
40<br />
37<br />
35<br />
35<br />
35<br />
35<br />
TSW Research tracks the largest North American<br />
association conventions, almost all <strong>of</strong> which have a<br />
significant exhibition component. In 2007, Las Vegas is<br />
expected to host the most association conventions.<br />
Toronto is the only Canadian destination among the top<br />
10 list <strong>of</strong> TSW Research’s database, with 49 events<br />
expected in 2007. Not all these events will be<br />
accommodated at the Metro Toronto <strong>Convention</strong><br />
Centre, with Toronto hotels and other Toronto-area<br />
venues hosting events as well.<br />
39
5. Demand<br />
Top Host Cities for all <strong>Convention</strong>s and Exhibition Events<br />
Top 10 Destinations for all <strong>Convention</strong> and Trade<br />
Show Events (2007)<br />
Rank<br />
1<br />
2<br />
3<br />
Events<br />
250<br />
150<br />
145<br />
City<br />
Las Vegas<br />
Chicago<br />
New York<br />
Of the entire TSW Research database <strong>of</strong> over 5,036<br />
events using at least 5,000 square feet <strong>of</strong> exhibit<br />
space, Las Vegas is expected to lead all other North<br />
American destinations in 2007 with 250 events, or<br />
5.0% <strong>of</strong> the total events.<br />
The only Canadian destination represented in the top<br />
ten is Toronto with 136 events or 2.7% <strong>of</strong> the total<br />
Canadian and United States events.<br />
4<br />
5<br />
6<br />
7<br />
8<br />
8<br />
10<br />
136<br />
112<br />
100<br />
91<br />
84<br />
84<br />
81<br />
Toronto<br />
Atlanta<br />
Orlando<br />
Boston<br />
Washington<br />
Dallas<br />
San Diego<br />
Source: TSW Research<br />
40
5. Demand<br />
Leading Industry Sectors<br />
Rank<br />
1<br />
2<br />
3<br />
4<br />
5<br />
Apparel<br />
Leading Industry Sectors (2007)<br />
Industry<br />
Medical & Healthcare<br />
Home Furnishings & Interior Design<br />
Sporting Goods & Recreation<br />
Landscape & Garden Supplies<br />
No. <strong>of</strong> Shows<br />
536<br />
500<br />
353<br />
330<br />
300<br />
The Medical and Healthcare sector<br />
lead all other industry sectors in total<br />
events and is expected to widen the<br />
gap over the short to medium term as<br />
the population ages and interest in<br />
health and wellness becomes a<br />
preoccupation <strong>of</strong> the baby boomers.<br />
This demographic bias is also seen to<br />
be supporting interest in the number<br />
<strong>of</strong> home furnishing, recreation and<br />
landscape-based events.<br />
6<br />
Building & Construction<br />
295<br />
7<br />
Education<br />
261<br />
8<br />
Computers & Computer Applications<br />
242<br />
9<br />
Gifts<br />
240<br />
10<br />
Jewelry<br />
186<br />
Source: TSW Research<br />
41
5. Demand<br />
Destination Selection Criteria<br />
Hotel Room Price/Quality 63%<br />
Finding Open Dates 49%<br />
Labour Costs and Service Issues 46%<br />
Number <strong>of</strong> Hotel Rooms, Capacity 44%<br />
Hotel Block Attrition Clauses and Issues 41%<br />
Regional Pr<strong>of</strong>essional Demographics 33%<br />
Quality <strong>of</strong> Area Near the Venue/Headquarter Hotel 33%<br />
CVB/City Government <strong>Market</strong>ing Efforts and Support 28%<br />
Airport Capacity 25%<br />
Parking Capacity 23%<br />
Restaurants - Quality, Reputation, etc. 22%<br />
Safety Issues/Low Crime, etc. 19%<br />
Road and Highway Access 19%<br />
Cultural Amenities, Nightlife 19%<br />
Technology Service Costs and Service Issues 14%<br />
Regional Consumer Demographics 13%<br />
Public Transportation Access 13%<br />
Total Population 12%<br />
Health <strong>of</strong> City/Regional Economy 10%<br />
Golf Courses and Other Sporting Opportunities 10%<br />
Family-Oriented Activities Nearby/In City 10%<br />
Gambling/Gaming Nearby 5%<br />
Space for Outdoor Exhibits and Tents 4%<br />
Amusement Parks Nearby 2%<br />
Pr<strong>of</strong>essional Sports in City/Nearby 1%<br />
Other 11%<br />
Source: TSW Research<br />
TSW Research surveyed event producers to<br />
determine the key factors used when selecting a<br />
host city for their event. Three <strong>of</strong> the five top<br />
factors were hotel related:<br />
• Hotel room price/quality<br />
• Number <strong>of</strong> hotel rooms, capacity<br />
• Hotel block attrition clauses and issues<br />
Finding open dates is the second most important<br />
criteria for show producers when selecting a<br />
venue and reflects the attractiveness <strong>of</strong><br />
established destinations (“everyone wants the<br />
same dates”). Often, excess demand exists for<br />
high-season dates (high season may vary by<br />
destination, venue and event type).<br />
42
5. Demand<br />
Venue Selection Criteria<br />
Costs 77%<br />
Meeting Space Size and Quality 66%<br />
Open Dates 66%<br />
Exhibit Space Size and Quality 65%<br />
Number <strong>of</strong> Hotel Rooms Nearby 62%<br />
Exhibit Space Rental Rates 53%<br />
Labour Costs and Service Issues 53%<br />
Exhibit Space Configurations 51%<br />
Food and Beverage Quality and Costs 35%<br />
Parking Capacity 27%<br />
Exclusive Contracts 25%<br />
Expansion/Renovation/Construction Issues 23%<br />
Quality <strong>of</strong> Area Near the Venue 23%<br />
Technology/Telecom Service and Cost Issues 17%<br />
Venue Staff Customer Service 17%<br />
Public Transpiration Access 12%<br />
Road Access Information 8%<br />
Signage Issues 6%<br />
Space for Outdoor Exhibits and Tents 6%<br />
Other 6%<br />
Source: TSW Research<br />
Similar to destination selection criteria, price or cost<br />
is the most important criteria for show producers<br />
when selecting a venue. Other criteria related to<br />
cost includes labour cost, exhibit space rental rates,<br />
food & beverage costs and technology & telecom<br />
costs.<br />
Appropriate meeting and exhibit space is also<br />
important to show producers.<br />
43
5. Demand<br />
Top 50 Canadian Trade Shows<br />
TSW Research’s 3,827 trade show event database (for 2007) includes 273 events that will be held in Canada: and<br />
<strong>of</strong> that, 114 will be held in <strong>Ontario</strong>.<br />
TSW reports annually on the Top 50 Canadian trade shows (in terms <strong>of</strong> total net square feet <strong>of</strong> exhibit space). The<br />
Table below summarizes the Top 50 Canadian trade shows over the past four years.<br />
Total Net Square Feet and Attendance<br />
2003 2004 2005 2006<br />
NSF 5,464,190 5,758,308 5,322,432 5,821,718<br />
% Change n/a 5.4% -7.6% 9.4%<br />
Attendance 452,374 439,761 409,983 413,776<br />
% Change n/a -2.8% -6.8% 0.9%<br />
Source: TSW Research<br />
With the exception <strong>of</strong> a decline in 2005, the total net square feet <strong>of</strong> exhibit space in the Canadian Top 50 has<br />
grown over the past three years. At the same time, event attendance declined each year between 2003 and 2005,<br />
increasing slightly in 2006.<br />
The events that make up the TSW Research Top 50 have been relatively consistent with an average <strong>of</strong> 36 events<br />
from the previous year included in the list each year since 2003 (i.e., turnover in the Top 50 <strong>of</strong> 28%).<br />
44
5. Demand<br />
Top 50 Canadian Trade Shows—Location and Frequency<br />
The events that make up the TSW Research Top 50 have been relatively consistent with an average <strong>of</strong> 36 events<br />
from the previous year included in the list each year since 2003 (i.e., turnover in the Top 50 <strong>of</strong> 28%).<br />
New Events to Top 50 List (from previous year)<br />
2003 2004 2005 2006<br />
New Events to Top 50 List (from previous year) n/a 14 16 12<br />
Events in Top 50 vs. 2006 32 42 38 n/a<br />
Source: TSW Research<br />
Some <strong>of</strong> the variance in the Top 50 is due to biennial events (e.g., The Global Petroleum Show – the largest event<br />
in 2004 and 2006), while others are one-time events (e.g., American or international events held in a Canadian<br />
venue). Some shows are outgrown by other events (e.g. Atlantic Building Materials Show). All the Canadian-based<br />
shows that were included in the Top 50 in 2003 through 2005 but were no longer in the Top 50 in 2006 still exist.<br />
Toronto has consistently been the destination hosting the<br />
most trade shows in the Top 50 with over half <strong>of</strong> the events<br />
each year. Montreal is the second most popular destination<br />
with the number <strong>of</strong> Top 50 trade shows at this destination<br />
ranging between nine and 12 annually.<br />
Canadian Top 50 Trade Show Destinations<br />
2003 2004 2005 2006<br />
Abbotsford 0 0 1 0<br />
Calgary 2 2 2 2<br />
Edmonton 3 3 4 3<br />
Fort MacMurray 0 0 0 1<br />
Moncton 1 1 1 0<br />
Montreal 12 12 9 10<br />
Quebec City 0 0 2 0<br />
Saint-Hyacinthe 0 0 1 0<br />
Saskatoon 1 1 1 1<br />
Toronto 29 29 27 29<br />
Vancouver 2 2 2 3<br />
Winnipeg 0 0 0 1<br />
Total 50 50 50 50<br />
Source: TSW Research<br />
45
5. Demand<br />
Top 50 Canadian Trade Shows—By Sector<br />
An analysis <strong>of</strong> the industry breakdown <strong>of</strong><br />
the Top 50 Canadian Trade Shows is<br />
provided in the Table to the left. As<br />
shown, the industry breakdown has been<br />
relatively consistent. Of note:<br />
• Gifts industry trade shows in<br />
the Top 50 have declined<br />
from eight in 2003 and 2004<br />
to six in 2006<br />
• Medical and Healthcare<br />
industry trade shows<br />
increased from none in 2003<br />
and 2004 to three in 2006.<br />
Top 50 Canadian Tradeshows<br />
Number <strong>of</strong> Events by Industry<br />
2003 2004 2005 2006<br />
Advertising & <strong>Market</strong>ing 0 0 2 2<br />
Agriculture & Farming 4 4 4 4<br />
Air-Conditioning Heating & Refrigeration 0 1 0 1<br />
Apparel 3 3 3 3<br />
Automotive & Trucking 1 3 1 3<br />
Beauty & Hair Care 3 3 3 3<br />
Building & Construction 3 3 3 3<br />
China & Glassware 2 2 2 2<br />
Communications 0 1 0 0<br />
Dental 1 1 0 0<br />
Electrical & Electronics 0 1 0 1<br />
Food & Beverage 6 5 5 5<br />
Gifts 8 8 7 6<br />
Home Furnishings & Interior Design 1 1 2 2<br />
Industrial 3 4 1 3<br />
Libraries 1 0 1 0<br />
Manufacturing 2 0 2 1<br />
Medical & Health Care 0 0 1 3<br />
Mining 1 2 2 1<br />
Office Equipment 1 1 1 1<br />
Packaging 1 0 1 0<br />
Paper 1 1 1 1<br />
Petroleum, Oil & Gas 1 1 2 1<br />
Printing 1 0 1 0<br />
Real Estate 1 1 1 1<br />
Sanitation and Waste Management 1 1 0 0<br />
Sporting Goods & Recreation 4 3 4 3<br />
Total 50 50 50 50<br />
46
5. Demand<br />
Trade Shows Held in Canada – 2007<br />
In 2007, 273 trade show events with at least 5,000 square feet <strong>of</strong> exhibit space were held in Canada. This<br />
represents 5.4% <strong>of</strong> the total United States and Canadian events in the TSW Research database. Of these 273<br />
events, 114 or 41.8% were held in <strong>Ontario</strong>. <strong>Ontario</strong> also generates 41.0% <strong>of</strong> the total Canadian net square feet <strong>of</strong><br />
Exhibit Space, 44.1% <strong>of</strong> the exhibiting companies and 30.6% <strong>of</strong> the attendance. The majority <strong>of</strong> these events<br />
were held in Toronto.<br />
Rank City Events Share<br />
Net Square<br />
Feet<br />
Share<br />
Exhibiting<br />
Companies Share Attendance Share<br />
1 Toronto 95 34.8% 6,574,400 35.4% 23,052 38.8% 586,550 25.9%<br />
2 Montreal 39 14.3% 2,586,092 13.9% 8,717 14.7% 397,550 17.5%<br />
3 Calgary 26 9.5% 1,562,500 8.4% 4,945 8.3% 113,400 5.0%<br />
4 Vancouver 25 9.2% 1,597,800 8.6% 5,070 8.5% 116,900 5.2%<br />
5 Edmonton 16 5.9% 1,235,300 6.7% 4,342 7.3% 413,900 18.3%<br />
6 Quebec City 8 2.9% 480,000 2.6% 1,430 2.4% 32,800 1.4%<br />
7 Ottawa 7 2.6% 403,050 2.2% 1,300 2.2% 40,400 1.8%<br />
8 Winnipeg 6 2.2% 403,050 2.2% 1,060 1.8% 47,300 2.1%<br />
9 Regina 5 1.8% 1,140,000 6.1% 1,330 2.2% 193,100 8.5%<br />
10 Halifax 5 1.8% 300,000 1.6% 720 1.2% 15,400 0.7%<br />
13 London 4 1.5% 240,000 1.3% 760 1.3% 17,600 0.8%<br />
16 Hamilton 3 1.1% 180,000 1.0% 430 0.7% 24,900 1.1%<br />
20 Sudbury 2 0.7% 70,000 0.4% 210 0.4% 12,000 0.5%<br />
25 Vaughan 1 0.4% 60,000 0.3% 190 0.3% 4,400 0.2%<br />
27 Sarnia 1 0.4% 60,000 0.3% 150 0.3% 8,000 0.4%<br />
30 Orillia 1 0.4% 20,000 0.1% 100 0.2% 500 0.0%<br />
Subtotal <strong>Ontario</strong> 114 41.8% 7,607,450 41.0% 26,192 44.1% 694,350 30.6%<br />
Total Canada 273 100.0% 18,546,842 100.0% 59,417 100.0% 2,266,200 100.0%<br />
Source: TSW Research<br />
47
5. Demand<br />
Trade Shows held in the North America, Canada and<br />
<strong>Ontario</strong><br />
TSW Research database includes all trade shows with 5,000 net square feet <strong>of</strong> exhibit space or more.<br />
• In 2007, 5,036 such events where held in the United States and Canada <strong>of</strong> these events, 3,827 are<br />
trade shows. The compound average growth rate in number <strong>of</strong> trade shows between 2003 and 2007 is<br />
2.4%. As shown, the growth in number <strong>of</strong> trade shows in the TSW Research database has slowed<br />
each year over this period. For comparison purposes, the compound average growth rate in the supply<br />
<strong>of</strong> exhibit space in the United States and Canada was 2.7% over the same period.<br />
• TSW Research’s event database includes 273 trade shows that will be held in Canada in 2007. The<br />
number <strong>of</strong> Canadian events in the TSW database has declined by a compound average growth rate <strong>of</strong><br />
5.1% since 2003.<br />
• TSW Research’s event database includes 114 trade shows that will be held in Canada in 2007. The<br />
number <strong>of</strong> Canadian events in the TSW database has declined by a compound average growth rate <strong>of</strong><br />
2.9% since 2003.<br />
• <strong>Ontario</strong>’s share <strong>of</strong> the total number <strong>of</strong> Canadian and United States trade shows in the TSW database<br />
has declined from 3.7% in 2003 to 3.0% today.<br />
• <strong>Ontario</strong>’s share <strong>of</strong> the Canadian trade shows in the database has fluctuated between 38.1% and 43.3%<br />
over the last three years.<br />
Total Canada and the<br />
United States Canada <strong>Ontario</strong><br />
Share <strong>of</strong><br />
Events Growth Events Growth Events Growth Total<br />
Share <strong>of</strong><br />
Canada<br />
2007 3,827 0.7% 273 -2.6% 114 -3.5% 3.0% 41.8%<br />
2006 3,800 2.2% 280 1.1% 118 7.6% 3.1% 42.1%<br />
2005 3,716 2.3% 277 -10.1% 109 -21.1% 2.9% 39.4%<br />
2004 3,631 4.2% 305 -10.2% 132 3.0% 3.6% 43.3%<br />
2003 3,479 5.2% 336 n/a 128 n/a 3.7% 38.1%<br />
Source: TSW Research<br />
Note: TSW Research Database includes trade shows and consumer shows. We have assumed the 2007 ratio <strong>of</strong> trade shows<br />
to consumer shows has remained constant throughout the 2003 to 2007 period.<br />
48
5. Demand<br />
Trade Shows Held in Canada – Recurring vs. “One Time”<br />
The TSW Research database <strong>of</strong> trade shows held in Canada includes 1,471 individual events over the five-year<br />
2003 to 2007 period (an annual event which occurred in each <strong>of</strong> the five years would be considered five individual<br />
events). Of these 1,471 events, 1,213 or 81.5% were recurring events (i.e., events that occurred more than once<br />
in the five-year period). Only 258 events, or an average <strong>of</strong> 52 per year, were “one-time” events.<br />
Trade Show Events Held in Canada Between 2002 and 2007<br />
Times Event Total Number <strong>of</strong> Event Distribution (Number <strong>of</strong> Canadian Venues)<br />
Held in Canada Events 5+ 4 3 2 1<br />
5+ 538 5 4 3 19 66<br />
4 252 5 3 7 48<br />
3 249 9 5 69<br />
2 174 17 70<br />
1 258 258<br />
Total Events 1,471 26 40 54 172 1,179<br />
Source: TSW Research, HLT Advisory Inc.<br />
Of the 1,213 recurring events, 971 or 80% (1,179 less 258) were held at the same destination each time, although<br />
in some cases different venues. The remaining events occurred in multiple destinations.<br />
49
5. Demand<br />
Year-Over-Year Metrics <strong>of</strong> Trade Shows Held in Canada<br />
The TSW Research database includes information on total net square feet <strong>of</strong> exhibit space, the number <strong>of</strong><br />
exhibiting companies as well as event attendance.<br />
Net Square Feet (000s) Exhibiting Companies Attendance (000s)<br />
Total Change Total Change Total Change<br />
Canada<br />
2007 17,745 1.7% 69,069 -13.4% 1,569 -2.5%<br />
2006 17,444 8.1% 79,800 9.1% 1,609 11.0%<br />
2005 16,135 -16.5% 73,128 -19.3% 1,449 -18.5%<br />
2004 19,313 -3.2% 90,585 4.2% 1,778 12.0%<br />
2003 19,951 n/a 86,904 n/a 1,587 n/a<br />
<strong>Ontario</strong><br />
2007 7,752 5.1% 33,630 -15.7% 684 9.8%<br />
2006 7,375 12.8% 39,884 30.2% 623 2.0%<br />
2005 6,540 -18.7% 30,629 -22.4% 611 -20.6%<br />
2004 8,042 8.6% 39,468 7.8% 769 14.2%<br />
2003 7,404 n/a 36,600 n/a 674 n/a<br />
Source: Tradeshow Week Data Book, Tradeshow Week Quarterly <strong>Report</strong>s<br />
50
5. Demand<br />
<strong>Convention</strong>s Held in Canada<br />
Destination <strong>Market</strong>ing Association International (“DMAI”) maintains a database <strong>of</strong> over 18,000 organizations<br />
associations, corporations and government groups that hold about 37,000 meetings annually. Of these<br />
organizations, about 1% or 352 have reported meeting in Canada since 2002. These 352 organizations reported<br />
holding 401 meetings in Canada since 2002 as well as an additional 224 meetings in Canada prior to 2002.<br />
The DMAI database is maintained by member Destination Management Organizations (DMOs). The database is<br />
dependent on these DMOs inputting the information in the database. Those events occurring at a destination<br />
that did not utilize the local DMO (e.g. an event occurring at a convention hotel that in which the lead was<br />
generated by the hotel or hotel company’s sales <strong>of</strong>fice) are most likely not included.<br />
The table below provides a breakdown <strong>of</strong> the 401 events in the DMAI database by host city.<br />
Calgary Edmonton Montreal Ottawa Toronto Vancouver Total<br />
Events 37 2 105 4 210 43 401<br />
Average Registered Attendance 942 225 1,475 288 1,990 915 1,616<br />
Average Total Attendance 987 225 1,580 281 2,230 910 1,773<br />
Average Peak Rooms Picked Up 366 57 765 143 840 462 725<br />
Source: Destination <strong>Market</strong>ing Association International, HLT Advisory Inc.<br />
Over 50% <strong>of</strong> the 401 Canadian events were held in <strong>Ontario</strong>. The majority (98.1%) <strong>of</strong> these reported <strong>Ontario</strong><br />
events occurred in Toronto with the remainder occurring in Ottawa. Only four <strong>of</strong> the reported events in the DMAI<br />
database where held in Ottawa.<br />
Toronto and Montreal, the Canadian cities with the largest convention venues in terms <strong>of</strong> rentable space, have<br />
held the most events since 2002 with 210 and 105 respectively. Vancouver and Calgary, with Canada’s sixth and<br />
seventh largest convention centres, held 43 and 37 events since 2002.<br />
51
5. Demand<br />
<strong>Convention</strong>s Held in Canada—Toronto and Ottawa<br />
The table below shows the convention events in the DMAI database held in <strong>Ontario</strong> each year from 2002 through<br />
2007 (partial year). Toronto’s convention business suffered in 2003 as a number <strong>of</strong> events were cancelled (or<br />
postponed) due to the SARS pandemic. According to <strong>Tourism</strong> Toronto, 2006 was the first year Toronto fully<br />
recovered from the SARS outbreak.<br />
Average total attendance has fluctuated widely each year. However, average peak rooms picked up has<br />
increased each year in Toronto. This suggests the average economic impact generated from each event may be<br />
increasing.<br />
Average Total Average Peak Rooms<br />
Events<br />
Attendance<br />
Picked Up<br />
Number Change Number Change Number Change<br />
Toronto<br />
2002 52 n/a 1,561 n/a 734 n/a<br />
2003 27 -48.1% 2,902 85.9% 740 0.7%<br />
2004 30 11.1% 1,802 -37.9% 759 2.6%<br />
2005 37 23.3% 2,919 62.0% 837 10.3%<br />
2006 45 21.6% 1,846 -36.8% 842 0.6%<br />
2007* 19 n/a 3,094 67.6% 1,293 53.5%<br />
Ottawa<br />
2002 0 n/a 0 n/a 0 n/a<br />
2003 2 n/a 275 n/a 185 n/a<br />
2004 1 -50.0% 150 -45.5% 50 -73.0%<br />
2005 1 0.0% 375 150.0% 177 254.0%<br />
2006 0 -100.0% 0 -100.0% 0 -100.0%<br />
2007* 0 n/a 0 n/a 0 n/a<br />
Source: Destination <strong>Market</strong>ing Association International, HLT Advisory Inc.<br />
* Partial Year<br />
Note: The Ottawa figures reflect a lack <strong>of</strong> complete reporting <strong>of</strong> events in the DMAI database.<br />
52
5. Demand<br />
<strong>Convention</strong>s Held in Canada—Destination Allocation<br />
Of the 352 association and corporate groups in the DMAI database that have held conventions in Canada since<br />
2002, 128 <strong>of</strong> those have met in Canada on multiple occasions. These 128 groups have held 401 meetings in<br />
Canada (dating back to 1985). Toronto was by far the most popular destination for these groups hosting<br />
184meetings by 110 individual groups an average <strong>of</strong> 1.7 times. Montreal and Calgary have also been successful<br />
in hosting groups on multiple occasions.<br />
Calgary Edmonton Hamilton Montreal Ottawa Quebec Toronto Vancouver Victoria Total<br />
Meetings by Location (Multiple Meetings in Canada) 48 12 1 90 20 11 184 34 1 401<br />
Groups Holding Meeting at Destination 34 11 1 71 19 11 110 29 1 128<br />
Groups Holding Meeting at Destination (Capture Rate) 26.6% 8.6% 0.8% 55.5% 14.8% 8.6% 85.9% 22.7% 0.8% 100.0%<br />
Average Meetings at Destination per Group 1.4 1.1 1.0 1.3 1.1 1.0 1.7 1.2 1.0 3.1<br />
Source: Destination <strong>Market</strong>ing Association International, HLT Advisory Inc.<br />
The 352 organizations in the DMAI database holding<br />
events in Canada since 2002 have held a total <strong>of</strong> 625<br />
events in Canada. Of these 625 events, 224 have<br />
been held in Canada once (in most cases United<br />
States or international based groups). Over half <strong>of</strong><br />
these “one-<strong>of</strong>f” events were held in Toronto. Ottawa<br />
was the only other <strong>Ontario</strong> city to host one-<strong>of</strong>f events<br />
with two <strong>of</strong> its 22 events coming from groups holding<br />
a single event in Canada.<br />
This analysis suggests that Toronto is the primary<br />
destination for both groups holding multiple events<br />
and one-<strong>of</strong>f events in Canada.<br />
Groups Holding Events in Canada 2002 to 2007<br />
Total Events Multiple Events One-Time Events<br />
Calgary 62 48 14<br />
Edmonton 14 12 2<br />
Hamilton 1 1 0<br />
Montreal 145 90 55<br />
Ottawa 22 20 2<br />
Quebec City 12 11 1<br />
Richmond 1 0 1<br />
Toronto 301 184 117<br />
Vancouver 66 34 32<br />
Victoria 1 1 0<br />
625 401 224<br />
Source: Destination <strong>Market</strong>ing Association International, HLT Advisory Inc.<br />
53
5. Demand<br />
<strong>Convention</strong>s Held in Canada—Frequency and Destination<br />
Of the 128 groups that report to DMAI holding a meeting in Canada since 2002, and held more than one event in<br />
Canada, 105 or 82.0% have used multiple Canadian destinations.<br />
Of the 23 groups that held multiple events in one destination, Toronto was the choice destination on 19 occasions<br />
(including ASTM International, who have held their event in Toronto seven times) with Montreal the choice on the<br />
four other occasions.<br />
Groups Holding Multiple <strong>Convention</strong>s in Canada - Number <strong>of</strong> Destinations Used<br />
Total Number <strong>of</strong> Times Event Total Number <strong>of</strong> Distribution <strong>of</strong> Groups (number <strong>of</strong> destinations used)<br />
Groups Held in Canada Events Five + Four Three Two One<br />
3 9 27 1 1 1 0 0<br />
3 8 24 2 1 0 0 0<br />
4 7 28 1 1 1 0 1<br />
11 6 66 5 3 1 2 0<br />
6 5 30 2 4 0 0 0<br />
2 4 8 0 2 0 0<br />
20 3 60 3 10 7<br />
79 2 158 56 23<br />
128 401<br />
Source: Destination <strong>Market</strong>ing Association International, HLT Advisory Inc.<br />
54
5. Demand<br />
Event Activity at <strong>Ontario</strong> Publicly-Owned Venues<br />
The following Table shows the convention, trade shows, consumer shows and meeting at the four <strong>Ontario</strong><br />
members <strong>of</strong> the <strong>Convention</strong> Centres <strong>of</strong> Canada in the years 2004 to 2006. As shown, both the Metro Toronto<br />
<strong>Convention</strong> Centre and the London <strong>Convention</strong> Centre have realized a significant increase in<br />
conventions/conventions over the three-year period (i.e., the event type that typically generates the highest<br />
economic impact). Apart from a decline at the Hamilton <strong>Convention</strong> Centre in 2005, the number <strong>of</strong><br />
conventions/conferences held in Hamilton and Ottawa have been relatively stable.<br />
The number <strong>of</strong> meetings have declined over the three-year period in both Hamilton and Ottawa. Hamilton has<br />
been affected by the opening <strong>of</strong> a conference centre adjacent the Holiday Inn Select in Oakville and the Burlington<br />
<strong>Convention</strong> Centre. In Ottawa, an eight-week labour disruption in 2006 impacted the number <strong>of</strong> meeting (as well<br />
as food and beverage) events.<br />
<strong>Ontario</strong> <strong>Convention</strong> Centres - Events by Event Type 2004 through 2006<br />
Hamilton <strong>Convention</strong> Centre London <strong>Convention</strong> Centre Ottawa Congress Centre<br />
Metro Toronto <strong>Convention</strong><br />
Centre<br />
2004 2005 2006 2004 2005 2006 2004 2005 2006 2004 2005 2006<br />
<strong>Convention</strong>s/Conferences 30 22 29 16 22 29 39 38 35 24 32 42<br />
Trade Shows 1 4 1 11 5 1 10 16 16 32 29 28<br />
Consumer Shows 7 5 12 5 5 3 12 12 11 42 55 53<br />
Meetings 182 134 122 195 194 224 228 226 167 432 474 452<br />
Total 220 165 164 227 226 257 289 292 229 530 590 575<br />
Source: Hamilton <strong>Convention</strong> Centre, London <strong>Convention</strong> Centre, Ottawa Congress Centre, Metro Toronto <strong>Convention</strong> Centre, <strong>Convention</strong> Centres <strong>of</strong> Canada, HLT<br />
Advisory Inc.<br />
55
5. Demand<br />
<strong>Ontario</strong> Venues Compared with CC <strong>of</strong> C Venues<br />
Comparing the aggregate convention/conference, trade and consumer show events held in the four <strong>Ontario</strong><br />
convention centres to the results for the aggregate <strong>Convention</strong> Centres <strong>of</strong> Canada total, provides an indication <strong>of</strong><br />
market share in a Canadian context. However, as these aggregate numbers include local, provincial and regional<br />
events (where venues outside the local, provincial or regional area will be ineligible to host an event) can distort<br />
the total…<br />
<strong>Ontario</strong> <strong>Convention</strong> Centre <strong>Market</strong> Share by Event Type - 2004 to 2006<br />
<strong>Ontario</strong><br />
Total Canada <strong>Ontario</strong> <strong>Market</strong> Share<br />
2004 2005 2006 2004 2005 2006 2004 2005 2006<br />
<strong>Convention</strong>s/Conferences 109 114 135 442 481 529 24.7% 23.7% 25.5%<br />
Trade Shows 54 54 46 175 176 171 30.9% 30.7% 26.9%<br />
Consumer Shows 66 77 79 128 162 175 51.6% 47.5% 45.1%<br />
Meetings 1,037 1,028 965 2,932 3,404 3,591 35.4% 30.2% 26.9%<br />
Total 1,266 1,273 1,225 3,677 4,223 4,466 34.4% 30.1% 27.4%<br />
Source: Hamilton <strong>Convention</strong> Centre, London <strong>Convention</strong> Centre, Ottawa Congress Centre, Metro Toronto <strong>Convention</strong> Centre,<br />
<strong>Convention</strong> Centres <strong>of</strong> Canada, HLT Advisory Inc.<br />
Note: Canadian event counts from the <strong>Convention</strong> Centres <strong>of</strong> Canada Benchmarking Study<br />
56
5. Demand<br />
Event Activity at <strong>Ontario</strong> Publicly-Owned Venues<br />
In 2006 in <strong>Ontario</strong>, publicly-owned convention and trade centers held 2,156 total events. The totals provided by<br />
the venues cannot be reconciled to the TSW Research and DMAI data as different reporting methodologies are<br />
used.<br />
It should be noted that different venues classify events using different parameters. For example, some “meeting”<br />
events held at the Metro Toronto <strong>Convention</strong> Centre would be considered “conventions” at other <strong>Ontario</strong> venues<br />
(at the MTCC a convention must have more than 500 delegates and be at least two days in length). This results in<br />
events being classified as meetings that would likely be classified as conventions at the other <strong>Ontario</strong> venues.<br />
<strong>Ontario</strong> Publicly-Owned <strong>Convention</strong> and Trade Venues - Events by Event Type 2006<br />
London<br />
<strong>Convention</strong><br />
Centre<br />
Ottawa<br />
Congress<br />
Centre<br />
Lansdowne<br />
Park (average<br />
event load)<br />
Subtotal<br />
Ottawa<br />
Metro Toronto<br />
<strong>Convention</strong><br />
Centre<br />
Hamilton<br />
<strong>Convention</strong><br />
Centre<br />
Direct<br />
Energy<br />
Centre<br />
Subtotal<br />
Toronto<br />
Total<br />
<strong>Ontario</strong><br />
<strong>Convention</strong>s/Conferences 29 29 35 4 39 42 0 42 139<br />
Tradeshows 1 1 16 2 18 28 16 44 64<br />
Consumer Shows 12 3 11 30 41 53 25 78 134<br />
Meetings 122 224 167 50 217 452 28 480 1,043<br />
Food and Beverage Events 215 162 240 40 280 88 31 119 776<br />
Total 379 419 469 126 595 663 100 763 2,156<br />
Source: <strong>Ontario</strong> publicly-owned convention centres and trade centres<br />
57
5. Demand<br />
Event Activity at <strong>Ontario</strong> Publicly-Owned Venues (cont’d.)<br />
An analysis <strong>of</strong> the convention/conference, trade and consumer show events held in 2006 at <strong>Ontario</strong>’s publiclyowned<br />
convention centres shows the vast majority (89.6%) <strong>of</strong> conventions and conferences do not regularly occur<br />
(i.e., these are “one-time” events or events on a rotation that may visit the venue once every few years).<br />
Conversely, the majority <strong>of</strong> trade shows (80.4%) and consumer shows (89.9%) occur on an annual basis.<br />
<strong>Ontario</strong> <strong>Convention</strong> Venues - Recurring and One-Time Events by <strong>Market</strong> Segment<br />
Hamilton<br />
<strong>Convention</strong><br />
Centre<br />
London<br />
<strong>Convention</strong><br />
Centre<br />
Ottawa<br />
Congress<br />
Centre<br />
Metro Toronto<br />
<strong>Convention</strong><br />
Centre<br />
Total<br />
<strong>Convention</strong>s/Conferences<br />
Recurring 7 3 3 2 15 11.1%<br />
One-Time Provincial/Regional 11 20 10 21 62 45.9%<br />
One-Time National 9 6 19 14 48 35.6%<br />
One-Time International 2 0 3 5 10 7.4%<br />
Total 29 29 35 42 135 100.0%<br />
Tradeshows<br />
Recurring 1 1 8 27 37 80.4%<br />
One-Time Provincial/Regional 0 0 8 1 9 19.6%<br />
One-Time National 0 0 0 0 0 0.0%<br />
One-Time International 0 0 0 0 0 0.0%<br />
Total 1 1 16 28 46 100.0%<br />
Consumer Shows<br />
Recurring 11 3 10 47 71 89.9%<br />
One-Time Provincial/Regional 0 0 0 5 5 6.3%<br />
One-Time National 1 0 1 1 3 3.8%<br />
One-Time International 0 0 0 0 0 0.0%<br />
Total 12 3 11 53 79 100.0%<br />
Source: Hamilton <strong>Convention</strong> Centre, London <strong>Convention</strong> Centre, Ottawa Congress Centre, Metro Toronto <strong>Convention</strong> Centre, HLT Advisory Inc.<br />
58
5. Demand<br />
<strong>Convention</strong> Saleable Weeks by Delegate Source <strong>of</strong> Origin<br />
Geographic Orientation<br />
Canadian United States International<br />
Saleable Season All Year Mar. to Oct. Mar. to Oct.<br />
Saleable Weeks 52 35 35<br />
Less: Weeks with Major Holidays<br />
First Week <strong>of</strong> January 1 n/a n/a<br />
Easter 2 2 2<br />
Memorial Day/Mother's Day 1 1 1<br />
Canada Day 1 n/a n/a<br />
July 4th n/a 1 n/a<br />
Civic Holiday (August) 1 n/a n/a<br />
Labour Day/Rosh Hashanna 1 1 1<br />
Yom Kippur n/a 1 n/a<br />
Simhat Torah n/a 1 n/a<br />
Columbus Day n/a 1 n/a<br />
Thanksgiving (Canada) 1 n/a n/a<br />
Thanksgiving (United States) n/a 1 n/a<br />
Christmas/New Years 1 n/a n/a<br />
Subtotal 9 9 4<br />
Total Saleable Weeks 43 26 31<br />
Source: HLT Advisory Inc.<br />
Attractive dates vary by event type. In Canada, convention demand is highest during non-holiday weeks in the<br />
spring and fall. While client-specific requirements vary, generally convention organizers avoid holiday periods and<br />
seasonal fluctuations. As a result, convention “season” is only a subset <strong>of</strong> the entire year. Typically, convention<br />
events have booking priority at the venues with other event types (i.e., trade shows, consumer shows) filling in the<br />
scheduling gaps or the non-saleable weeks for conventions. The above table breaks down the number <strong>of</strong> saleable<br />
weeks by geographic market.<br />
59
5. Demand<br />
Total Demand Estimates for Toronto and Ottawa<br />
Combining the publicly-owned and privately-owned venues together with convention hotels gives an indication <strong>of</strong><br />
total demand within <strong>Ontario</strong>'s two major cities.<br />
Metro Toronto<br />
<strong>Convention</strong><br />
Centre<br />
Direct Energy<br />
Centre<br />
International<br />
Centre/ Toronto<br />
Congress<br />
Centre*<br />
<strong>Convention</strong><br />
Hotels**<br />
Total Toronto<br />
<strong>Convention</strong>s 42 0 10 220 272<br />
Tradeshows 28 16 250 10 304<br />
Consumer Shows 53 25 60 5 143<br />
Source: Metro Toronto <strong>Convention</strong> Centre, HLT Advisor Inc. estimates<br />
* Estimated aggregate event load for private trade centres<br />
Toronto 2006 Event Load<br />
** Estimated aggregate event load for the Fairmont Royal York, the Sheraton Centre and Westin Harbour Castle - defined as group<br />
events generating at least 500 occupied room nights<br />
Ottawa 2006 Event Load<br />
Ottawa Congress<br />
Centre* Lansdowne Park<br />
<strong>Convention</strong><br />
Hotels**<br />
Total Ottawa<br />
<strong>Convention</strong>s 35 4 100 139<br />
Tradeshows 16 2 10 28<br />
Consumer Shows 11 30 5 46<br />
Source: Ottawa Congress Centre, HLT Advisory Inc. estimates<br />
* The Ottawa Congress Centre experienced an eight-week labour disruption beginning on April 12, 2006<br />
** Estimated aggregate event load for the Chateau Laurier, Westin Ottawa and Marriott Ottawa - defined as group<br />
events generating at least 400 occupied room nights<br />
60
6. Key Success Factors (KSF)<br />
Introduction<br />
In this section, the Key Success Factors (“KSF”) for a convention venue in attracting convention events are<br />
discussed. The analysis is focused on convention events because these are the events that have the potential to<br />
attract the most non-resident delegates thereby generating the greatest economic impact. The KSF for conventions<br />
include:<br />
• Air lift to the destination<br />
• Quality hotels close to or adjacent to the venue<br />
• Quality venue space<br />
• Cost <strong>of</strong> destination and venue<br />
• Attractive destination<br />
61
6. KSF #1<br />
Air Lift to Destination<br />
The number <strong>of</strong> destinations with non-stop service to the host destination as well as the frequency and capacity <strong>of</strong><br />
the flights is one <strong>of</strong> the most critical KSFs in attracting convention events. The source <strong>of</strong> origin <strong>of</strong> event delegates<br />
will determine the air lift requirements.<br />
Total Airport Destinations by Region<br />
Airport<br />
Toronto<br />
Ottawa<br />
Montreal<br />
Philadelphia<br />
Region<br />
Canada 27 13 29 2 4 9 6 3 4 2 41 5<br />
United States 41 10 21 82 91 140 22 163 127 46 24 77<br />
Caribbean* 25 - 13 11 5 10 5 22 3 27 5 1<br />
Central & South America 19 - 3 2 9 20 2 29 26 36 9 27<br />
Atlantic Islands 2 - - - - - 1 - - - - -<br />
Europe 27 1 25 17 12 22 11 19 4 - 10 8<br />
Africa - - 2 - 1 - - 2 - - - -<br />
Middle East 1 - 2 - 4 3 - 2 - - - 1<br />
Asia/Oceania 7 - 1 - 4 18 - 3 2 - 10 19<br />
Total Destinations 149 24 96 114 130 222 47 243 166 111 99 138<br />
Washington<br />
Chicago<br />
Boston<br />
Atlanta<br />
Dallas<br />
Miami<br />
Vancouver<br />
Los Angeles<br />
Source: Toronto Pearson International Airport, Ottawa International Airport, Montréal-Pierre Elliott Trudeau International<br />
Airport, Philadelphia International Airport, Metropolitan Washington Airports Authority, Chicago Airport System, Logan<br />
International Airport (Boston), Hartsfield-Jackson Atlanta International Airport, Dallas Fort Worth Airport, Miami-Dade<br />
International Airport, Vancouver International Airport, Los Angeles International Airport.<br />
* Six destinations in Cuba are served from Toronto - they have been counted as one destination.<br />
Toronto is well-positioned from this perspective serving more United States destinations than any Canadian city,<br />
more European destinations than all <strong>of</strong> the selected destinations as well as a number <strong>of</strong> Asian destinations. The<br />
only cities whose airports serve more destinations than Toronto are Atlanta (hub for Delta Airlines), Chicago (hub<br />
for American Airlines and United Airlines) and Dallas (hub for American Airlines). The cities included in the table<br />
were selected as representative <strong>of</strong> typical competitors to Toronto for convention events.<br />
62
6. KSF #2<br />
Availability <strong>of</strong> Proximate Hotels<br />
An adequate inventory (including range <strong>of</strong> quality and price point) <strong>of</strong> hotel rooms as well as reasonable contracting<br />
provisions is essential to addressing convention planners requirements. Hotel rooms are required proximate to the<br />
convention venue in order to minimize transportation (bussing) costs.<br />
Rentable Space/Hotel Room (Downtown Core)<br />
Square Feet (Exhibit, Meeting, Ballroom Space) per Hotel Room<br />
50<br />
45<br />
40<br />
35<br />
30<br />
25<br />
20<br />
15<br />
10<br />
5<br />
0<br />
4 5<br />
Victoria<br />
Whistler<br />
9 9<br />
Vancouver<br />
Calgary<br />
10<br />
Ottawa<br />
14<br />
Prince George<br />
19<br />
Halifax<br />
21<br />
24<br />
30<br />
32 33<br />
Many <strong>of</strong> the destinations considering or undertaking expansions (i.e., Victoria, Vancouver, Calgary and Ottawa)<br />
have a ratio <strong>of</strong> total rentable space to downtown hotel rooms <strong>of</strong> less than 10 square feet per hotel room.<br />
Conversely, Hamilton has too few hotel rooms in its downtown core to support convention demand.<br />
Penticton<br />
Montreal<br />
Edmonton<br />
London<br />
Winnipeg<br />
35<br />
Toronto<br />
39<br />
Hamilton<br />
43<br />
Quebec City<br />
63
6. KSF #3<br />
Quality <strong>of</strong> Venue and Service<br />
The appropriateness <strong>of</strong> a venue’s exhibition, meeting and ballroom space is an important criteria for meeting<br />
planners. Once they have determined that enough space <strong>of</strong> each type (exhibit space, number and size <strong>of</strong><br />
breakouts, size <strong>of</strong> ballroom) is available, they consider:<br />
• Amount <strong>of</strong> contiguous exhibit space—Ideally, exhibitors may be accommodated in one contiguous<br />
space. The exhibit space should be column free. Sufficient loading docks and access to the exhibit<br />
floor is important. Event organizers look to minimize the move-in and move-out time requirements to<br />
both reduce the cost to themselves (through exhibit hall rentals) and their exhibitors (<strong>of</strong>ten a significant<br />
source <strong>of</strong> revenue for the organizer).<br />
• Number and size <strong>of</strong> breakout rooms—Event organizers (both convention and trade show) are looking<br />
for an increasing number <strong>of</strong> breakout rooms. These rooms should be “hotel quality” as should the<br />
main ballroom used for plenary sessions, meals, gala dinners, etc. An appropriate mix <strong>of</strong> Exhibit Space<br />
to meeting/ballroom space is desired. The venue’s exhibition, meeting room and ballroom space<br />
should be easily accessible to each other.<br />
• Technology and Telecom—State-<strong>of</strong>-the-art technology is increasingly becoming a requirement for event<br />
organizers and participants.<br />
• Ability to provide “hotel quality” food and beverage—Event organizers look for quality food and<br />
beverage <strong>of</strong>ferings at a reasonable cost.<br />
64
6. KSF #4<br />
Cost <strong>of</strong> Destination and Venue<br />
The overall cost <strong>of</strong> a destination or venue is a key factor for event organizers. For many association groups, the<br />
annual meeting or convention is a key source <strong>of</strong> funding. If a destination is too expensive, attendance may be<br />
adversely affected negatively affecting convention revenues. Further, the cost to the event organizer affects<br />
convention pr<strong>of</strong>itability, which may adversely affect the association’s financial situation. As a result, venues and<br />
CVBs look for ways to reduce the overall cost to organizers.<br />
Destination Airport<br />
TOR OTT MTL PHL WAS CHI BOS ATL DAL MIA VAN LA<br />
YYZ YOW YUL PHL DCA ORD BOS ATL DFW MIA YVR LAX<br />
TOR YYZ $ 0.49 $ 0.37 $ 0.74 $ 0.78 $ 0.50 $ 0.69 $ 0.42 $ 0.22 $ 0.23 $ 0.17 $ 0.14<br />
OTT YOW $ 0.47 $ 2.05 $ 0.71 $ 0.55 $ 0.42 $ 1.00 $ 0.57 $ 0.23 $ 0.20 $ 0.14 $ 0.13<br />
MTL YUL $ 0.38 $ 2.20 $ 0.66 $ 0.61 $ 0.33 $ 1.04 $ 0.54 $ 0.20 $ 0.23 $ 0.17 $ 0.14<br />
PHL PHL $ 0.58 $ 0.57 $ 0.53 $ 2.11 $ 0.15 $ 1.31 $ 0.18 $ 0.10 $ 0.08 $ 0.10 $ 0.28<br />
WAS DCA $ 0.63 $ 0.45 $ 0.51 $ 2.11 $ 0.31 $ 0.46 $ 0.21 $ 0.10 $ 0.12 $ 0.11 $ 0.07<br />
CHI ORD $ 0.42 $ 0.35 $ 0.32 $ 0.15 $ 0.31 $ 0.24 $ 0.19 $ 0.20 $ 0.08 $ 0.14 $ 0.07<br />
BOS BOS $ 0.57 $ 0.84 $ 0.85 $ 1.31 $ 0.46 $ 0.24 $ 0.26 $ 0.48 $ 0.11 $ 0.10 $ 0.16<br />
ATL ATL $ 0.35 $ 0.49 $ 0.46 $ 0.18 $ 0.21 $ 0.19 $ 0.26 $ 0.17 $ 0.19 $ 0.11 $ 0.19<br />
DAL DFW $ 0.18 $ 0.19 $ 0.17 $ 0.10 $ 0.10 $ 0.20 $ 0.48 $ 0.17 $ 0.27 $ 0.15 $ 0.09<br />
MIA MIA $ 0.19 $ 0.16 $ 0.19 $ 0.08 $ 0.12 $ 0.08 $ 0.11 $ 0.19 $ 0.27 $ 0.10 $ 0.06<br />
VAN YVR $ 0.17 $ 0.14 $ 0.16 $ 0.12 $ 0.14 $ 0.17 $ 0.11 $ 0.13 $ 0.18 $ 0.11 $ 0.22<br />
LA LAX $ 0.11 $ 0.11 $ 0.12 $ 0.28 $ 0.07 $ 0.07 $ 0.16 $ 0.19 $ 0.09 $ 0.06 $ 0.18<br />
Note: Price based on the lowest advertised, one-way ticket.<br />
Departure Airport<br />
Greater than $0.30/mile<br />
Between $0.20 and $0.30/mile<br />
Between $0.10 and $0.20/mile<br />
Less than $0.10/mile<br />
The adjacent table shows<br />
the average cost per mile<br />
for a one-way fare between<br />
major urban centres likely<br />
to compete with Toronto<br />
and Ottawa for national,<br />
United States and<br />
international conventions.<br />
The table represents an<br />
average <strong>of</strong> the lowest<br />
available fares on Expedia<br />
on November 12, 2007 for<br />
travel on January 22, 2008<br />
and April 22, 2008.<br />
Toronto, Ottawa and Montreal are among the most expensive destinations. One reason for this is the success <strong>of</strong><br />
the two major Canadian airlines in maximizing air fares. Price competition is more prevalent in the United States,<br />
which has five major airlines (i.e., lower air fares).<br />
65
6. KSF #4<br />
Cost <strong>of</strong> Destination and Venue<br />
The two graphs on this page show 2006 average daily rates (“ADR”) for the downtown core <strong>of</strong> selected North<br />
American cities expressed in US dollars. The graph on the left converts the Canadian ADR to $US at the average<br />
2006 exchange rate. The bottom graph converts the ADR at the current exchange rate <strong>of</strong> 0.9912.<br />
As shown, the <strong>Ontario</strong> cities do not compare as favourably to the United States cities when the current exchange<br />
rate is applied.<br />
2006 Average Daily Rate ($US) at 2006 Average Exchange Rate <strong>of</strong> 1.13009360<br />
2006 Average Daily Rate ($US) at Current Exchange Rate <strong>of</strong> 0.9912<br />
$250<br />
$250<br />
$200<br />
$200<br />
$150<br />
$150<br />
$100<br />
$100<br />
$50<br />
$50<br />
$-<br />
Hamilton<br />
London<br />
Orlando<br />
Dallas<br />
Ottawa<br />
Vancouver<br />
Atlanta<br />
Montreal<br />
Miami<br />
Toronto<br />
Philadelphia<br />
Chicago<br />
Boston<br />
Washington DC<br />
$-<br />
Hamilton<br />
London<br />
Orlando<br />
Dallas<br />
Atlanta<br />
Ottawa<br />
Miami<br />
Vancouver<br />
Montreal<br />
Philadelphia<br />
Toronto<br />
Chicago<br />
Boston<br />
Washington DC<br />
Source: Smith Travel Research, PKF Consulting<br />
66
6. KSF #4<br />
Cost <strong>of</strong> Destination and Venue<br />
Despite the relatively high air travel<br />
and hotel costs, the overall cost to<br />
delegates in <strong>Ontario</strong> compares<br />
favourably to selected competing<br />
convention destinations. Runzheimer<br />
International tracks costs such as<br />
meals, lodging and transportation to<br />
provide standard per diem rates for<br />
various locations. The Table to the<br />
right shows per diem rates for<br />
September 26, 2007 expressed in<br />
United States dollars at that day’s<br />
exchange rate <strong>of</strong> 0.9958.<br />
The Canadian dollar has strengthened<br />
in recent years with respect to the<br />
United States dollar, reaching an alltime<br />
high <strong>of</strong> $1.10 in November. This<br />
has decreased the value proposition<br />
for Canadian destinations soliciting<br />
United States events. Compounding<br />
this is the fact that the then<br />
favourable exchange rate has<br />
historically been used by Canadian<br />
CVBs and convention venues to attract<br />
events to Canada.<br />
Standard Per Diem ($US)<br />
$350<br />
$300<br />
$250<br />
$200<br />
$150<br />
$100<br />
$50<br />
$-<br />
$181.03<br />
London<br />
$185.88<br />
Hamilton<br />
$196.52<br />
Dallas<br />
$206.50 $208.69<br />
Atlanta<br />
Source: Runzheimer International<br />
Ottawa<br />
$223.10<br />
Vancouver<br />
$235.02 $236.24 $237.41 $239.60<br />
Los Angeles<br />
Toronto<br />
Montreal<br />
Miami<br />
$254.17<br />
Philadelphia<br />
$278.49<br />
Boston<br />
$297.49<br />
Chicago<br />
$315.48<br />
Washington DC<br />
67
6. KSF #5<br />
<strong>Tourism</strong> Appeal <strong>of</strong> the Destination<br />
In Section 5, the results <strong>of</strong> a TSW Research survey <strong>of</strong> selection criteria used by show organizers when selecting<br />
destinations and venues in which to hold their event is provided. While the most important criteria considered the<br />
appropriateness and availability <strong>of</strong> the venue space and the cost <strong>of</strong> the destination and venue, the overall<br />
attractiveness <strong>of</strong> a destination was also important:<br />
• The population and demographics <strong>of</strong> the city/region—Is there a strong local support to generate<br />
attendance at the event<br />
• Proximity and quality <strong>of</strong> hotels, restaurants, entertainment options, retail and tourist<br />
attractions to the venue—A correlation exists between a city’s popularity as a tourist destination and<br />
its attractiveness as a convention destination. To the extent the tourism infrastructure is proximate to<br />
the convention venue, the more attractive a destination is to meeting planners.<br />
• The safety and security <strong>of</strong> a destination—Safety and security in a city, particularly proximate to the<br />
venue and hotels, are a requirement <strong>of</strong> a convention destination. A city must be (or be perceived to<br />
be) a low crime area, clean and safe. The 2003 SARS outbreak in Toronto is an example. Prior to the<br />
outbreak, Toronto was considered a safe destination. Major events were cancelled or postponed<br />
almost immediately with the beginning <strong>of</strong> the pandemic. The negative effects <strong>of</strong> the outbreak on the<br />
city’s convention industry was felt for several years until Toronto was again perceived to be “safe”.<br />
68
6. Key Success Factors<br />
Implications for <strong>Ontario</strong><br />
Toronto, and to a lesser extent Ottawa (though considerably enhanced post-expansion), are well positioned to<br />
succeed in attracting national and international events.<br />
• Air lift to major Canadian urban centres as well as international destinations is relatively good,<br />
especially to/from Toronto.<br />
• As the national capital, Ottawa has a head <strong>of</strong>fice base among national associations. Many <strong>of</strong> these<br />
groups have been prohibited from meeting in Ottawa due to lack <strong>of</strong> suitable exhibit and meeting space<br />
at the Ottawa Congress Centre.<br />
• Ottawa’s downtown hotel supply exceeds the demand requirements created by the current Ottawa<br />
Congress Centre. Toronto’s supply <strong>of</strong> quality hotel rooms proximate to the Metro Toronto <strong>Convention</strong><br />
Centre is sufficient.<br />
• Both Toronto and Ottawa have considerable appeal as tourist destinations, with significant tourism<br />
infrastructure generating leisure demand.<br />
One <strong>of</strong> the principal challenges faced by Toronto and Ottawa within a North American and international context is<br />
cost, a challenge exacerbated by exchange rates. Recently, the provincially-funded <strong>Convention</strong> Development Fund<br />
(“CDF”) has provided a compelling sales aid for several <strong>Ontario</strong> cities, but even with these incentives, pricing is a<br />
challenge. <strong>Ontario</strong> is no longer a “cheap” destination. Unfortunately, given the reliance on and promotion <strong>of</strong><br />
historical cost advantages (much <strong>of</strong> this exchange rate-based), the cost challenge is one <strong>of</strong> the industry’s own<br />
making and one that the industry will need to address through provision <strong>of</strong> alternate price-value sales approaches.<br />
69
7. Issues and Challenges<br />
Introduction<br />
In addition to the industry data and interviews conducted as part <strong>of</strong> this analysis, HLT and TSW Research<br />
undertook a survey <strong>of</strong> event planners to identify awareness <strong>of</strong> and interest in <strong>Ontario</strong> as destination for one or<br />
more events (the “Survey”). The Survey was sent via email to 3,208 TSW Research database entries (mostly USbased<br />
event planners) as well as event planners identified by the <strong>Ontario</strong> publicly-owned venues. The Survey was<br />
not intended as a statistically valid analysis <strong>of</strong> event planners but does provide (largely anecdotal) insight into<br />
current thinking about <strong>Ontario</strong> as an event destination.<br />
The Survey identified several challenges that could potentially prevent the hosting <strong>of</strong> an event in Canada/<strong>Ontario</strong>,<br />
including:<br />
• border crossing issues such customs, duties an passport requirements – 54%;<br />
• United States/Canada exchange rate – 33%;<br />
• venue/convention centre costs – 23%;<br />
• cost <strong>of</strong> transportation to <strong>Ontario</strong>/venue – 19%; and<br />
• hotel rates – 10%.<br />
The Western Hemisphere Travel Initiative (“WHTI”) requiring United States Citizens to have a passport when<br />
arriving by air (and extended to include arrivals by land and sea sometime after summer 2008) has had a modest<br />
effect on travel to Canada, although the negative perceptions created have been far greater than the actual effects.<br />
Confusion over the shifting requirements <strong>of</strong> the WHTI has had more <strong>of</strong> a negative effect on <strong>Ontario</strong>’s attractiveness<br />
as a convention destination. The Canadian dollar, worth US$0.65 as recently as 2001, has strengthened over the<br />
past six years achieving a record high <strong>of</strong> US$1.10 in November 2007. After many years <strong>of</strong> marketing Canada as a<br />
“value” destination, largely as a result <strong>of</strong> currency differentials, pricing is no longer a strategic advantage.<br />
The following pages outline some additional issues and challenges facing <strong>Ontario</strong>, primarily in the North American<br />
and International marketplace.<br />
70
7. Issues and Challenges<br />
Security Concerns Affecting Travel Mobility<br />
Following September 11 th , heightened security concerns have had a limiting effect on international travel. One <strong>of</strong><br />
the by products <strong>of</strong> this increased concern is the greater requirement for visitors to the United States to obtain a<br />
visa. Canada’s policy with respect to travel visas captures some 20 fewer origin points. The Table below shows<br />
the countries where citizens are not required to have a visa to enter Canada and the United States.<br />
Andorra<br />
Antigua & Barbuda<br />
Australia<br />
Austria<br />
Barbados<br />
Belgium<br />
Botswana<br />
Brunei<br />
Canada<br />
Czech Republic<br />
Cyprus<br />
Denmark<br />
Canada * <br />
US <br />
Estonia<br />
Finland<br />
France<br />
Germany<br />
Greece<br />
Iceland<br />
Ireland<br />
Israel<br />
Italy<br />
Japan<br />
Korea, Republic <strong>of</strong><br />
Latvia, Republic <strong>of</strong><br />
Liechtenstein<br />
Luxembourg<br />
Malta<br />
Mexico<br />
Monaco<br />
Namibia<br />
Netherlands<br />
New Zealand<br />
Norway<br />
Papua New Guiney<br />
Portugal<br />
San Marino<br />
Continued<br />
Canada ** <br />
US ***<br />
Source: Visa Waiver Program Travel Guide, CIC Canada<br />
*<br />
- National Passport holders only.<br />
**<br />
***<br />
Singapore<br />
Slovenia<br />
- British citizens, British Overseas citizens who are readmissable to the UK, citizens who derive their citizenship<br />
through birth, descent, registration or naturalization in one <strong>of</strong> the British dependent territories <strong>of</strong> Anguilla, Bermuda,<br />
British Virgin Islands, Cayman Islands, Falkland Islands, Gibraltar, Montserrat, Pitcairn, St. Helena or the Turks and<br />
Caicos Islands.<br />
- for citizens with the unrestricted right <strong>of</strong> permanent abode in England, Scotland, Wales, Northern Ireland, the<br />
Channel Islands and the Isle <strong>of</strong> Man.<br />
Canada may be seen as an attractive alternative for international groups looking to generate<br />
U.S. visitation without basing the event within the United States.<br />
Solomon Islands<br />
Spain<br />
St. Kitts & Nevis<br />
St. Lucia<br />
St. Vincent<br />
Swaziland<br />
Sweden<br />
Switzerland<br />
United Kingdom<br />
United States<br />
Western Samoa<br />
71
7. Issues and Challenges<br />
Emergence <strong>of</strong> Third Party Planners<br />
Third party meeting planners, such as MCI, SmithBucklin and Experient, are becoming increasingly prevalent in the<br />
meeting, convention and trade show industry.<br />
These organizations take over many or all <strong>of</strong> the event planning tasks for associations and corporations. The<br />
destination and venue decision is typically made by the association or corporation (as opposed to the third party<br />
planner, although they can sway the decision). Third party planners <strong>of</strong>ten do, however, run an open and<br />
transparent RFP process for destination and/or venue selection.<br />
One way in which third party planners justify their fees is negotiating better rates and incentives for their clients.<br />
In fact, the ability to show purchasing power is a key success factor for third party planners. Hotel sales<br />
pr<strong>of</strong>essionals, for example, <strong>of</strong>ten deal with third parties instead <strong>of</strong> the end user. This has changed how hotel sales<br />
are conducted, reducing the importance <strong>of</strong> relationship building.<br />
72
7. Issues and Challenges<br />
Non-Traditional Competitors<br />
The emergence <strong>of</strong> “all in one” convention venues such as those operated by Gaylord Hotels as well as the multiple<br />
convention hotels in Las Vegas hotels is having a significant impact on established convention venues. When the<br />
Gaylord National Resort & <strong>Convention</strong> Centre opens in Maryland in April 2008 Gaylord Hotels will control four<br />
convention venues <strong>of</strong>fering almost 8,000 rooms and 1.9 million sq. ft. <strong>of</strong> meeting and exhibit space.<br />
Top <strong>Convention</strong> Hotels by Total Exhibit Space<br />
Rank Facility City State/Province Total Exhibit Space Rooms<br />
1 Sands Expo & <strong>Convention</strong> Center/Venetian Resort Hotel Casino Las Vegas Nevada 1,125,600 4,049<br />
2 Mandalay Bay Resort & Casino Las Vegas Nevada 934,731 3,309<br />
3 Rosen Shingle Creek Orlando Florida 445,000 1,500<br />
4 Gaylord Texan Resort & <strong>Convention</strong> Center Grapevine Texas 400,000 1,511<br />
5 Gaylord Palms® Resort & <strong>Convention</strong> Center Kissimmee Florida 400,000 1,406<br />
6 Walt Disney World Swan and Dolphin Resort Lake Buena VistaFlorida 329,000 1,509<br />
7 Gaylord Opryland® Resort & <strong>Convention</strong> Center Nashville Tennessee 263,772 2,881<br />
8 Caesars Palace Las Vegas Nevada 240,000 3,348<br />
9 Hilton Anatole Hotel Dallas Texas 231,103 1,606<br />
10 MGM Grand Hotel & Casino Las Vegas Nevada 230,000 5,034<br />
33 Sheraton Centre Toronto Hotel Toronto <strong>Ontario</strong> 100,000 1,377<br />
75 The Westin Harbour Castle Toronto <strong>Ontario</strong> 49,638 977<br />
Source: TSW Research, HLT Advisory Inc.<br />
Gaylord Hotels have been relatively successful. In 2006, they achieved an occupancy <strong>of</strong> 78.0%, an average daily<br />
rate (“ADR”) <strong>of</strong> $155.01 and a revenue per available room (RevPAR) <strong>of</strong> $120.93. For comparison purposes, Smith<br />
Travel Research operating statistics for the United States as a whole in 2006 was occupancy <strong>of</strong> 63.4%, ADR <strong>of</strong><br />
$97.33 and RevPAR <strong>of</strong> $61.93.<br />
Gaylord Entertainment is currently looking to develop a fifth property in San Diego, California, creating an ability to<br />
service association meeting planners venues for an east (Orlando, Maryland) central (Nashville, Texas) and west<br />
(San Diego) rotation. Gaylord will be able to accommodate all the convention needs <strong>of</strong> national United States<br />
Associations.<br />
73
7. Issues and Challenges<br />
Increasing Importance <strong>of</strong> Social Responsibility<br />
Event organizers (both corporate and association) are becoming increasingly socially responsible. The future<br />
leaders <strong>of</strong> these organizations are must more likely to be concerned that they, and their organization, are socially<br />
responsible.<br />
Green Meetings<br />
Increasingly, event organizers want to ensure their events are “green” or environmentally friendly. They are<br />
concerned about the environmental footprint their event leaves behind. The <strong>Convention</strong> Industry Council (“CIC”)<br />
has studied “green meetings” and “green venues”. Recommended best practices for event venues include:<br />
• use recycled and recyclable materials;<br />
• not pre-filling water glasses;<br />
• using reusable china and linen as opposed to disposable products as well as other environmentallyfriendly<br />
products;<br />
• energy efficient venues;<br />
• arrange to have leftover food donated to a local food bank or separated for pick up by composting<br />
operation or local farm;<br />
• shifting as much written communication as possible to email; and<br />
• minimize the use <strong>of</strong> collateral materials and use double-sided, recycled paper with soy-based ink.<br />
The CIC also has best practices for event organizers in destination, accommodation, event venue and<br />
transportation selection.<br />
<strong>Ontario</strong> venues can make themselves more attractive to organizers concerned with green venues by adhering to<br />
environmental programs and having details <strong>of</strong> those programs available to interested event organizers.<br />
74
7. Issues and Challenges<br />
Increasing Importance <strong>of</strong> Social Responsibility<br />
Pharma Code<br />
An issue affecting the ability <strong>of</strong> Canadian venues to attract lucrative medical conferences is the Canadian Pharma<br />
Code, which is more stringent than the United States code. Canada’s Research Based Pharmaceutical Companies<br />
created their own code to avoid government regulation. The code limits the sponsorship and hospitality<br />
opportunities available to pharmaceutical companies. The code is voluntary and self policing – in Canada,<br />
significant fines may be levied for infractions.<br />
The differences between the Pharma Codes in Canada and the United States are significant:<br />
• In the United States, pharmaceutical companies may promote their brands. In Canada, pharmaceutical<br />
companies may promote their companies but not their brands. This is less attractive to the<br />
pharmaceutical companies.<br />
• In the United States, pharmaceutical companies can underwrite convention costs such as<br />
transportation. This is not allowed under Canada’s Pharma Code.<br />
The Canadian <strong>Tourism</strong> Commission (“CTC”) believes the differences in Pharma Codes between the two countries<br />
can mean a difference <strong>of</strong> $100,000 to $1 million in pr<strong>of</strong>its for an event. This makes United States venues<br />
significantly more attractive. As these events typically book up to ten years in advance, this issue may have longterm<br />
implications for the Canadian convention industry.<br />
75
7. Issues and Challenges<br />
Changing Dynamics for Associations<br />
Association dynamics are changing. SmithBucklin recently completed a study <strong>of</strong> such mergers. In recent years,<br />
several associations have merged in an effort to address issues such as:<br />
• duplicated memberships;<br />
• similarity in association functions;<br />
• increases operating costs;<br />
• defend associations against industry consolidation; and<br />
• enabling organizations to retain members, their associated fee income and to remain relevant in<br />
changing association or industry environments.<br />
This trend is a concern to convention venues as it decreases the universe <strong>of</strong> events, lowering overall demand.<br />
Another trend is associations “piggybacking” events to capitalize on similar audiences. This can lead to enhanced<br />
revenues through greater attendance, lower costs through increased bargaining power (i.e., a longer, larger event)<br />
as well as provide more value to their memberships. Destinations and convention venues benefit considerably<br />
from such arrangements. For example:<br />
• In 2007 the S<strong>of</strong>tware and Information Industry Association’s S<strong>of</strong>tware Strategy Summit was co-located<br />
with the IDG World Expo’s S<strong>of</strong>tware as a Service event at the Santa Clara <strong>Convention</strong> Center.<br />
• The Worldwide Food Expo, held biennially in Chicago is co-located with the AMI International Meat,<br />
Poultry & Seafood <strong>Convention</strong> and Exposition and the Food, Dairy & Beverage Exposition.<br />
• The co-location <strong>of</strong> specialty food shows All Asia Food Expo, Expo Comida Latina – New York and<br />
Kosherfest contributed to boosting attendance at these events by 15% in 2006.<br />
76
7. Issues and Challenges<br />
Relationships with CVBs<br />
Ottawa<br />
Toronto<br />
Hamilton<br />
London<br />
Venue<br />
Destination <strong>Market</strong>ing<br />
Organization<br />
Relationship<br />
Ottawa Congress<br />
Centre<br />
Ottawa <strong>Tourism</strong><br />
and <strong>Convention</strong><br />
Authority<br />
Relationship<br />
Improving<br />
Source: Venues and Destination <strong>Market</strong>ing Organizations<br />
Metro Toronto Direct Energy Hamilton<br />
London<br />
Lansdowne Park <strong>Convention</strong> Centre Centre <strong>Convention</strong> Centre <strong>Convention</strong> Centre<br />
Ottawa <strong>Tourism</strong><br />
and <strong>Convention</strong><br />
Authority <strong>Tourism</strong> Toronto <strong>Tourism</strong> Toronto <strong>Tourism</strong> Hamilton <strong>Tourism</strong> London<br />
Venue does not<br />
participate with<br />
CVB<br />
Work together to<br />
administer CDF<br />
Good Working<br />
Relationship<br />
DMO responsible<br />
for marketing,<br />
venue for<br />
operations<br />
Work together to<br />
market venue,<br />
LCC participates<br />
in DMO initiatives<br />
Ideally, CVBs or Destination <strong>Market</strong>ing Organizations (“DMOs”) and convention centres work together to attract<br />
major events to the destination and venue. However, <strong>of</strong>ten tensions exist between the venue and CVB.<br />
Funding levels between the CVB and venue are significantly different. A survey <strong>of</strong> Canadian and United States<br />
venues and CVBs found the average marketing budget for venues was $735,733 while the average CVB marketing<br />
budget was $3,523,312. Further, the CVB controls the incentive funding or hotel taxes resulting in the venue being<br />
dependent on the CVB. In the United States, many venues are taking over responsibility for their own marketing.<br />
Another source <strong>of</strong> tension is the CVB’s control <strong>of</strong> the venue. The TSW Survey found the CVB controls the booking<br />
window an average <strong>of</strong> 19 months out, <strong>of</strong>ten resulting in friction between the two parties. For example, some<br />
venues have bottom-line responsibility and the CVB positions the venue as a loss-leader.<br />
A further source <strong>of</strong> tension is the two parties <strong>of</strong>ten have different measurements <strong>of</strong> success, as shown in the<br />
following Table.<br />
77
7. Issues and Challenges<br />
Success Metrics<br />
A significant difference in mandates <strong>of</strong> Canadian and United States convention venues is how success is measured.<br />
In a survey conducted by TSW Research <strong>of</strong> convention venues and CVBs, respondents were asked “How does your<br />
CVB, venue and/or hotel measure overall CVB and convention centre marketing success”. Forty percent <strong>of</strong> United<br />
States based respondents mentioned “convention center pr<strong>of</strong>it/loss” among other factors. In Canada, 62% <strong>of</strong><br />
respondents responded the same way. This result indicates a greater willingness to subsidize convention centre<br />
operations in the United States than in Canada.<br />
Venues<br />
CVBs<br />
All<br />
Respondents<br />
Canadian<br />
Respondents<br />
Total Number <strong>of</strong> Rooms Booked 79% 86% 81% 100%<br />
Total Economic Impact 68% 64% 67% 88%<br />
<strong>Convention</strong> Centre Pr<strong>of</strong>it/Loss 45% 43% 44% 62%<br />
Total Number <strong>of</strong> Visitors 36% 57% 43% 65%<br />
Hotel Community Occupancy Levels 38% 64% 46% 50%<br />
Public Relations 21% 29% 24% 25%<br />
Hotel Community Gross Sales or Pr<strong>of</strong>it 7% 7% 8% 25%<br />
Visitor Related Tax Revenues 30% 54% 39% n/a<br />
Bureau Pr<strong>of</strong>it/Loss 2% 18% 8% n/a<br />
Do Not Measure 11% 0% 7% n/a<br />
Other 16% 14% 18% 38%<br />
Source: TSW Research<br />
78
7. Issues and Challenges<br />
Restrictions on Using International Venues<br />
About 64% <strong>of</strong> the United States-based respondents to the Survey indicated their organization was able to meet in<br />
Canada with over 30% reporting they have held their largest, most-important event in Canada. Almost three<br />
quarters <strong>of</strong> the respondents to the Survey showed a willingness to consider an <strong>Ontario</strong> destination to hold their<br />
events (90.0% <strong>of</strong> Canadian-based respondents and 53.4% <strong>of</strong> United States-based respondents).<br />
Canada United States Total<br />
Able to Meet in Canada n/a 63.9% n/a<br />
Have Held Event in Canada n/a 30.6% n/a<br />
Would Consider <strong>Ontario</strong> for Event 90.0% 53.4% 74.6%<br />
Source: TSW Research<br />
The Survey <strong>of</strong> past and potential users <strong>of</strong> <strong>Ontario</strong> convention facilities indicated that 90.0% <strong>of</strong> Canadian-based<br />
respondents and 53.4% <strong>of</strong> United States based respondents would consider <strong>Ontario</strong> as a convention<br />
destination. Those respondents who would consider <strong>Ontario</strong> for their event were asked if they would consider<br />
various <strong>Ontario</strong> destinations.<br />
Canada United States Total<br />
Toronto 81.1% 94.1% 85.2%<br />
Ottawa 68.9% 23.5% 54.6%<br />
Niagara Falls 35.1% 11.8% 27.8%<br />
London 33.8% 5.9% 25.0%<br />
Hamilton 23.0% 5.9% 17.6%<br />
Other <strong>Ontario</strong> Destinations 28.4% 8.8% 22.2%<br />
Source: TSW Research<br />
This result is not surprising considering Toronto’s airlift, hotel supply in the area <strong>of</strong> the convention venue, the<br />
quality <strong>of</strong> the rentable space at the Metro Toronto <strong>Convention</strong> Centre and the cost for meeting planners and<br />
delegates compared to other Tier 1 convention destinations in North America. The next two most popular<br />
destinations were Ottawa and Niagara Falls (likely a result, in part, <strong>of</strong> name recognition). The Survey results<br />
suggest, however, the ability to attract national and international events is significantly higher in Ottawa than<br />
Niagara Falls.<br />
79
8. Opportunities for <strong>Ontario</strong><br />
Introduction<br />
The supply and demand trends within the North American (and <strong>Ontario</strong>) public-assembly marketplace, taken<br />
together with key success factors and the variety <strong>of</strong> issues facing the industry frame a future market size pr<strong>of</strong>ile for<br />
<strong>Ontario</strong>. The following pages summarize future supply implications and a demand outlook for the six principal<br />
“destinations” identified in this analysis: Toronto, Ottawa, London, Hamilton, Windsor and Niagara Falls. The<br />
selection <strong>of</strong> these six markets also reflect the current (and anticipated) location <strong>of</strong> the principal, publicly-owned<br />
(and therefore economic impact focused) public-assembly venues in <strong>Ontario</strong>.<br />
80
8. Opportunities for <strong>Ontario</strong><br />
Current and Future Supply<br />
Current and Proposed Exhibit and Meeting/Ballroom Space<br />
Exhibit<br />
Space<br />
Current Proposed (by 2010) Total<br />
Meeting/<br />
Ballroom*<br />
Exhibit<br />
Space<br />
Meeting/<br />
Ballroom*<br />
Exhibit<br />
Space<br />
Meeting/<br />
Ballroom*<br />
Toronto<br />
Metro Toronto <strong>Convention</strong> Centre 453,648 122,227 0 0 453,648 122,227<br />
Direct Energy Centre 804,563 25,000 (162,000) 90,000 642,563 115,000<br />
International Centre 471,000 28,836 0 23,000 471,000 51,836<br />
Toronto Congress Centre** 500,000 60,000 300,000 25,000 800,000 85,000<br />
Total 2,229,211 236,063 138,000 138,000 2,367,211 374,063<br />
Growth Percentage 6.2% 58.5%<br />
Ottawa<br />
Ottawa Congress Centre*** 54,113 14,941 10,880 68,803 64,993 83,744<br />
Lansdowne Park 111,000 3,000 0 0 111,000 3,000<br />
Total 165,113 17,941 10,880 68,803 175,993 86,744<br />
Growth Percentage 6.6% 383.5%<br />
Hamilton/London<br />
Hamilton <strong>Convention</strong> Centre 19,662 32,652 0 0 19,662 32,652<br />
London <strong>Convention</strong> Centre 0 43,357 0 0 0 43,357<br />
Total 19,662 76,009 0 0 19,662 76,009<br />
Growth Percentage 0.0% 0.0%<br />
Windsor/Niagara Falls<br />
Niagara Falls <strong>Convention</strong> Centre 0 0 100,000 30,700 100,000 30,700<br />
Casino Windsor 0 0 39,500 37,941 39,500 37,941<br />
Total 0 0 139,500 68,641 139,500 68,641<br />
Growth Percentage n/a n/a<br />
Total <strong>Ontario</strong> 2,413,986 330,013 288,380 275,444 2,702,366 605,457<br />
Growth Percentage 11.9% 83.5%<br />
Source: HLT Advisory Inc.<br />
* Meeting/Ballroom space may also be used for exhibitions<br />
** Does not include Phase III expansion at the Toronto Congress Centre (currently undefined)<br />
*** The 51,344 square feet <strong>of</strong> pre-function space is not included. When included, the total rentable space<br />
at the expanded Ottawa Congress Centre would exceed 200,000 square feet.<br />
Between 2007 and 2010 some<br />
560,000 square feet <strong>of</strong> exhibit,<br />
meeting and ballroom space will be<br />
added to ten venues in <strong>Ontario</strong>.<br />
Some 288,000 square feet or 51% <strong>of</strong><br />
this total is exhibit space, the<br />
balance meeting/ ballroom space.<br />
The border communities <strong>of</strong> Windsor<br />
and Niagara Falls are taking two very<br />
different approaches to the market<br />
with Niagara Falls focusing much<br />
more on exhibit-based events (75%<br />
<strong>of</strong> the Niagara Falls venue is<br />
dedicated to exhibit space versus<br />
50% in Windsor).<br />
The Ottawa Congress Centre<br />
expansion will see a substantial<br />
increase in meeting/ballroom space<br />
to complement expanded exhibit<br />
areas.<br />
The private sector exhibit halls in<br />
Toronto continue to expand while<br />
the Direct Energy Centre will add<br />
meeting capacity in part at the<br />
expense <strong>of</strong> exhibit space.<br />
81
8. Opportunities for <strong>Ontario</strong><br />
Demand Outlook<br />
The total North American convention, trade and consumer show activity for 2006 is estimated based on the<br />
Meetings <strong>Market</strong> <strong>Report</strong> and TSW Research. Compound average growth rates over the previous decade reflect<br />
modest growth at about 2.5%.<br />
Looking at the demand outlook for <strong>Ontario</strong>, consideration must be given to the growth in supply (particularly new<br />
buildings in Windsor and Niagara Falls) as well as modified building focus for the Direct Energy Center and the<br />
privately-owned trade centres in Toronto. Consideration <strong>of</strong> supply increases results in growth in the convention<br />
market <strong>of</strong> about 25% over the next ten years, including all convention events held in convention centres, trade<br />
centres and large convention hotels.<br />
Current and Projected Event Load*<br />
Current Five Year Ten Year<br />
2006 2010 2015<br />
North America<br />
<strong>Convention</strong>s 12,700 13,500 15,000<br />
Trade Shows 3,827 4,000 4,700<br />
Consumer Shows 1,209 1,250 1,475<br />
<strong>Ontario</strong><br />
<strong>Convention</strong>s 469 545 590<br />
Trade Shows 334 379 410<br />
Consumer Shows 204 233 259<br />
Source: HLT Advisory Inc.<br />
* Includes public and private venues as well as large convention hotels.<br />
82
8. Opportunities for <strong>Ontario</strong><br />
Demand Outlook – Toronto and Ottawa<br />
Toronto and Ottawa hold the greatest potential for convention events drawing attendance from outside <strong>Ontario</strong>. Of<br />
the 77 convention events held in the Metro Toronto <strong>Convention</strong> Centre, Ottawa Congress Centre and Direct Energy<br />
Centre only five are annual, recurring events. While an increase in convention activity is a reasonable assumption<br />
at the Metro Toronto <strong>Convention</strong> Centre as the Toronto market recovers, the greatest aggregate growth <strong>of</strong><br />
convention activity will occur in Ottawa as a result <strong>of</strong> the Ottawa Congress Centre expansion. By 2015, the Ottawa<br />
Congress Centre could be expected to accommodate 10 to 15 more conventions as well as increasing the draw<br />
(and size) <strong>of</strong> existing convention events due to enhanced capacity.<br />
As the privately-held trade centres add additional space, the Metro Toronto <strong>Convention</strong> Centre is likely to come<br />
under some pressure to accommodate trade and consumer show events. The convention events held at these<br />
private centres are, for the most part, expected to be local and/or regional (<strong>Ontario</strong>) based.<br />
Toronto Current and Projected Event Load*<br />
Current Five Year Ten Year<br />
2006 2010 2015<br />
<strong>Convention</strong>s 272 300 320<br />
Trade Shows 304 325 345<br />
Consumer Shows 143 155 170<br />
Source: HLT Advisory Inc.<br />
* Includes public and private venues as well as large convention hotels.<br />
Ottawa Current and Projected Event Load*<br />
Current Five Year Ten Year<br />
2006 2010 2015<br />
<strong>Convention</strong>s 139 145 160<br />
Trade Shows 28 30 35<br />
Consumer Shows 46 50 57<br />
Source: HLT Advisory Inc.<br />
* Includes public and private venues as well as large convention hotels.<br />
83
8. Opportunities for <strong>Ontario</strong><br />
Demand Outlook – Hamilton and London<br />
Hamilton and London are primarily regional venues, with most convention activity generated from southwest<br />
<strong>Ontario</strong> or elsewhere across the province. Each venue has held national events in the past and a modest<br />
penetration into the national marketplace is a reasonable expectation into the future.<br />
Both Hamilton and London are mature convention markets. As such, the potential for growth in number <strong>of</strong> events<br />
is somewhat limited. Private-sector competition (i.e., the Oakville Conference Centre and Burlington <strong>Convention</strong><br />
Centre) have put pressure on these facilities from a trade and consumer show perspective.<br />
The demand projections for <strong>Ontario</strong> assume no change in event load at these two venues although individual<br />
events are likely to increase in size (more attendees as users grow over time).<br />
Hamilton Current and Projected Event Load<br />
Current Five Year Ten Year<br />
2006 2010 2015<br />
<strong>Convention</strong>s 29 30 30<br />
Trade Shows 1 1 1<br />
Consumer Shows 12 12 12<br />
Source: HLT Advisory Inc.<br />
London Current and Projected Event Load<br />
Current Five Year Ten Year<br />
2006 2010 2015<br />
<strong>Convention</strong>s 29 30 30<br />
Trade Shows 1 1 1<br />
Consumer Shows 3 3 3<br />
Source: HLT Advisory Inc.<br />
84
8. Opportunities for <strong>Ontario</strong><br />
Demand Outlook –Windsor and Niagara Falls<br />
Similar to Hamilton and London, Niagara Falls and Windsor are primarily regional destinations from a publicassembly<br />
perspective. While both will likely host some national conventions, the majority <strong>of</strong> the convention activity<br />
will likely come from regional demand sources. As border communities, the “regional” draw will include demand<br />
from New York, Michigan and Ohio.<br />
Aside from being border communities, these venues have much greater potential to generate demand from<br />
different sources than Hamilton and London. The Casino Windsor venue will be primarily used for entertainment<br />
purposes to drive casino demand. In Niagara Falls, the supporting tourism infrastructure (such as the commercial<br />
casinos, entertainment options not to mention the Falls themselves) enhance the destination’s appeal as a<br />
convention destination.<br />
The Casino Windsor venue is projected to open in 2008. Event load estimates are presented based on the current<br />
understanding <strong>of</strong> Casino Windsor marketing focus, and recognition that as a venue primarily designed to<br />
service/generate casino demand, the marketing and sales approach will differ from all other public-assembly<br />
venues in <strong>Ontario</strong>.<br />
Windsor Current and Projected Event Load<br />
Current Five Year Ten Year<br />
2006 2010 2015<br />
<strong>Convention</strong>s 0 20 20<br />
Trade Shows 0 10 10<br />
Consumer Shows 0 5 5<br />
Source: HLT Advisory Inc.<br />
85
8. Opportunities for <strong>Ontario</strong><br />
Demand Outlook – Niagara Falls and Windsor (cont’d)<br />
The Table below compares recent event loads at <strong>Ontario</strong> convention venues to event load projections for the<br />
Niagara Falls <strong>Convention</strong> Centre as prepared by PKF. The PKF projections for Niagara Falls are higher than current<br />
results at all <strong>Ontario</strong> convention venues with the exception <strong>of</strong> Toronto.<br />
Hamilton<br />
<strong>Convention</strong><br />
Centre 2006<br />
London<br />
<strong>Convention</strong><br />
Centre 2006<br />
Actual Results<br />
Ottawa Congress<br />
Centre 2005*<br />
Metro Toronto<br />
<strong>Convention</strong><br />
Center 2006**<br />
As an internationally-recognized tourism destination, Niagara Falls <strong>of</strong>fers a variety <strong>of</strong> quality hotel rooms and a<br />
range <strong>of</strong> destination amenities. However, from a convention perspective, the lack <strong>of</strong> direct airlift may make<br />
attracting national and international events a challenge. Therefore, the demand estimate below assumes 50% <strong>of</strong><br />
the PKF projection for 2010 and 75% for 2015.<br />
Niagara Falls Current and Projected Event Load<br />
Current Five Year Ten Year<br />
2006 2010 2015<br />
<strong>Convention</strong>s 0 20 30<br />
Trade Shows 0 12 18<br />
Consumer Shows 0 8 12<br />
Source: HLT Advisory Inc.<br />
Niagara Falls<br />
Projected<br />
Stabilized Year<br />
<strong>Convention</strong>s 29 29 22 42 39<br />
Trade Shows 1 1 5 28 24<br />
Consumer Shows 12 3 5 53 15<br />
Meetings 122 224 194 452 400<br />
Total 164 257 226 575 478<br />
Source: Hamilton <strong>Convention</strong> Centre, London <strong>Convention</strong> Centre, Metro Toronto <strong>Convention</strong> Centre, PKF Consulting "Niagara Falls <strong>Convention</strong><br />
Centre Study Update", October 2004<br />
* 2005 selected for the Ottawa Congress Centre due to an eight-week labour disruption beginning April 12, 2006.<br />
** Some meeting events at the Metro Toronto <strong>Convention</strong> Centre would be considered conventions at most venues.<br />
86
8. Opportunities for <strong>Ontario</strong><br />
Conclusions<br />
Across North America demand growth, measured in terms <strong>of</strong> attendees and amount <strong>of</strong> exhibit/meeting space<br />
required for conventions, conferences, trade shows and consumer shows has been met or exceeded by the growth<br />
<strong>of</strong> new and expanded public-assembly venues. The supply/demand balance within <strong>Ontario</strong> does not necessarily<br />
reflect these North American trends except that <strong>Ontario</strong> venues competing in the national, North American and<br />
international marketplaces are facing competitive pressure caused, in part, by increased supply (together with a<br />
host <strong>of</strong> other controllable and uncontrollable factors).<br />
The opportunity for <strong>Ontario</strong>, and specific <strong>Ontario</strong> destinations, within this industry sector varies considerably by<br />
destination and by event type. In our view:<br />
• Toronto is capable <strong>of</strong> maintaining and furthering its position as a leading convention and trade show<br />
destination on both a national and international basis. The principal public- and private-sector venues<br />
are well positioned (supported by several expansion plans), the destination marketing efforts are well<br />
organized and funded, and Toronto <strong>of</strong>fers a range <strong>of</strong> attributes required by event planners.<br />
• Ottawa <strong>of</strong>fers additional opportunity in the national convention, conference and to a limited extent,<br />
trade show market. Expanding the Ottawa Congress Centre will greatly assist Ottawa in realizing latent<br />
demand.<br />
• Niagara Falls is a unique market located within the broader Toronto/south central <strong>Ontario</strong> area and<br />
adjacent to New York state. Opportunities exist for conference and convention business (likely<br />
provincial and national, as well as some trans-border).<br />
• Opportunities in Windsor are tied to casino expansion and will draw on both the southwest <strong>Ontario</strong> and<br />
Michigan markets…although events will be tied to generating gaming demand first and foremost.<br />
• London and Hamilton will remain strong competitors in the provincial marketplace.<br />
87
Appendix A<br />
Top 50 Canadian Trade Shows - 2006<br />
Rank Show Name NSF Attendance<br />
1 Global Petroleum Show 524,264 39,843<br />
2 CGTA Gift Show (Canadian Gift & Tableware Assn.) (Jan.) 425,377 21,895<br />
3 CGTA Gift Show (Canadian Gift & Tableware Assn.) (Aug.) 425,341 17,126<br />
4 The Canadian Home Furnishings <strong>Market</strong> 335,351 9,366<br />
5 Canadian Intl. Farm Equipment Show 227,000 NS<br />
6 Health & Safety Canada IAPA Conference & Trade Show (Industrial Accident Prevention Assn.) 210,000 6,000<br />
7 Alberta Gift Show (Aug.) 196,762 14,460<br />
8 Alberta Gift Show (Feb.) 196,602 15,547<br />
9 Truck World 165,900 12,912<br />
10 Montreal Gift Show (Aug.) 127,587 10,612<br />
11 Montreal Gift Show (Mar.) 124,154 10,486<br />
12 Congress featuring Fencecraft - Canada's Intl. Horticultural Lawn & Garden Trade Show & Conference 121,480 10,656<br />
13 Construct Canada/PM Expo/Homebuilder & Renovator Expo/Design Trends/Concrete Canada/Global Property <strong>Market</strong> 110,800 17,464<br />
14 HostEx 2006 103,920 9,326<br />
15 NSIA Snow Show (Natl. Snow Industries Assn.) 102,481 2,107<br />
16 American Psychiatric Assn. Annual Meeting 101,100 15,173<br />
17 CMX-CIPHEX 2006 (Canadian Mechanicals Exposition) 97,000 8,952<br />
18 Truxpo 2006 92,300 11,637<br />
19 Canadian Assn. <strong>of</strong> Agri-Retailers <strong>Convention</strong> & Trade Show 92,000 595<br />
20 PDAC Intl. <strong>Convention</strong>, Trade Show & Investors Exchange (Prospectors & Developers Assn. <strong>of</strong> Canada) 90,100 9,803<br />
21 Montreal NAFEM - The Luxury Outerwear Show 90,000 3,945<br />
22 ExpoCycle 87,700 2,278<br />
23 Canadian Manufacturing Week/Weld Expo Canada/Finishing Expo Canada 80,915 5,226<br />
24 IIDEX®/NeoCon® Canada 80,000 15,750<br />
25 Vancouver Gift Show (Mar.) 76,500 4,941<br />
26 Canadian Utilities Equipment & Engineering Show 75,845 3,041<br />
27 CamExpo 75,487 7,000<br />
28 <strong>Ontario</strong> Fashion Exhibitors (Sept.) 75,000 3,390<br />
29 Allied Beauty Assn. <strong>Ontario</strong> Beauty Show 73,800 14,279<br />
30 AAO-HNSF Annual Meeting & OTO Expo 69,800 6,121<br />
88
Appendix A<br />
Rank Show Name NSF Attendance<br />
31 Canadian Health Food Assn. Expo East Trade Show & Conference 69,000 3,351<br />
32 ICSC Canadian <strong>Convention</strong> & Trade Exposition (Intl. Council <strong>of</strong> Shopping Centers) 68,000 2,300<br />
33 Vancouver Gift Show (Sept.) 67,700 4,344<br />
34 The Canadian/Intl. Food & Beverage Show 65,000 9,717<br />
35 Salon Industriel de Quebec 65,000 9,017<br />
36 Montreal Manufacturing Technology Show featuring Montreal Fabricating & Machine Tool Show/Natl. Factory Automation Show 64,898 6,506<br />
37 Allied Beauty Assn. Salon de la Beaute 63,600 8,492<br />
38 Promotions Canada 2006 60,600 2,450<br />
39 EXFOR® 2006 60,500 4,937<br />
40 <strong>Ontario</strong> Fashion Exhibitors (Mar.) 60,000 1,817<br />
41 Grocery Innovations Canada 59,800 4,000<br />
42 WRLA Prairie Showcase Buying Show & <strong>Convention</strong> (Western Retail Lumber Assn.) 54,100 1,184<br />
43 Garden Expo featuring Florist Expo - Canada's Fall Buying Show for the Green Industry 54,070 4,481<br />
44 Buildex Vancouver/BC Construction/Design Northwest 52,500 10,846<br />
45 Salon Rendez-vous HRI Show (Hotel Restaurant Institution) 52,000 8,003<br />
46 Win-door North America 52,000 2,570<br />
47 <strong>Ontario</strong> PGA Golf Merchandise Show (Pr<strong>of</strong>essional Golfers' Assn.) 51,311 1,836<br />
48 The Interior Design Show 50,073 10,000<br />
49 IncentiveWorks 49,300 2,248<br />
50 Allied Beauty Assn. Calgary Beauty <strong>Convention</strong> 47,700 5,746<br />
Total 5,821,718 413,776<br />
Source: Tradeshow Week Research<br />
Top 50 Canadian Trade Shows - 2006 (cont'd)<br />
89
Appendix A<br />
Top 50 Canadian Trade Shows - 2005<br />
Rank Show Name NSF Attendance<br />
1 CGTA Gift Show (Canadian Gift & Tableware Association) (Aug.) 426,957 19,027<br />
2 CGTA Gift Show (Canadian Gift & Tableware Association) (Jan.) 423,989 23,764<br />
3 The Canadian Home Furnishings <strong>Market</strong> 332,272 10,558<br />
4 Canadian International Farm Equipment Show 247,594 31,182<br />
5 Alberta Gift Show (July) 204,948 15,819<br />
6 Alberta Gift Show (Feb.) 204,490 16,956<br />
7 Canadian Manufacturing Technology Show 180,159 9,966<br />
8 Montreal Gift Show (Aug.) 125,529 10,813<br />
9 Montreal Gift Show (Mar.) 124,451 10,583<br />
10 Congress featuring Fencecraft - Canada's International Horticultural Lawn & Garden Trade Show & Conference 124,100 9,184<br />
11 GO-EXPO: Gas and Oil Exposition 123,174 13,894<br />
12 Woodworking Machinery & Supply Expo 120,482 4,820<br />
13 Graphics Canada 118,810 10,265<br />
14 HostEx 2005 107,240 8,971<br />
15 Construct Canada/PM Expo/Homebuilder & Renovator Expo/Design Trends/Concrete Canada 106,900 17,087<br />
16 NSIA Snow Show (National Snow Industries Association) 100,000 1,830<br />
17 Expocam 95,747 7,540<br />
18 North American Fur & Fashion Exposition - Montreal 90,000 4,000<br />
19 PDAC International <strong>Convention</strong>, Trade Show & Investors Exchange (Prospectors & Developers Association <strong>of</strong> Canada) 87,300 7,798<br />
20 SIAL Montreal/International Food Exhibition 86,400 14,132<br />
21 IIDEX®/NeoCon® Canada 85,000 15,500<br />
22 ExpoCycle 84,810 2,533<br />
23 PACex International 84,000 12,450<br />
24 Canadian Association <strong>of</strong> Agri-Retailers <strong>Convention</strong> & Trade Show 80,000 687<br />
25 EXFOR® 2005 77,100 6,312<br />
26 Vancouver Gift Show (Mar.) 77,080 6,319<br />
27 Vancouver Gift Show (Sept.) 76,130 5,577<br />
28 Allied Beauty Association <strong>Ontario</strong> Beauty <strong>Convention</strong> 75,500 12,975<br />
29 SLA Annual Conference 70,000 5,283<br />
30 ICSC Canadian <strong>Convention</strong> & Trade Exposition (International Council <strong>of</strong> Shopping Centers) 67,600 2,250<br />
90
Appendix A<br />
Rank Show Name NSF Attendance<br />
31 American Association <strong>of</strong> Petroleum Geologists Annual <strong>Convention</strong> 66,000 4,513<br />
32 The Canadian/International Food & Beverage Show 63,800 9,776<br />
33 Society <strong>of</strong> Nuclear Medicine Annual Meeting 60,400 4,082<br />
34 Canadian Health Food Association Expo East Trade Show & Conference 60,000 3,799<br />
35 Promotions Canada 2005 60,000 2,445<br />
36 <strong>Ontario</strong> Fashion Exhibitors (Mar.) 60,000 2,000<br />
37 <strong>Ontario</strong> Fashion Exhibitors (Sept.) 60,000 2,000<br />
38 Allied Beauty Association Salon de la Beaute 59,000 9,324<br />
39 Allied Beauty Association Edmonton Beauty <strong>Convention</strong> 56,500 5,215<br />
40 Win-door North America 55,000 3,300<br />
41 <strong>Ontario</strong> PGA Golf Merchandise Show (Pr<strong>of</strong>essional Golfers' Association) 54,530 1,931<br />
42 Oil Sands Trade Show & Conference 54,120 2,425<br />
43 Hockey & Sports Show 53,300 1,500<br />
44 WRLA Prairie Showcase Trade Show & <strong>Convention</strong> (Western Retail Lumber Association) 52,200 1,053<br />
45 Salon Rendez-vous HRI Show 51,500 7,300<br />
46 Garden Expo featuring Florist Expo - Canada's Fall Buying Show for the Green Industry 51,150 3,319<br />
47 Toronto International Gift Fair (Jan.) 50,970 5,247<br />
48 The Interior Design Show 50,000 9,500<br />
49 Buildex Vancouver/BC Construction Show/Design Northwest 48,500 10,141<br />
50 IncentiveWorks 47,700 3,038<br />
Total 5,322,432 409,983<br />
Source: Tradeshow Week Research<br />
Top 50 Canadian Trade Shows - 2005 (cont'd)<br />
91
Appendix A<br />
Top 50 Canadian Trade Shows - 2004<br />
Rank Show Name NSF Attendance<br />
1 Global Petroleum Show 510,000 36,660<br />
2 CGTA Gift Show (Canadian Gift & Tableware Association) (Jan.) 426,908 22,791<br />
3 CGTA Gift Show (Canadian Gift & Tableware Association) (Aug.) 426,139 21,086<br />
4 Canadian International Farm Equipment Show 330,000 31,500<br />
5 The Canadian Home Furnishings <strong>Market</strong> 323,367 10,669<br />
6 Alberta Gift Show (Feb.) 205,650 18,030<br />
7 Alberta Gift Show (Aug.) 205,020 16,651<br />
8 Truck World 155,800 11,870<br />
9 NSIA Snow Show (National Snow Industries Association) 137,500 2,532<br />
10 Montreal Gift Show (Aug.) 124,624 11,755<br />
11 Montreal Gift Show (Mar.) 122,603 12,899<br />
12 Congress - Canada's International Horticultural Lawn & Garden Trade Show & Conference 113,270 11,426<br />
13 Canadian Utilities Equipment & Engineering Show 107,996 4,809<br />
14 HostEx 2004 106,880 9,952<br />
15 Construct Canada/PM Expo/Homebuilder & Renovator Expo/Design Trends/Concrete Canada 101,700 16,193<br />
16 North American Fur & Fashion Exposition - Montreal 92,000 4,385<br />
17 Canadian Manufacturing Week/Weld Expo Canada/Finishing Expo Canada 91,795 7,104<br />
18 EXFOR® 2004 89,000 6,506<br />
19 CMX 2004 (Canadian Mechanicals Exposition) 86,000 11,413<br />
20 PDAC International <strong>Convention</strong>, Trade Show & Investors Exchange (Prospectors & Developers Association <strong>of</strong> Canada) 84,700 5,610<br />
21 Truxpo 2004 82,990 11,269<br />
22 IIDEX®/NeoCon® Canada 80,000 15,000<br />
23 Canadian Association <strong>of</strong> Agri-Retailers <strong>Convention</strong> & Trade Show 80,000 753<br />
24 ExpoCycle 78,650 2,000<br />
25 CamExpo 78,000 8,500<br />
26 Allied Beauty Association <strong>Ontario</strong> Beauty Show 77,900 12,820<br />
27 Vancouver Gift Show (Mar.) 77,740 6,198<br />
28 Toronto International Gift Fair 77,220 5,924<br />
29 Vancouver Gift Show (Sept.) 73,580 5,703<br />
30 Montreal Fabricating & Machine Tool Show/National Factory Automation Show 72,722 6,888<br />
92
Appendix A<br />
Rank Show Name NSF Attendance<br />
31 The Canadian/International Food & Beverage Show 67,700 9,570<br />
32 Allied Beauty Association Salon de la Beaute 67,500 10,130<br />
33 ICSC Canadian <strong>Convention</strong> & Trade Exposition (International Council <strong>of</strong> Shopping Centers) 67,500 2,300<br />
34 APCO International Annual Conference & Exposition (Association <strong>of</strong> Public-Safety Communications Officials) 67,300 2,686<br />
35 Salon industriel de Quebec 65,000 7,708<br />
36 Grocery Innovations Canada 61,200 6,600<br />
37 <strong>Ontario</strong> Fashion Exhibitors <strong>Market</strong> (Sept.) 60,000 2,000<br />
38 <strong>Ontario</strong> Fashion Exhibitors <strong>Market</strong> (Mar.) 60,000 2,000<br />
39 Allied Beauty Association Edmonton Beauty Show 59,000 5,766<br />
40 Toronto Gift & Accessories <strong>Market</strong> 57,570 4,000<br />
41 <strong>Ontario</strong> PGA Golf Merchandise Show (Pr<strong>of</strong>essional Golfers' Association) 57,370 2,151<br />
42 CIM Tradex Edmonton 56,700 1,360<br />
43 Canadian Health Food Association Expo East Trade Show & Conference 52,000 3,310<br />
44 Salon Rendez-vous HRI Show 51,500 8,400<br />
45 Garden Expo featuring Florist Expo - Canada's Fall Buying Show for the Green Industry 51,250 3,611<br />
46 Canadian Waste & Recycling Expo/Canadian Public Works Expo 47,850 4,129<br />
47 WRLA Prairie Showcase Trade Show (Western Retail Lumber Association) 47,400 1,082<br />
48 <strong>Ontario</strong> Dental Association Annual Spring Meeting 47,300 7,456<br />
49 SIBO: Salon Industriel du Bois Ouvre/Industrial Woodworking Show 47,264 5,271<br />
50 Atlantic Building Materials Show 47,150 1,335<br />
Total 5,758,308 439,761<br />
Source: Tradeshow Week Research<br />
Top 50 Canadian Trade Shows - 2004 (cont'd)<br />
93
Appendix A<br />
Top 50 Canadian Trade Shows - 2003<br />
Rank Show Name NSF Attendance<br />
1 CGTA Gift Show (Canadian Gift & Tableware Association) (Jan.) 427,115 27,446<br />
2 CGTA Gift Show (Canadian Gift & Tableware Association) (Aug.) 426,948 21,490<br />
3 Canadian International Farm Equipment Show 330,000 42,000<br />
4 The Canadian Home Furnishings <strong>Market</strong> 320,589 10,207<br />
5 Alberta Gift Show (Aug.) 206,000 17,800<br />
6 Alberta Gift Show (Feb.) 205,000 19,500<br />
7 Canadian Manufacturing Technology Show 167,000 11,232<br />
8 NSIA Snow Show (National Snow Industries Association) 134,462 2,622<br />
9 Woodworking Machinery & Supply Expo 129,763 5,179<br />
10 Montreal Gift Show (Aug.) 123,475 13,233<br />
11 Graphics Canada 120,000 9,800<br />
12 Montreal Gift Show (Mar.) 119,934 14,281<br />
13 Congress - Canada's International Horticultural Lawn & Garden Trade Show & Conference 114,600 10,553<br />
14 EXFOR® 2003 110,000 6,121<br />
15 HostEx 109,400 10,440<br />
16 American Library Association Annual Conference & Exhibition 99,900 11,487<br />
17 PACex International 2003 99,505 14,750<br />
18 Construct Canada/PM Expo/Homebuilder & Renovator Expo/Design Trends/GreenBuilding Expo 96,800 15,842<br />
19 GO-EXPO: Gas and Oil Exposition 96,500 15,047<br />
20 Expocam 90,722 10,032<br />
21 Allied Beauty Association <strong>Ontario</strong> Beauty Show 90,000 12,582<br />
22 SIAL Montreal 86,400 13,500<br />
23 IIDEX®/NeoCon® Canada 82,000 14,000<br />
24 North American Fur & Fashion Exposition - Montreal 82,000 4,385<br />
25 Canadian Hardware & Building Materials Show 81,000 13,426<br />
26 Vancouver Gift Show (Sept.) 80,000 6,143<br />
94
Appendix A<br />
Rank Show Name NSF Attendance<br />
27 Vancouver Gift Show (Mar.) 79,050 7,000<br />
28 Canadian Association <strong>of</strong> Agri-Retailers <strong>Convention</strong> & Trade Show 78,500 1,176<br />
29 Toronto International Gift Fair (Jan.) 78,420 5,298<br />
30 ExpoCycle 76,740 2,650<br />
31 Grocery Innovations Canada 67,800 6,500<br />
32 ICSC Canadian <strong>Convention</strong> & Trade Exposition (International Council <strong>of</strong> Shopping Centers) 67,500 2,053<br />
33 The Canadian/International Food & Beverage Show 66,900 10,977<br />
34 Allied Beauty Association Salon de la Beaute 65,000 9,978<br />
35 Canadian Waste & Recycling Expo/Canadian Public Works Expo 61,750 3,694<br />
36 Toronto International Gift Fair (Aug.) 60,370 4,000<br />
37 <strong>Ontario</strong> PGA Golf Merchandise Show (Pr<strong>of</strong>essional Golfers' Association) 60,000 2,535<br />
38 <strong>Ontario</strong> Fashion Exhibitors <strong>Market</strong> (Mar.) 60,000 2,000<br />
39 <strong>Ontario</strong> Fashion Exhibitors <strong>Market</strong> (Sept.) 60,000 2,000<br />
40 Allied Beauty Association Edmonton Beauty Show 60,000 4,512<br />
41 CIM Tradex Montreal 2003 58,930 984<br />
42 Garden Expo 2003 53,151 3,561<br />
43 Rendez-vous Equipmag 50,000 7,000<br />
44 CHFA Toronto Expo East Trade Show & Conference (Canadian Health Food Association) 50,000 2,279<br />
45 Canadian Pool & Spa Conference & Expo 50,000 1,175<br />
46 Plant Maintenance & Design Engineering Show & Weld Quebec 48,926 4,024<br />
47 Atlantic Building Materials Show 45,750 1,304<br />
48 <strong>Ontario</strong> Dental Association Annual Spring Meeting 45,700 7,160<br />
49 ISA Calgary Instrumentation Show 2003 45,590 4,116<br />
50 Win-door North America 45,000 3,300<br />
Total 5,464,190 452,374<br />
Source: Tradeshow Week Research<br />
Top 50 Canadian Trade Shows - 2003 (cont'd)<br />
95

![THIS AGREEMENT made this [date], between [name of owner] (the ...](https://img.yumpu.com/49827605/1/158x260/this-agreement-made-this-date-between-name-of-owner-the-.jpg?quality=85)