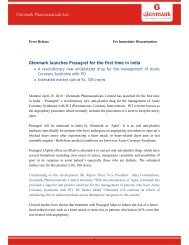
Download - Glenmark
Download - Glenmark
Download - Glenmark

Create successful ePaper yourself
Turn your PDF publications into a flip-book with our unique Google optimized e-Paper software.
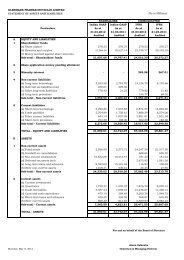
Consolidated Statement of Comprehensive Income<br />
(All amounts in millions of Indian Rupees, unless otherwise stated)<br />
Consolidated Statement of Other Comprehensive Income<br />
Note<br />
Year ended<br />
31 March 2011<br />
Profit for the year 4,578.33<br />
Other comprehensive income<br />
Exchange differences on translating foreign operations O (1,249.33)<br />
Income tax relating to components of other comprehensive income -<br />
Other comprehensive income for the year, net of tax (1,249.33)<br />
Total comprehensive income for the year 3,329.00<br />
Total comprehensive income attributable to:<br />
Non-controlling interest 46.25<br />
Equity shareholders of <strong>Glenmark</strong> Pharmaceuticals Limited 3,282.75<br />
(The accompanying notes are an integral part of these consolidated financial statements)<br />
Consolidated Statement of Changes in Shareholders' Equity<br />
(All amounts in millions of Indian Rupees, unless otherwise stated)<br />
Common<br />
stock –<br />
No. of shares<br />
Equity attributable to shareholders of <strong>Glenmark</strong> Pharmaceuticals Limited<br />
Common Additional Stock Statutory Currency Accumulated<br />
stock - paid-in compensation reserve Translation earnings<br />
Amount capital reserve<br />
reserve<br />
Total<br />
attributable<br />
to owners of<br />
the parent<br />
company<br />
Noncontrolling<br />
interest<br />
Total<br />
stockholders’<br />
equity<br />
Balance as at<br />
1 April 2010 269,837,553 269.84 7,643.87 133.91 201.00 (169.93) 9,178.77 17,257.46 264.23 17,521.69<br />
Translation<br />
adjustment - - - - - (1,249.33) - (1,249.33) - (1,249.33)<br />
Income/ (expense)<br />
recognised directly<br />
in equity - - - - - (1,249.33) - (1,249.33) - (1,249.33)<br />
Net income for the<br />
year - - - - - - 4,532.08 4,532.08 46.25 4,578.33<br />
Total income<br />
and expense<br />
recognised for the<br />
year - - - - - (1,249.33) 4,532.08 3,282.75 46.25 3,329.00<br />
Tax impact on<br />
share issue<br />
expenses - - 20.32 - - - - 20.32 - 20.32<br />
Employee<br />
share based<br />
compensation - - - 82.71 - - - 82.71 - 82.71<br />
Acquisition of noncontrolling<br />
interest - - - - - - (185.36) (185.36) (43.47) (228.83)<br />
Shares issued<br />
under Employee<br />
Stock Option<br />
(‘ESOP’) Scheme 434,500 0.43 56.71 (16.28) - - - 40.86 - 40.86<br />
Dividends paid - - - - - - (126.37) (126.37) - (126.37)<br />
Balance as at<br />
31 March 2011 270,272,053 270.27 7,720.90 200.34 201.00 (1,419.26) 13,399.12 20,372.37 267.01 20,639.38<br />
(The accompanying notes are an integral part of these consolidated financial statements)<br />
For Walker, Chandiok & Co.<br />
Chartered Accountants<br />
For and on behalf of the Board of Directors<br />
Khushroo B. Panthaky Glenn Saldanha Cheryl Pinto<br />
Partner Chairman & Managing Director Director<br />
Place: Mumbai<br />
Date: 10 May 2011<br />
Marshall Mendonza<br />
Vice President - Legal & Company Secretary<br />
Annual Report 2010-2011 81
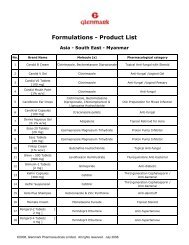
![Formulations [India] â Product List - Glenmark](https://img.yumpu.com/46601329/1/190x245/formulations-india-a-product-list-glenmark.jpg?quality=85)
![Formulation [India] â Product List - Glenmark](https://img.yumpu.com/44013338/1/190x245/formulation-india-a-product-list-glenmark.jpg?quality=85)
![Formulations [India] â Product List - Glenmark](https://img.yumpu.com/35994839/1/190x245/formulations-india-a-product-list-glenmark.jpg?quality=85)