Download - Glenmark
Download - Glenmark
Download - Glenmark

Create successful ePaper yourself
Turn your PDF publications into a flip-book with our unique Google optimized e-Paper software.
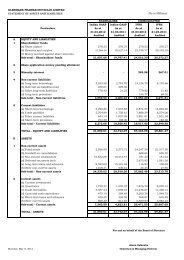
Schedules annexed to and forming part of the Balance Sheet<br />
(All amounts in millions of Indian Rupees, unless otherwise stated)<br />
As at<br />
31 March 2011<br />
As at<br />
31 March 2010<br />
4. UNSECURED LOANS Note<br />
Short term loans from Banks 6,595.91 1,221.73<br />
Other loans from Banks 1 3,234.00 4,481.73<br />
Foreign Currency Convertible Bonds [Refer Note 15 of Schedule 21] - 1,354.20<br />
Security Deposits 31.23 53.49<br />
TOTAL 9,861.14 7,111.15<br />
Note:<br />
1. Repayable within one year ` 600 (2010 - ` 500)<br />
As at<br />
31 March 2011<br />
As at<br />
31 March 2010<br />
5. DEFERRED TAX LIABILITY<br />
Depreciation/Amortisation 330.57 309.90<br />
FCC Bond/ECB Loan revaluation - 17.81<br />
TOTAL 330.57 327.71<br />
6. FIXED ASSETS<br />
As at<br />
31 March<br />
2010<br />
GROSS BLOCK DEPRECIATION/AMORTISATION NET BLOCK<br />
Additions/<br />
Transfer<br />
during the<br />
year<br />
Deductions/<br />
Transfer<br />
As at<br />
31 March<br />
2011<br />
As at<br />
31 March<br />
2010<br />
For the<br />
year<br />
On<br />
Deductions<br />
As at<br />
31 March<br />
2011<br />
As at<br />
31 March<br />
2011<br />
As at<br />
31 March<br />
2010<br />
Tangible assets<br />
Freehold land 48.47 2.58 - 51.05 - - - - 51.05 48.47<br />
Leasehold land 31.25 53.34 - 84.59 2.28 0.61 - 2.89 81.70 28.97<br />
Factory buildings 466.31 91.12 - 557.43 70.78 18.13 - 88.91 468.52 395.53<br />
Other buildings and<br />
206.94 1.08 (1.20) 206.82 27.61 3.36 - 30.97 175.85 179.33<br />
premises<br />
Plant and machinery 295.47 126.06 - 421.53 61.48 17.81 - 79.29 342.24 233.99<br />
Furniture and fittings 304.88 35.17 (0.30) 339.75 161.94 33.33 (0.20) 195.07 144.68 142.94<br />
Equipments 1,181.96 229.24 (0.56) 1,410.64 440.29 87.59 (0.31) 527.57 883.07 741.67<br />
Vehicles 36.14 0.95 (3.17) 33.92 18.26 5.00 (2.43) 20.83 13.09 17.88<br />
Intangible assets<br />
Computer software 82.15 20.53 (14.19) 88.49 36.52 15.85 - 52.37 36.12 45.63<br />
Brands 432.72 - - 432.72 363.05 28.20 - 391.25 41.47 69.67<br />
TOTAL 3,086.29 560.07 (19.42) 3,626.94 1,182.21 209.88 (2.94) 1,389.15 2,237.79 1,904.08<br />
Previous year 2,704.81 463.32 (81.85) 3,086.29 976.74 212.78 (7.31) 1,182.21 - -<br />
Capital work-in-progress<br />
(including capital advances)<br />
399.43 468.83<br />
Note:<br />
1. Addition to Fixed assets includes Capital expenditure of ` 89.98 [2010 - ` 57.97] incurred at approved Research and Development centres.<br />
2. Addition to assets include ` 10.96 (2010 - ` 7.49) being borrowing costs capitalised.<br />
Annual Report 2010-2011 57
![Formulations [India] â Product List - Glenmark](https://img.yumpu.com/46601329/1/190x245/formulations-india-a-product-list-glenmark.jpg?quality=85)
![Formulation [India] â Product List - Glenmark](https://img.yumpu.com/44013338/1/190x245/formulation-india-a-product-list-glenmark.jpg?quality=85)
![Formulations [India] â Product List - Glenmark](https://img.yumpu.com/35994839/1/190x245/formulations-india-a-product-list-glenmark.jpg?quality=85)